Original Research Article
Community diagnosis for a slum population under the field practice
area of a government medical college, New Delhi: community-oriented
primary care exercise for undergraduate students
P. Aravind Gandhi*, U. Venkatesh, Poornima Tiwari, Preety Doley
INTRODUCTION
Community Medicine as a subject and practice is being recognized as a pivotal part in the area of public health. The scope of the subject matches and is in line with the objectives of public health, which aims to prevent diseases and prolong life, with community participation. The essential and basic pillar of community medicine is
to assess the health related problems in a community, risk factors for such problems and needs of the communities it cater to, quantitatively and qualitatively, so that planning can be done for targeted and specific health interventions in that community, which is called as „Community diagnosis‟.1
Community diagnosis as defined by WHO is, “a quantitative and qualitative description of the health of citizens and the factors which influence their health. It
ABSTRACT
Background: Rapid urbanization has led to the increase in a group of people called „Urban poor‟ dwelling as a community in „Slums‟, worldwide. Slums manifest deprivation that transcends income poverty. Hence, we conducted this Community-oriented primary care (COPC) exercise, to give medical students a greater understanding of the situation of individual patients in the slum and to formulate a community diagnosis.
Methods: The current study was done at Tyagaraj Nagar Jhuggi in the South district of New Delhi, during Community-oriented primary care (COPC) exercise of undergraduate medical students in their 4th semester over a period of 20 days, using a predesigned proforma for collecting data on health events and determinants of health, from families. 35 households were chosen by systematic random sampling.
Results: Out of 179 community members studied, 33 (18.43%) were afflicted with morbidity, which consists of common cold with cough, generalized body pain and joint pain. The sex ratio was found to be 826, literacy rate was 76.9% in the study area, 44.11% of the households were having sanitary latrines owned by them, 68.6% had a closed drainage system 63% of the families used clean fuel for cooking and unmet need of contraception was 85% among eligible couples.
Conclusions: Investments in women‟s access to various contraceptive preferences are urgently needed to help increase the contraceptive prevalence rate. Health Education and awareness campaigns on prevention of potential mosquito, fly breeding sites, hand hygiene, avoidance of firewood as fuel, establishing smoke outlet and solid waste management should be arranged.
Keywords: Community diagnosis, Slum health profile, Delhi slum, Community-oriented primary care, Medical students
Department of Community Medicine, Vardhaman Mahavir Medical College and Safdarjung Hospital, New Delhi, India
Received: 01 October 2018
Revised: 02 November 2018
Accepted: 03 November 2018
*Correspondence:
Dr. P. Aravind Gandhi,
E-mail: [email protected]
Copyright: © the author(s), publisher and licensee Medip Academy. This is an open-access article distributed under the terms of the Creative Commons Attribution Non-Commercial License, which permits unrestricted non-commercial use, distribution, and reproduction in any medium, provided the original work is properly cited.
identifies problems, proposes areas for improvement and stimulates action”.2
It helps the authorities to plan and allocate resources for health in their domains of
administration from the smallest levels of
wards/mohallas/villages to blocks, towns, cities and even states. It plays an important role in planning and deliver the most effective care to those in greatest need and to direct the resources by applying the principles of equity and social justice in practice.1
In India, according to 2011 census, 37.7% of the population lives in urban area, which was 28.6% in 2001. India is witnessing a rapidly increasing urbanization trend, with rates increasing from 27.81% in 2001 to 31.16% in 2011, signifying a shift towards urbanized society in India, which is predominantly a rural based country.3 This shift gains our attention, since the determinants of health such as literacy rate, income levels, socio-economic status, accessibility to health care, health care infrastructure are differentially distributed between rural and urban areas. This rapid urbanization has also led to the increase in a group of people called „Urban poor‟ dwelling as a community in „Slums‟. Around 6.54 crore people of India live in slums. In Delhi
Municipal Corporation area, among the Urban
households, 14.6% of them are located in slums. Slums manifest deprivation that transcends income poverty. They are characterized by acute over-crowding,
insanitary, unhealthy and dehumanizing living
conditions.4
The medical council of India, the apex body for Medical education in India, has formulated the regulations for the Undergraduate Medical Curriculum with the primary objective wherein a student is able to identify and manage the common health and nutritional problems in the community, and have a preventive, promotive, curative and rehabilitative approach, rather than just curative role at hospital level.5 The emphasis has been made on providing field exposure of community to the students where students can see and observe the environmental, social, cultural and economic conditions of the people in the community, to inculcate and improve the community and social approach towards health in them.6
Community-oriented primary care (COPC) is a model that uses topics from the individual provider–patient encounter as a starting point. It combines individual patient and physician practice data with public health data at the community level, leading to a “community diagnosis”.7
The COPC exercise also presents an opportunity to invite Medical-Social Worker (MSW) & students into a joint learning experience. Finally, with this exercise we aim to create a win–win situation for both community and students, thus incorporating some of the recommendations concerning community oriented health education, such as allowing students to distinguish felt needs and actual needs, to let them learn socioeconomic determinants of health, and to let them be the community‟s advocates.
The Department of Community Medicine developed a COPC-inspired exercise as a regular component in the MBBS curriculum. The aim of the exercise is to give students a greater understanding of the situation of individual patients in the community, an appreciation of the roles of patients‟ different caregivers, and an opportunity to learn to combine data obtained from different sources into a community diagnosis, making the link between the individual‟ health and the community. The students are also supposed to develop the skill of collecting, analyzing and interpreting data from the community. In this study we have described the methods of collection, collation and analysis of the health related data obtained in the survey from a slum under the urban field practicing area of a government medical college and arrived at a community diagnosis using the data to assess the health needs and determinants of the slum population.
METHODS
The current study was done at Tyagaraj Nagar Jhuggi, a slum in Kotla-Aliganj of the South district, New Delhi, which is the Urban field practice area of the Department. The data was collected during Community-oriented primary care (COPC) exercise of undergraduate medical students in their 4th semester over a period of 20 days in May-2018, using a predesigned proforma for collecting data on health events and determinants of health, from families. A 4 day orientation session was conducted for the students under the supervision of a professor, residents, health educator and Medical Social Worker on the technical details, importance of each topic in the proforma and on the communication skills required for interaction with the community and data collection from the families, by means of role plays. Since community diagnosis is in the routine curriculum as an exercise for MBBS medical students, Ethical Committee clearance was not required and hence not sought.
RESULTS
The 35 families surveyed comprised of 179 members, with an average family size of 2.6. 54.7% were males and 45.3% of them females with a sex ratio of 826. Majority (88.6%) were following Hinduism as religion. Among the
35 families, 22 (63.1%) were migrants. Majority (58%) of the participants belonged to the age group 19-60 years i.e. adults. 18 (10.1%) of the population were under five children, 38 (21.2%) were adolescents and 9 (5%) were adolescents.
Table 1: Socio-demographic profile of the study participants/families in the community.
Variable Frequency Percentage (%)
Gender (n=179)
Male 98 54.7
Female 81 45.3
Age group wise distribution (n=179)
0-6 years 18 10.1
6-10 years 10 5.6
10-19 years 38 21.3
19-60 years 104 58
>60 years 9 5
Religion (n=35)
Hinduism 31 88.6
Others 4 11.4
Migration status (n=35)
Migrants 22 63.1
Natives 13 36.9
Family type (n=35)
Nuclear 26 74
Joint/Extended 9 26
Socio-economic status* (n=35)
Upper 1 2.85
Upper Middle 5 14.28
Lower Middle 12 34.28
Upper Lower 15 42.85
Lower 2 5.71
*Based on Kuppuswamy‟ scale, revised for CPI-January 2018.
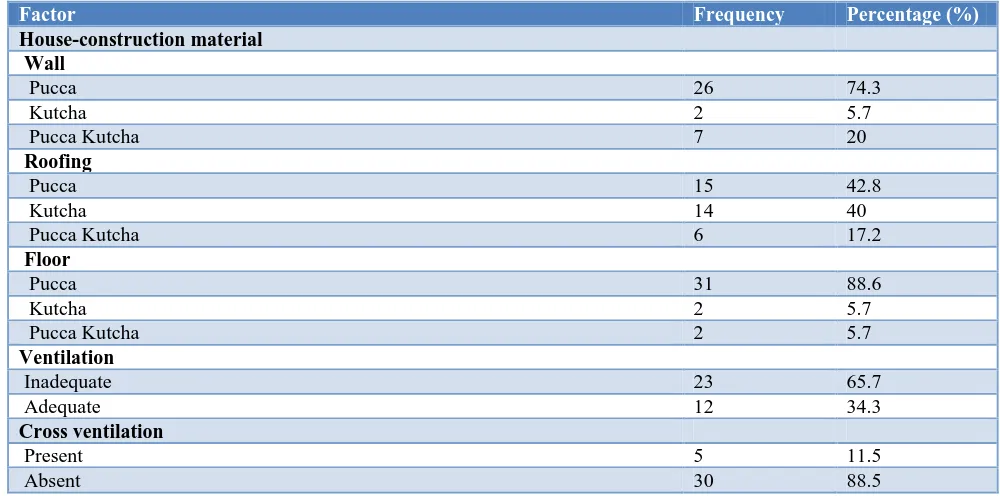
Table 2: Status of the physical, biological and psychosocial environment in the community (n=35).
Factor Frequency Percentage (%)
House-construction material Wall
Pucca 26 74.3
Kutcha 2 5.7
Pucca Kutcha 7 20
Roofing
Pucca 15 42.8
Kutcha 14 40
Pucca Kutcha 6 17.2
Floor
Pucca 31 88.6
Kutcha 2 5.7
Pucca Kutcha 2 5.7
Ventilation
Inadequate 23 65.7
Adequate 12 34.3
Cross ventilation
Present 5 11.5
Absent 30 88.5
Factor Frequency Percentage (%)
Artificial source of light
Inadequate 13 37.14
Adequate 22 62.86
Natural source of light
Inadequate 22 62.86
Adequate 13 37.14
Presence of overcrowding*
Person per Room Criteria 30 85.71
Floor Space Criteria 29 82.85
Sex Separation 18 51.40
Over all by any criteria 34 97.14
Location of the Kitchen
Open area 25 71.42
Separate in the house 4 11.42
Within a living room of the house 6 17.14
Fuel used for cooking
Cooking Gas 22 63
Firewood 7 20
Both 6 17
Smoke outlet
Present 21 60
Absent 14 40
Type of drainage
Open 24 68.6
Closed 11 31.4
Water source
Tap water supply, shared by families 26 74.3
Bottled water supply 2 5.7
Tanker supply 2 5.7
Ground water (Boring) 5 14.3
Waste disposal
Collection method inside the house
-heaps 4 11.4
-closed bins 18 51.4
-open bins 13 37.2
Disposal outside
-thrown away (into pit) 19 54.3
-public bins 16 45.7
Sanitary latrines (usage)
Yes 34 97.10
No 1 2.90
Sanitary latrines (Ownership) (N=34)
Exclusively owned by the family 15 44.11
Shared with any other families 4 11.76
Community Latrines 15 44.11
Biological environment*
Presence of Potential Mosquito breeding sites in & around households 27 77
Presence of Potential fly breeding sites in & around households 20 57
Presence of Rodents reported in the households 16 45
Presence of Pets (dogs, cats, parrot) in the households 4 11
*Mutually inclusive
The crude birth rate was 39.10 per 1000 population and the crude death rate was 11.17 per 1000 population All
The literacy rate was 76.9% in the study area. Majority (74%) of the families studied were nuclear. The average monthly income of the residents was Rs.2845. Among the participant families, 8.57% were living below poverty line, according to Tendulkar committee (state specific). Major part of the average expenditure by the families was spent on food (67%), followed by clothing (13%),
transport (7%), electricity (5%). 3% of total monthly expenditure was on health. Total dependency ratio was 57%, which had a distribution of 51.4% as young age dependency ratio and 5.6% as old age dependency ratio. Majority (42.85%) of the families belonged to Upper lower socio-economic class, followed by lower middle class (34.28%), according to revised Kuppuswamy‟ scale.
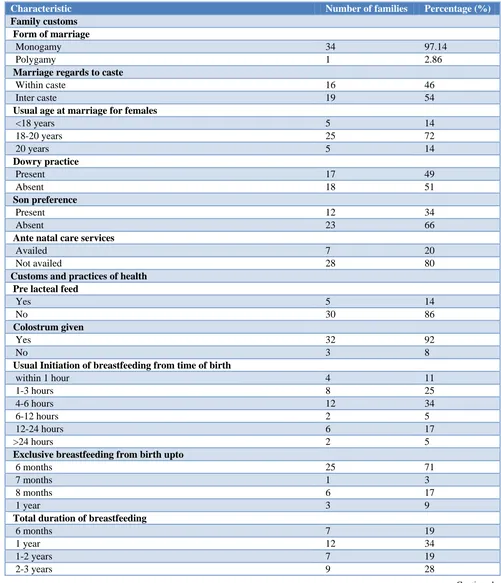
Table 3: Distribution in the community according to family customs and practices of health (n=35).
Characteristic Number of families Percentage (%)
Family customs Form of marriage
Monogamy 34 97.14
Polygamy 1 2.86
Marriage regards to caste
Within caste 16 46
Inter caste 19 54
Usual age at marriage for females
<18 years 5 14
18-20 years 25 72
20 years 5 14
Dowry practice
Present 17 49
Absent 18 51
Son preference
Present 12 34
Absent 23 66
Ante natal care services
Availed 7 20
Not availed 28 80
Customs and practices of health Pre lacteal feed
Yes 5 14
No 30 86
Colostrum given
Yes 32 92
No 3 8
Usual Initiation of breastfeeding from time of birth
within 1 hour 4 11
1-3 hours 8 25
4-6 hours 12 34
6-12 hours 2 5
12-24 hours 6 17
>24 hours 2 5
Exclusive breastfeeding from birth upto
6 months 25 71
7 months 1 3
8 months 6 17
1 year 3 9
Total duration of breastfeeding
6 months 7 19
1 year 12 34
1-2 years 7 19
2-3 years 9 28
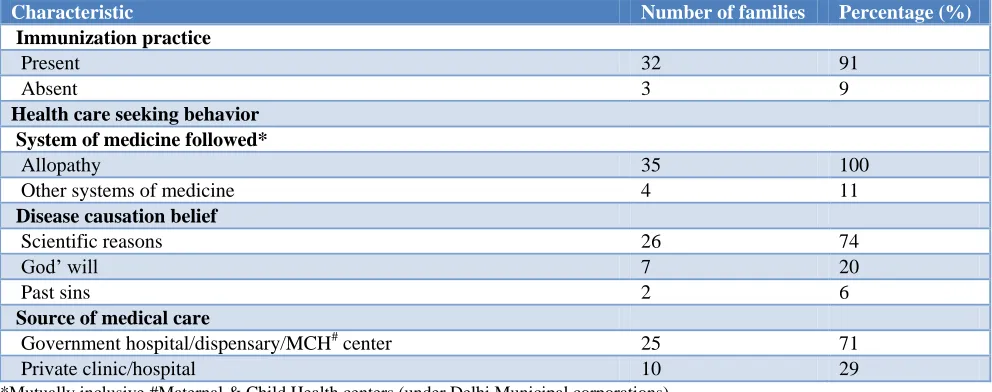
Characteristic Number of families Percentage (%)
Immunization practice
Present 32 91
Absent 3 9
Health care seeking behavior System of medicine followed*
Allopathy 35 100
Other systems of medicine 4 11
Disease causation belief
Scientific reasons 26 74
God‟ will 7 20
Past sins 2 6
Source of medical care
Government hospital/dispensary/MCH# center 25 71
Private clinic/hospital 10 29
*Mutually inclusive #Maternal & Child Health centers (under Delhi Municipal corporations)
Table 4: Distribution in the community according to delivery related and family planning practices.
Characteristic Frequency Percentage (%)
Delivery related (number of infants, n=3) Mode of delivery
Caesarean Section 1 33.33
Vaginal delivery 2 66.67
Birth weight (kg)
<2.5 2 66.67
>2.5 1 33.33
Family planning (eligible couples, n=31) Awareness about child birth planning
Present 21 68
Absent 10 32
Awareness about contraceptive measures# (n=21)
Condoms 14 66
IUCD 10 47
Sterilisation 5 23
OCPs 5 23
Places known to acquire contraception (n=21)
Government hospital/dispensary/MCH center 14 40
Private clinic/chemists 5 14
Anganwadi 2 6
Preferred gap between children in years (n=31)
1 2 6
2 6 20
3 14 42
4 10 32
Couples with unmet needs* for contraception (n=21) 18 85
Unmet need for spacing (n=18) 15 83
Unmet need for permanent contraception (n=18) 3 17
*Unmet need for family planning refers to fecund women who are not using contraception but who wish to postpone the next birth (spacing) or stop childbearing altogether (limiting); #Mutually Inclusive.
All the children (100%) were immunized appropriately for their age. 100% institutional delivery was observed in the community (n=3).
Table 5: Distribution of morbidity status in the community according to gender and age groups
(n=179).
Variable Morbid (%) Not diseased (%)
Gender wise
Male 18 (10.05) 80 (44.69)
Female 15 (8.38) 66 (36.88)
Age groups wise (years)
0-5 3 (1.67) 15 (8.38)
5-10 2 (1.12) 8 (4.47)
10-19 4 (2.23) 34 (18.99)
19-60 17 (9.49) 87 (48.62)
>60 7 (3.91) 2 (1.12)
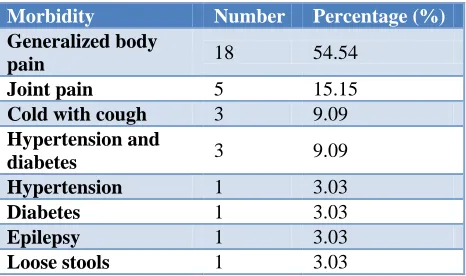
Table 6: Morbidity profile of the community (n=33).
Morbidity Number Percentage (%)
Generalized body
pain 18 54.54
Joint pain 5 15.15
Cold with cough 3 9.09
Hypertension and
diabetes 3 9.09 Hypertension 1 3.03
Diabetes 1 3.03
Epilepsy 1 3.03
Loose stools 1 3.03
DISCUSSION
The prevalence of morbidity in our community was 18.43%, similar to the morbidity rate of 15.4% obtained in the studies by Marimuthu at slums of Delhi and South India, but higher than the All India Urban morbidity, which was 10.8%.8,9 This higher rate might be due to the unhealthy living conditions which can be attributed to the slums, in general.4
63% of the participant families were migrants, which is very much higher than the national migration rate of 29%, indicating the marginalized nature of the community.3 This might be due to the rapid growth of Delhi as a major provider of employment, thus pulling huge migrations from the nearby states.9
The sex ratio in our community was found to be 826 which is much lower than that of national (991), Delhi (849) and overall city slums‟ sex ratio, but higher than the sex ratio obtained (729), in the study conducted by Marimuthu in Delhi slums.8 Lower sex ratio might be due to the son preference prevailing in Indian societies.11 The sex ratio lower than the national average might be due to the reason that majority of the families in our population are migrated and migratory population are predominantly male populated, as employment is the major reason for migration, and slums constitute manual labor migratory population, formed by the males.12,13
Literacy rate in our community is 76.9% whereas the national rate is 74.04%, and in overall slums is 84.11%.4,14 The difference of 8 percentage points between national level literacy rates in slums and our study population might have been due to greater migratory nature (63%) of our community.
74.3% of the families studied were getting their drinking water by taps, shared with other families which is similar to the drinking water source used by the slums, nationally (74%).4 2 (5.7%) families in our community were using the bottled water supply for drinking, as one of the members from each family were working in the bottled water manufacture and/or distribution firms in Delhi.
The Municipal Corporation shall be informed of the need for continuous water supply in the pipes and more public dust bins in the community, as the wastes are being thrown into pits by majority of the families (54.3%).
Our community study revealed that 44.11% were having sanitary latrines owned by them, exclusively, whereas nationally 66% of the slum households were owning latrines.4 The initiative for building toilets for each household under swatch bharat must be promoted to cover the rest of the families in the community. However, open defecation was practiced by only 1 (2.90%) family studied, against a whopping 18.9% slum families practicing open defecation overall. This indicates a better sanitary latrine knowledge and practice among our community, thus indicating the scope for health education and empowerment of the community in other domains.
Our community reported that 63% of the families used clean fuel for cooking, whereas 97.7% of the families in Delhi and 43.8% of the families nationally, reported using clean cooking fuel.14,15 The stark difference between Delhi and our study population might be due to lack of awareness about the government schemes subsidizing clean fuel or lack of financial resources to acquire clean fuel. One other reason might be the inability to utilize Pradhan Mantri Ujjwala Yojana, which has made Aadhaar of poor women a mandatory for obtaining LPG connection. Since the migratory population mostly have the Aadhaar issued from their home state, this might be causing red-tapism to obtain LPG connection in Delhi.16 This in turn will lead to usage of unsafe 4-5 kg mini cylinders, which are refilled locally, under totally unsafe and unauthorized condition, posing a greater risk of accidents.17,18
68.6% of the households in our community had a closed drainage system, which is way above the rate (36.9%) reported by the national level survey of slums.4 This might be due to the better service provision by the Delhi Jal Board.
India (12.9%).14,15 This is interesting, especially when interpreted with the finding that 67.74% of the eligible were aware about contraceptives and the places to acquire them. But they were not aware that ASHAs can provide certain contraceptives. Thus the unmet need might have been caused due to the gap between the ASHAs and community, or the reluctance of the community to approach the health centers to get the contraceptives. It becomes even more important, since majority (74%) of the eligible couples, preferred a gap of 3-4 years between child birth. Thus addressing the unmet need alone can provide greater health effects, as the community is already aware of contraception & preferred gap between child births. The difference between the need and supply is huge, warranting further investigations and probing into the determinants responsible for such a wide gap of unmet needs in our community. In addition, the remaining eligible couples should be made aware about the necessity and availability of family planning services
Only 11% of our study families reported early initiation of breastfeeding, while 29.1% in Delhi and 41.6% in India reported early initiation of breastfeeding.14,15 In our study, exclusive breastfeeding for 6 months was reported as custom in 71% of the families, which is well above the national (54.9%) and Delhi rates (49.6%).14,15 The inadequacies in their breastfeeding customs and practices might be attributed to the cultural and societal norms in which the families are bred. The early initiation of breastfeeding within 1 hour, avoidance of pre-lacteal feeds, duration of exclusive breastfeeding, and continuation of breastfeeding, must be promoted in the community.
CONCLUSION
Investments in women‟s access to various contraceptive preferences are urgently needed to help increase the contraceptive prevalence rate. Thus, interventions that focus on needier sections of the population will accelerate contraceptive acceptance and improve maternal and child health. Health Education and awareness campaigns on prevention of potential mosquito, fly breeding sites, hand hygiene, avoidance of firewood as fuel, establishing smoke outlet and solid waste management should be arranged. Lighting can be improved by addition of LEDs, which is being provided at subsidized rates by the Government of India. Families in Overcrowded, poorly
ventilated and kutcha houses need to be
relocated/rehabilitated, which involves greater
commitment and involvement at the highest level of Government through the Slum Improvement/Slum clearance schemes, Pratan Mantri Awas Yojana, “In-situ” slum rehabilitation.Nowadays there is a renewed interest in the role of primary care as an essential component of the delivery of health care and COPC is a broad approach to care, taking into account the socioeconomic and cultural factors of health, pinpointing health needs, and providing health care to the total community. Accordingly, further studies are needed to explore the
environmental and social determinants of slums as to why they have higher morbidity and mortality, and studies need to consider collecting and using longitudinal data to compare health indicators among these residential domains.
ACKNOWLEDGEMENTS
We would like to thank the students of 2016 batch who were involved in the exercise and helped us in data collection. We would like to thank the families who co-operated to be included in the exercise and the Staffs Mr Pathak and Mrs Alka who liaised with the community.
Funding: No funding sources Conflict of interest: None declared Ethical approval: Not required
REFERENCES
1. Community Health Needs Assessment: An
introductory guide for the family health nurse in
Europe. World Health Organization. 2001.
Available from: http://www.euro.who.int/en/health-topics/Health-systems/nursing-and-midwifery/ publications/2001/community-health-needs- assessment-an-introductory-guide-for-the-family-health-nurse-in-europe. Accessed 29 September 2018.
2. Basic Principles of Healthy Cities: Community Diagnosis. Available at: https://www.chp.gov.hk/ files/pdf/hcp_community_diagnosis_en.pdf.
Accessed 29 September 2018.
3. Rural urban distribution of population. Census of India, 2011. Available at: http://censusindia. gov.in/2011-prov-results/paper2/data_files/india/ Rural_Urban_2011.pdf. Accessed 29 September 2018.
4. Slums in India, A Statistical Compendium. Ministry of Housing and Urban Poverty Alleviation. 2015.
Available from:
http://nbo.nic.in/Images/PDF/SLUMS_IN_INDIA_
Slum_Compendium_2015_English.pdf. Accessed
29 September 2018.
5. Graduate Medical Education Regulations 1997. Medical Council of India. New Delhi; 1997. Available from: https://old.mciindia.org/Rulesand Regulations/GraduateMedicalEducationRegulations 1997.aspx. Accessed 29 September 2018.
6. Anita N, Gopal I. From classroom to community: teaching Community Medicine in India. South East Asian J Med Educ. 2008;2:5-8.
7. Abramson JH, Kark SL. Community Oriented
Primary Care: Meaning and Scope. In: Geiger J, Connor E, Mullan F, eds. Community Oriented Primary Care: New Directions for Health Services Delivery: National Academies Press; 1983. 21-23. 8. Marimuthu P, Meitei MH, Sharma B. General
9. Morbidity profiles of Kerala and All-India: an economic perspective. 2012. Available from: http://www.igidr.ac.in/pdf/publication/WP-2008-007.pdf. Accessed 29 September 2018.
10. Study on Counter Magnet Areas To Delhi & NCR. Available at: http://ncrpb.nic.in/pdf_files/06_ hapter3_cma.pdf. Accessed 29 September 2018. 11. Economic Survey 2017: Volume I, Chapter 7:
Gender and Son Meta-Preference: Is Development
Itself an Antidote? Available from:
http://mofapp.nic.in:8080/economicsurvey/pdf/102- 118_Chapter_07_ENGLISH_Vol_01_2017-18.pdf. Accessed 29 September 2018.
12. Raphael S. International migration, Sex ratios, and the socioeconomic outcomes of onmigrant Mexican women. Demography. 2013;50:971-91.
13. Smallwood S, De Brow S. Sex ratio patterns in
population estimates. Population Trends.
2009;137:41-50.
14. National Family Health Survey 2015-16, India Fact Sheet. Indian Institute of population Studies.
Available at: http://rchiips.org/NFHS/pdf/NFHS4/ India.pdf. 2017. Accessed 29 September 2018. 15. National Family Health Survey 2015-16, Delhi Fact
Sheet. Indian Institute of population Studies. Available at: http://rchiips.org/NFHS/pdf/NFHS4/ India.pdf. 2017. Accessed 29 September 2018. 16. Aadhaar now a must for poor women to get free
LPG connection. FirstPost. March 08, 2017.
17. Liquefied Petroleum Gas (Regulation Of Supply And Distrubution) Order, 2000. In: Gas MOPAN, editor. New Delhi.
18. Delhi govt cracks down on illegal LPG refilling units. The Indian Express. January 26, 2014.
Cite this article as: Gandhi PA, Venkatesh U, Tiwari P, Doley P.Community diagnosis for a slum
population under the field practice area of a