Sample size for estimation of direct effects in
path analysis of corn
M. Toebe1, A. Cargnelutti Filho2, L. Storck2 and A.D. Lúcio2
1Universidade Federal do Pampa, Campus Itaqui, Itaqui, RS, Brasil 2Departamento de Fitotecnia, Universidade Federal de Santa Maria,
Santa Maria, RS, Brasil
Corresponding author: A. Cargnelutti Filho
E-mail: [email protected]
Genet. Mol. Res. 16 (2): gmr16029523 Received November 7, 2016
Accepted February 16, 2017 Published April 13, 2017
DOI http://dx.doi.org/10.4238/gmr16029523
Copyright © 2017 The Authors. This is an open-access article distributed under the terms of the Creative Commons Attribution ShareAlike (CC BY-SA) 4.0 License.
at four accuracy levels [95% confidence interval ranges (95%CI) of
0.15, 0.25, 0.35, and 0.45]. The use of the ninth scenario of path analysis is recommended regardless of hybrid and harvest given the smaller sample size required compared to the previous scenarios. To estimate direct effects with the maximum 95%CI of 0.25, 10 to 530 plants are required depending on the type of hybrid, harvest, scenario, type of path analyses, and explanatory variables. To estimate the direct effects
in the ninth scenario with a maximum 95%CI of 0.25, 120 plants suffice
regardless of the type of hybrid, harvest, or type of path analyses.
Key words: Zea mays L.; Resampling; Linear relationships; Indirect selection
INTRODUCTION
Corn is the cereal with the highest volume of world production according to the United States Department of Agriculture (USDA, 2016), with production estimated at 1025.69 million tons for the 2016/2017 crop in an area of 180.20 million hectares. Also according to USDA (2016), Brazil is the third largest corn producer, with an area of 16.40 million hectares and estimated productivity by 5.09 tons per hectare and total production of 83.5 million tons. It is estimated that the genetic breeding has contributed with some 50% of increase in corn production in recent decades (Duvick, 2005). In this sense, plant selection in genetic breeding can be performed directly or indirectly by studying linear relationships between traits (Cruz and Regazzi, 1997; Cruz and Carneiro, 2006).
The study of linear relationships can be carried out by the Pearson correlation
coefficient (Cruz, 2005; Ferreira, 2009) and by complementary methods, such as using path analysis, with partitioning of the correlation coefficients into direct and indirect effects on the
main variable (Wright, 1921, 1923, 1934; Cruz and Regazzi, 1997; Cruz and Carneiro, 2006). Indirect selection can be performed when there are relations of cause and effect between variables, with high scores of correlation and direct effects of the same intensity and direction (Cruz and Regazzi, 1997; Cruz and Carneiro, 2006). Thus, path analysis has been widely used in studies of linear relationships between traits and for indirect selection of corn plants (Alvi et al., 2003; Jayakumar et al., 2007; Lopes et al., 2007; Selvaraj and Nagarajan, 2011; Langade
et al., 2013) and contrasting coefficients have been reported in the literature.
The use of an adequate sample size is necessary for the results generated by path analysis studies to be reliable. Sample sizing studies have previously been conducted using corn to estimate the mean values (Wolkowski et al., 1988; Magari et al., 1996; Costa et al.,
2003; Vasić et al., 2003; Storck et al., 2007; Brera et al., 2010; Modolo et al., 2013; Toebe et al., 2014) and Pearson correlation coefficients between traits (Cargnelutti Filho et al., 2010; Toebe
et al., 2015). The sample sizes recommended in those studies range from 10 to 674 plants depending on the genetic basis, harvest, variable, site, management, and level of accuracy considered. Resampling has been used for sample sizing in agricultural crops (Cargnelutti Filho et al., 2010, 2013; Toebe et al., 2014, 2015), especially in cases where the probability distribution of the data is unknown (Ferreira, 2009).
sample size may be one of the causes of the different estimates of direct effects reported in the literature. Although Petraitis et al. (1996) and Streiner (2005) included a general discussion on sample size requirements for conducting a path analysis, we are aware of no references regarding the sample size required for an accurate estimate of direct effects in path analysis of corn. Thus, the objective of this study was assess the sample size required for estimating the direct effects of explanatory variables on the grain yield of corn in the combinations formed by three types of hybrids x two harvests x nine scenarios of explanatory variables x two types of path analyses x four levels of accuracy.
MATERIAL AND METHODS
Were conducted two experiments with corn (Zea mays L.) in the experimental area of the Department of Plant Science, Federal University of Santa Maria (Universidade Federal de Santa Maria - UFSM) (29°42’S, 53°49’W, altitude 95 m), Santa Maria, State of Rio Grande do Sul, Brazil.
In the first experiment, conducted during the 2008/2009 harvest, four plots were sown with the
single-cross hybrid P32R21, four with the triple-single-cross hybrid DKB566, and four with the double-single-cross hybrid DKB747 on December 26, 2008. In the second experiment, conducted during the 2009/2010 harvest, sixteen plots were sown with the single-cross hybrid 30F53, sixteen with the triple-cross hybrid DKB566, and sixteen with the double-cross hybrid DKB747 on October 26, 2009.
Each plot consisted of four 6-m long rows spaced 0.80 m apart, and the density was
set at five plants per linear meter, equivalent to 62,500 plants/ha, totaling 1440 plants in the first experiment (3 hybrids x 4 plots/hybrid x 120 plants/plot) and 5760 plants in the second
experiment (3 hybrids x 16 plots/hybrid x 120 plants/plot). At each harvest, the single-, triple-, and double-cross hybrid plots were randomized in the experimental area. In both experiments, the fertilization applied at planting was 750 kg/ha granular fertilizer 3-24-18 (NPK) and a top-dressing fertilization consisted of 300 kg/ha urea with 45% N. Other crop treatments were also performed according to the recommendations for corn (Fancelli and Dourado Neto, 2004).
During the 2008/2009 harvest, 361, 373, and 416 plants of the single-, triple-, and double-cross hybrids were evaluated, respectively. In the second experiment conducted during the 2009/2010 harvest 1777, 1693, and 1720 plants of the single-, triple-, and double-cross hybrids were evaluated, respectively. Thus, a total of 6340 plants were evaluated. The following explanatory variables were measured in each of the 6340 plants evaluated: plant height at harvest (PH), ear insertion height (EIH), ear weight (EW), number of grain rows per ear (NR), ear length (EL), ear diameter (ED), cob weight (CW), cob diameter (CD), 100-grain mass (HGM), number of grains per ear (NGE), and grain length (GL). The main variable grain yield (YIELD) was also measured in each plant. Only plants exhibiting all traits described
above were evaluated. Therefore, the final number of plants evaluated at each harvest differed
among the single-, triple-, and double-cross hybrids.
For each hybrid and harvest, 199 sample sizes were planned, with an initial sample size of 10 plants and the other sample sizes increasing sequentially in 5-plant increments. Therefore, the sample sizes planned were n = 10, 15, 20, ..., 1000 plants. For each sample size planned, 1000 resamples with replacement were generated and in this step were planned nine scenarios to conduct traditional and ridge path analyses; these scenarios differed from each other regarding the number of variables excluded before performing the path analyses. Thus, 0, 1, 2, 3, 4, 5, 6, 7, and 8 explanatory variables were excluded from scenarios 1, 2, 3, 4, 5, 6, 7, 8, and 9, respectively, before performing the path analyses. Explanatory variables
Hair et al., 2009) and those that are difficult to measure were priority excluded. Therefore, 11
explanatory variables in scenario 1 (PH, EIH, EW, NR, EL, ED, CW, CD, HGM, NGE, and GL), 10 in scenario 2 (PH, EIH, NR, EL, ED, CW, CD, HGM, NGE, and GL), 9 in scenario 3 (PH, EIH, NR, EL, ED, CW, CD, HGM, and NGE), 8 in scenario 4 (PH, EIH, NR, EL, ED, CW, CD, and HGM), 7 in scenario 5 (PH, EIH, NR, EL, ED, CD, and HGM), 6 in scenario 6 (PH, EIH, NR, EL, ED, and HGM), 5 in scenario 7 (PH, EIH, NR, EL, and ED), 4 in scenario 8 (PH, EIH, EL, and ED), and 3 explanatory variables in scenario 9 (EIH, EL, and ED) were analyzed when conducting the path analyses.
In each scenario within each resample for each sample size planned, the Pearson correlation matrices X’X (between explanatory variables) and X’Y (between each explanatory variable and YIELD) were estimated. Next, the direct and indirect (data not shown) effects of the traditional path analysis were estimated using a single-causal diagram by normal equations
ˆ
' '
X Xβ = X Y (Wright, 1921, 1923, 1934; Cruz and Regazzi, 1997; Cruz and Carneiro, 2006). A ridge path analysis was also conducted in each resample for each scenario. For this purpose, the appropriate k value in the interval from 0 ≤ k ≤ 1 was initially chosen to ensure condition number (CN < 100) and weak multicollinearity between the explanatory variables (Montgomery and Peck, 1982); k values were tested in ascending order, by adding a value equal to 0.0001 at each step and assessing the degree of multicollinearity to CN < 100. Then, this k value was added to the diagonal of the correlation matrix X’X, and the direct and indirect (data not shown) effects of the ridge path analysis were estimated for each scenario in each resample using the system ( ' ) 'X X + k βˆ = X Y (Carvalho et al., 2001; Cruz and Carneiro, 2006).
Therefore, 1000 resamples were generated for each hybrid, harvest and sample size planned, and in each resample, estimates of the direct and indirect (data not shown) effects were obtained in the traditional and ridge path analyses for the nine scenarios. Thus, for each hybrid, harvest and sample size planned, 1000 estimates of each statistic (direct and indirect effects in the traditional and ridge path analyses for each of the nine scenarios) were generated, and based on these 1000 estimates, the 2.5%, the mean, and the 97.5% were determined, and the 95%
confidence interval range (95%CI) was calculated as the range between the 97.5 and 2.5%. To
determine the sample size (number of plants) required to estimate the direct effects of explanatory variables on YIELD, the maximum limits of the 95%CI of the direct effect were initially set at accuracy levels of 0.15 (greatest accuracy), 0.25, 0.35, and 0.45 (least accuracy). Then, for each hybrid, harvest, scenario, type of path analyses, and explanatory variable, starting from the initial sample size (n = 10 plants), the minimum number of plants for which the magnitude of the 95%CI of the direct effect was less than or equal to the maximum limit established at each accuracy level (0.15, 0.25, 0.35, or 0.45) was considered the appropriate sample size (n).
Finally, scenario 4 from the traditional path analysis conducted with the single-cross hybrid 30F53 of the 2009/2010 harvest was chosen, and the 2.5%, the mean, and the 97.5% of the 1000 estimates of the direct effects of EIH and CW on YIELD for some of the planned sample sizes (n = 20, 30, ..., 1000 plants) were plotted. The direct effects of the other explanatory variables, scenarios, types of path analyses, hybrids, and harvests were not plotted, considering the volume of resulting graphs and the repetition of data already shown in tables. All statistical analyses were performed using the R software (R Development Core
Team, 2016) and Microsoft Office Excel®.
1000 resamples generated and in each sample size planned. Therefore, within a given scenario, resamples with CN ≥ 100 may occur for which a value of k > 0 was attributed and resamples with CN < 100 for which k = 0 was attributed in the ridge path analysis, the latter generating results equal to those generated in the traditional path analysis. Thus, an approximation of the sample sizes required for the traditional and ridge path analyses in each scenario is expected to occur from the third to the ninth scenarios, considering the small multicollinearity effect (data not shown) and little need to add k in the ridge path analysis (Tables 1 to 12). However, sample size differences may occur in cases where resamples require adding k > 0, resulting in different estimates of direct effects between the traditional and ridge path analyses.
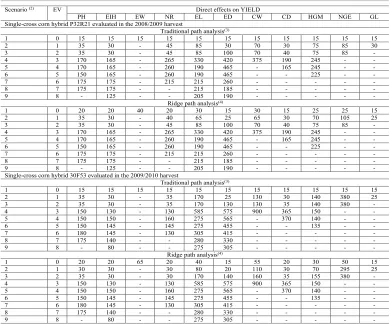
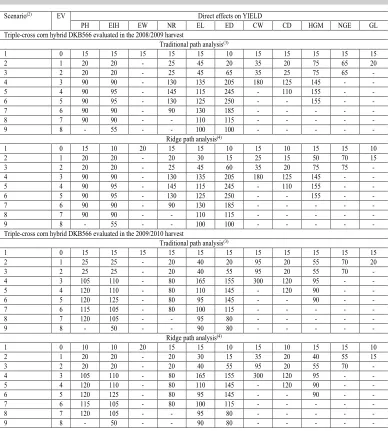
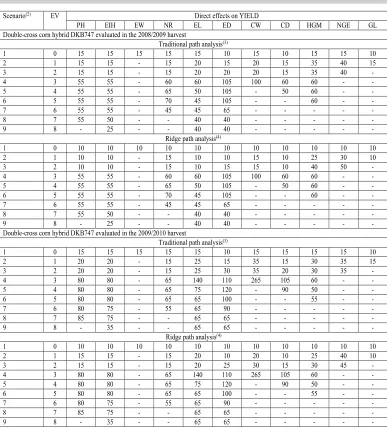
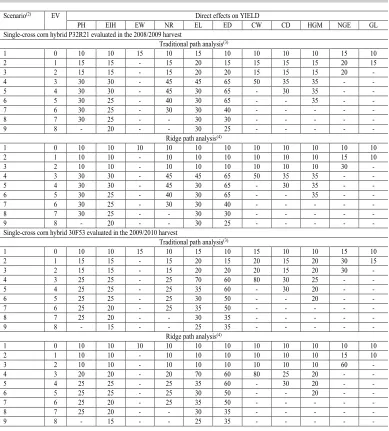
Table 1. Sample size (number of plants) for estimating the direct effects of explanatory variables(1) on grain
yield (YIELD) with a 95% confidence interval range equal to 0.15 for each path analysis scenario with the respective number of excluded variables (EV) in the single-cross corn hybrids P32R21 and 30F53 evaluated in the 2008/2009 and 2009/2010 harvests, respectively.
(1)PH: plant height at harvest; EIH: ear insertion height; EW: ear weight; NR: number of grain rows per ear; EL: ear length;
ED: ear diameter; CW: cob weight; CD: cob diameter; HGM: 100-grain mass; NGE: number of grains per ear; GL: grain length. (2)Scenarios defined in Material and Methods. (3)No change in the X’X correlation matrix between explanatory
variables, regardless of the condition number (CN). (4)Path analysis performed after adding a k value to the diagonal of the
X’X correlation matrix, and choosing the smallest k value sufficient to reduce the CN to <100. When the initial CN was <100, k = 0.0000 was added and the ridge path analysis produced the same values found in the traditional path analysis.
Scenario (2) EV Direct effects on YIELD
PH EIH EW NR EL ED CW CD HGM NGE GL Single-cross corn hybrid P32R21 evaluated in the 2008/2009 harvest
Traditional path analysis(3)
1 0 15 15 15 15 15 15 15 15 15 15 15 2 1 35 30 - 45 85 30 70 30 75 85 30 3 2 35 30 - 45 85 100 70 40 75 85 - 4 3 170 165 - 265 330 420 375 190 245 - - 5 4 170 165 - 260 190 465 - 165 245 - - 6 5 150 165 - 260 190 465 - - 225 - - 7 6 175 175 - 215 215 260 - - - - - 8 7 175 175 - - 215 185 - - - - - 9 8 - 125 - - 205 190 - - - - -
Ridge path analysis(4)
1 0 20 20 40 20 30 15 30 15 25 25 15 2 1 35 30 - 40 65 25 65 30 70 105 25 3 2 35 30 - 45 85 100 70 40 75 85 - 4 3 170 165 - 265 330 420 375 190 245 - - 5 4 170 165 - 260 190 465 - 165 245 - - 6 5 150 165 - 260 190 465 - - 225 - - 7 6 175 175 - 215 215 260 - - - - - 8 7 175 175 - - 215 185 - - - - - 9 8 - 125 - - 205 190 - - - - - Single-cross corn hybrid 30F53 evaluated in the 2009/2010 harvest
Traditional path analysis(3)
1 0 15 15 15 15 15 15 15 15 15 15 15 2 1 35 30 - 35 170 25 130 30 140 380 25 3 2 35 30 - 35 170 130 130 35 140 380 - 4 3 150 130 - 130 585 575 900 365 150 - - 5 4 150 150 - 160 275 565 - 370 140 - - 6 5 150 145 - 145 275 455 - - 135 - - 7 6 180 145 - 130 305 415 - - - - - 8 7 175 140 - - 280 330 - - - - - 9 8 - 80 - - 275 305 - - - - -
Ridge path analysis(4)
(1)PH: plant height at harvest; EIH: ear insertion height; EW: ear weight; NR: number of grain rows per ear; EL:
ear length; ED: ear diameter; CW: cob weight; CD: cob diameter; HGM: 100-grain mass; NGE: number of grains per ear; GL: grain length. (2)Scenarios defined in Material and Methods. (3)No change in the X’X correlation matrix
between explanatory variables, regardless of the condition number (CN). (4)Path analysis performed after adding
a k value to the diagonal of the X’X correlation matrix, and choosing the smallest k value sufficient to reduce the Table 2. Sample size (number of plants) for estimating the direct effects of explanatory variables(1) on grain yield
(YIELD) with a 95% confidence interval range equal to 0.15 for each path analysis scenario with the respective number of excluded variables (EV) in the triple-cross corn hybrid DKB566 evaluated in the 2008/2009 and 2009/2010 harvests.
Scenario (2) EV Direct effects on YIELD
PH EIH EW NR EL ED CW CD HGM NGE GL
Triple-cross corn hybrid DKB566 evaluated in the 2008/2009 harvest
Traditional path analysis(3)
1 0 15 15 15 15 15 15 15 15 15 15 15
2 1 35 35 - 55 130 35 75 35 185 155 40
3 2 35 35 - 55 130 175 75 50 185 155 -
4 3 200 220 - 370 395 485 475 295 405 - -
5 4 230 220 - 370 290 585 - 255 405 - -
6 5 235 220 - 375 320 640 - - 395 - -
7 6 230 220 - 225 320 455 - - - - -
8 7 225 220 - - 305 275 - - - - -
9 8 - 140 - - 260 275 - - - - -
Ridge path analysis(4)
1 0 20 20 65 25 35 15 30 20 45 30 20
2 1 35 35 - 50 85 30 70 30 130 150 35
3 2 35 35 - 55 130 175 75 50 185 145 -
4 3 200 220 - 370 395 485 475 295 405 - -
5 4 230 220 - 370 290 585 - 255 405 - -
6 5 235 220 - 375 320 640 - - 395 - -
7 6 230 220 - 225 320 455 - - - - -
8 7 225 220 - - 305 275 - - - - -
9 8 - 140 - - 260 275 - - - - -
Triple-cross corn hybrid DKB566 evaluated in the 2009/2010 harvest
Traditional path analysis(3)
1 0 15 15 15 15 15 15 15 15 15 15 15
2 1 50 50 - 40 130 35 310 40 160 185 35
3 2 50 50 - 40 130 160 310 45 160 185 -
4 3 285 295 - 215 455 370 825 305 275 - -
5 4 295 320 - 215 285 385 - 295 225 - -
6 5 295 320 - 215 250 370 - - 225 - -
7 6 305 305 - 210 230 295 - - - - -
8 7 300 305 - - 250 200 - - - - -
9 8 - 135 - - 220 200 - - - - -
Ridge path analysis(4)
1 0 20 20 60 20 30 15 40 20 35 30 20
2 1 40 40 - 35 75 25 205 35 115 145 30
3 2 50 50 - 35 130 160 310 45 160 185 -
4 3 285 295 - 215 455 370 825 305 275 - -
5 4 295 320 - 215 285 385 - 295 225 - -
6 5 295 320 - 215 250 370 - - 225 - -
7 6 305 305 - 210 230 295 - - - - -
8 7 300 305 - - 250 200 - - - - -
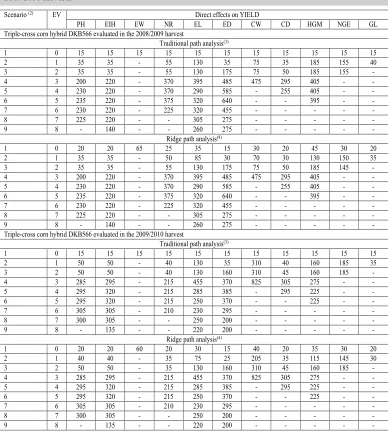
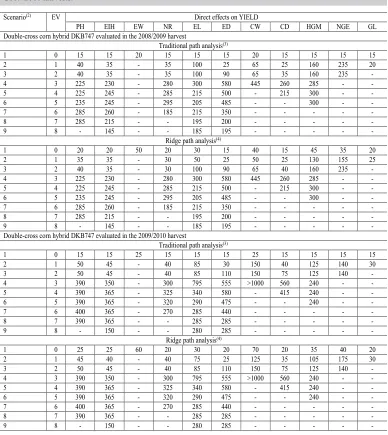
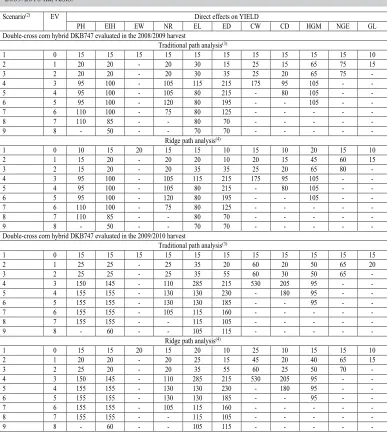
Table 3. Sample size (number of plants) for estimating the direct effects of explanatory variables(1) on grain yield
(YIELD) with a 95% confidence interval range equal to 0.15 for each path analysis scenario with the respective number of excluded variables (EV) in the double-cross corn hybrid DKB747 evaluated in the 2008/2009 and 2009/2010 harvests.
(1)PH: plant height at harvest; EIH: ear insertion height; EW: ear weight; NR: number of grain rows per ear; EL:
ear length; ED: ear diameter; CW: cob weight; CD: cob diameter; HGM: 100-grain mass; NGE: number of grains per ear; GL: grain length. (2)Scenarios defined in Material and Methods. (3)No change in the X’X correlation matrix
between explanatory variables, regardless of the condition number (CN). (4)Path analysis performed after adding
a k value to the diagonal of the X’X correlation matrix, and choosing the smallest k value sufficient to reduce the CN to <100. When the initial CN was <100, k = 0.0000 was added and the ridge path analysis produced the same values found in the traditional path analysis.
Scenario(2) EV Direct effects on YIELD
PH EIH EW NR EL ED CW CD HGM NGE GL
Double-cross corn hybrid DKB747 evaluated in the 2008/2009 harvest
Traditional path analysis(3)
1 0 15 15 20 15 15 15 20 15 15 15 15
2 1 40 35 - 35 100 25 65 25 160 235 20
3 2 40 35 - 35 100 90 65 35 160 235 -
4 3 225 230 - 280 300 580 445 260 285 - -
5 4 225 245 - 285 215 500 - 215 300 - -
6 5 235 245 - 295 205 485 - - 300 - -
7 6 285 260 - 185 215 350 - - - - -
8 7 285 215 - - 195 200 - - - - -
9 8 - 145 - - 185 195 - - - - -
Ridge path analysis(4)
1 0 20 20 50 20 30 15 40 15 45 35 20
2 1 35 35 - 30 50 25 50 25 130 155 25
3 2 40 35 - 30 100 90 65 40 160 235 -
4 3 225 230 - 280 300 580 445 260 285 - -
5 4 225 245 - 285 215 500 - 215 300 - -
6 5 235 245 - 295 205 485 - - 300 - -
7 6 285 260 - 185 215 350 - - - - -
8 7 285 215 - - 195 200 - - - - -
9 8 - 145 - - 185 195 - - - - -
Double-cross corn hybrid DKB747 evaluated in the 2009/2010 harvest
Traditional path analysis(3)
1 0 15 15 25 15 15 15 25 15 15 15 15
2 1 50 45 - 40 85 30 150 40 125 140 30
3 2 50 45 - 40 85 110 150 75 125 140 -
4 3 390 350 - 300 795 555 >1000 560 240 - -
5 4 390 365 - 325 340 580 - 415 240 - -
6 5 390 365 - 320 290 475 - - 240 - -
7 6 400 365 - 270 285 440 - - - - -
8 7 390 365 - - 285 285 - - - - -
9 8 - 150 - - 280 285 - - - - -
Ridge path analysis(4)
1 0 25 25 60 20 30 20 70 20 35 40 20
2 1 45 40 - 40 75 25 125 35 105 175 30
3 2 50 45 - 40 85 110 150 75 125 140 -
4 3 390 350 - 300 795 555 >1000 560 240 - -
5 4 390 365 - 325 340 580 - 415 240 - -
6 5 390 365 - 320 290 475 - - 240 - -
7 6 400 365 - 270 285 440 - - - - -
8 7 390 365 - - 285 285 - - - - -
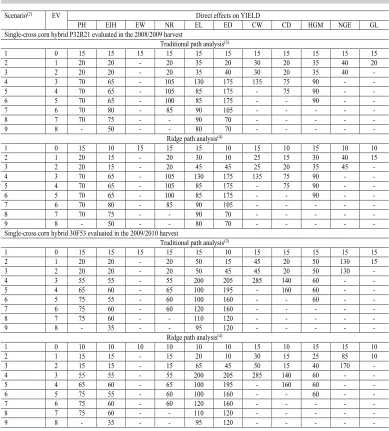
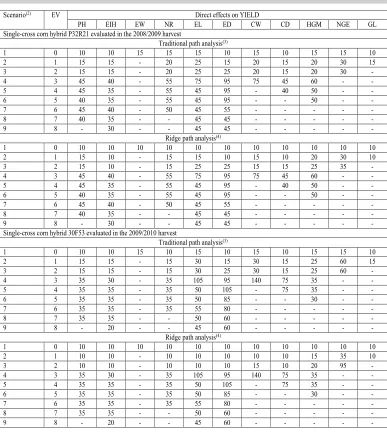
Table 4. Sample size (number of plants) for estimating the direct effects of explanatory variables(1) on grain
yield (YIELD) with a 95% confidence interval range equal to 0.25 for each path analysis scenario with the respective number of excluded variables (EV) in the single-cross corn hybrids P32R21 and 30F53 evaluated in the 2008/2009 and 2009/2010 harvests, respectively.
(1)PH: plant height at harvest; EIH: ear insertion height; EW: ear weight; NR: number of grain rows per ear; EL:
ear length; ED: ear diameter; CW: cob weight; CD: cob diameter; HGM: 100-grain mass; NGE: number of grains per ear; GL: grain length. (2)Scenarios defined in Material and Methods. (3)No change in the X’X correlation matrix
between explanatory variables, regardless of the condition number (CN). (4)Path analysis performed after adding
a k value to the diagonal of the X’X correlation matrix, and choosing the smallest k value sufficient to reduce the
Scenario(2) EV Direct effects on YIELD
PH EIH EW NR EL ED CW CD HGM NGE GL
Single-cross corn hybrid P32R21 evaluated in the 2008/2009 harvest
Traditional path analysis(3)
1 0 15 15 15 15 15 15 15 15 15 15 15
2 1 20 20 - 20 35 20 30 20 35 40 20
3 2 20 20 - 20 35 40 30 20 35 40 -
4 3 70 65 - 105 130 175 135 75 90 - -
5 4 70 65 - 105 85 175 - 75 90 - -
6 5 70 65 - 100 85 175 - - 90 - -
7 6 70 80 - 85 90 105 - - - - -
8 7 70 75 - - 90 70 - - - - -
9 8 - 50 - - 80 70 - - - - -
Ridge path analysis(4)
1 0 15 10 15 15 15 10 15 10 15 10 10
2 1 20 15 - 20 30 10 25 15 30 40 15
3 2 20 15 - 20 45 45 25 20 35 45 -
4 3 70 65 - 105 130 175 135 75 90 - -
5 4 70 65 - 105 85 175 - 75 90 - -
6 5 70 65 - 100 85 175 - - 90 - -
7 6 70 80 - 85 90 105 - - - - -
8 7 70 75 - - 90 70 - - - - -
9 8 - 50 - - 80 70 - - - - -
Single-cross corn hybrid 30F53 evaluated in the 2009/2010 harvest
Traditional path analysis(3)
1 0 15 15 15 15 15 10 15 15 15 15 15
2 1 20 20 - 20 50 15 45 20 50 130 15
3 2 20 20 - 20 50 45 45 20 50 130 -
4 3 55 55 - 55 200 205 285 140 60 - -
5 4 65 60 - 65 100 195 - 160 60 - -
6 5 75 55 - 60 100 160 - - 60 - -
7 6 75 60 - 60 120 160 - - - - -
8 7 75 60 - - 110 120 - - - - -
9 8 - 35 - - 95 120 - - - - -
Ridge path analysis(4)
1 0 10 10 10 10 10 10 15 10 15 15 10
2 1 15 15 - 15 20 10 30 15 25 85 10
3 2 15 15 - 15 65 45 50 15 40 170 -
4 3 55 55 - 55 200 205 285 140 60 - -
5 4 65 60 - 65 100 195 - 160 60 - -
6 5 75 55 - 60 100 160 - - 60 - -
7 6 75 60 - 60 120 160 - - - - -
8 7 75 60 - - 110 120 - - - - -
Table 5. Sample size (number of plants) for estimating the direct effects of explanatory variables(1) on grain
yield (YIELD) with a 95% confidence interval range equal to 0.25 for each path analysis scenario with the respective number of excluded variables (EV) in the triple-cross corn hybrid DKB566 evaluated in the 2008/2009 and 2009/2010 harvests.
(1)PH: plant height at harvest; EIH: ear insertion height; EW: ear weight; NR: number of grain rows per ear; EL:
ear length; ED: ear diameter; CW: cob weight; CD: cob diameter; HGM: 100-grain mass; NGE: number of grains per ear; GL: grain length. (2)Scenarios defined in Material and Methods. (3)No change in the X’X correlation matrix
between explanatory variables, regardless of the condition number (CN). (4)Path analysis performed after adding
a k value to the diagonal of the X’X correlation matrix, and choosing the smallest k value sufficient to reduce the CN to <100. When the initial CN was <100, k = 0.0000 was added and the ridge path analysis produced the same values found in the traditional path analysis.
Scenario(2) EV Direct effects on YIELD
PH EIH EW NR EL ED CW CD HGM NGE GL
Triple-cross corn hybrid DKB566 evaluated in the 2008/2009 harvest
Traditional path analysis(3)
1 0 15 15 15 15 15 10 15 15 15 15 15
2 1 20 20 - 25 45 20 35 20 75 65 20
3 2 20 20 - 25 45 65 35 25 75 65 -
4 3 90 90 - 130 135 205 180 125 145 - -
5 4 90 95 - 145 115 245 - 110 155 - -
6 5 90 95 - 130 125 250 - - 155 - -
7 6 90 90 - 90 130 185 - - - - -
8 7 90 90 - - 110 115 - - - - -
9 8 - 55 - - 100 100 - - - - -
Ridge path analysis(4)
1 0 15 10 20 15 15 10 15 10 15 15 10
2 1 20 20 - 20 30 15 25 15 50 70 15
3 2 20 20 - 25 45 60 35 20 75 75 -
4 3 90 90 - 130 135 205 180 125 145 - -
5 4 90 95 - 145 115 245 - 110 155 - -
6 5 90 95 - 130 125 250 - - 155 - -
7 6 90 90 - 90 130 185 - - - - -
8 7 90 90 - - 110 115 - - - - -
9 8 - 55 - - 100 100 - - - - -
Triple-cross corn hybrid DKB566 evaluated in the 2009/2010 harvest
Traditional path analysis(3)
1 0 15 15 15 15 15 15 15 15 15 15 15
2 1 25 25 - 20 40 20 95 20 55 70 20
3 2 25 25 - 20 40 55 95 20 55 70 -
4 3 105 110 - 80 165 155 300 120 95 - -
5 4 120 110 - 80 110 145 - 120 90 - -
6 5 120 125 - 80 95 145 - - 90 - -
7 6 115 105 - 80 100 115 - - - - -
8 7 120 105 - - 95 80 - - - - -
9 8 - 50 - - 90 80 - - - - -
Ridge path analysis(4)
1 0 10 10 20 15 15 10 15 10 15 15 10
2 1 20 20 - 20 30 15 35 20 40 55 15
3 2 20 20 - 20 40 55 95 20 55 70 -
4 3 105 110 - 80 165 155 300 120 95 - -
5 4 120 110 - 80 110 145 - 120 90 - -
6 5 120 125 - 80 95 145 - - 90 - -
7 6 115 105 - 80 100 115 - - - - -
8 7 120 105 - - 95 80 - - - - -
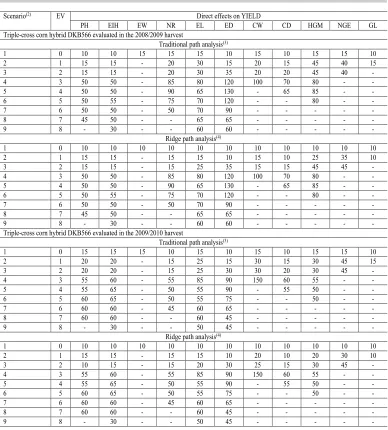
Table 6. Sample size (number of plants) for estimating the direct effects of explanatory variables(1) on grain yield
(YIELD) with a 95% confidence interval range equal to 0.25 for each path analysis scenario with the respective number of excluded variables (EV) in the double-cross corn hybrid DKB747 evaluated in the 2008/2009 and 2009/2010 harvests.
(1)PH: plant height at harvest; EIH: ear insertion height; EW: ear weight; NR: number of grain rows per ear; EL:
ear length; ED: ear diameter; CW: cob weight; CD: cob diameter; HGM: 100-grain mass; NGE: number of grains per ear; GL: grain length. (2)Scenarios defined in Material and Methods. (3)No change in the X’X correlation matrix
between explanatory variables, regardless of the condition number (CN). (4)Path analysis performed after adding
a k value to the diagonal of the X’X correlation matrix, and choosing the smallest k value sufficient to reduce the
Scenario(2) EV Direct effects on YIELD
PH EIH EW NR EL ED CW CD HGM NGE GL
Double-cross corn hybrid DKB747 evaluated in the 2008/2009 harvest
Traditional path analysis(3)
1 0 15 15 15 15 15 15 15 15 15 15 10
2 1 20 20 - 20 30 15 25 15 65 75 15
3 2 20 20 - 20 30 35 25 20 65 75 -
4 3 95 100 - 105 115 215 175 95 105 - -
5 4 95 100 - 105 80 215 - 80 105 - -
6 5 95 100 - 120 80 195 - - 105 - -
7 6 110 100 - 75 80 125 - - - - -
8 7 110 85 - - 80 70 - - - - -
9 8 - 50 - - 70 70 - - - - -
Ridge path analysis(4)
1 0 10 15 20 15 15 10 15 10 20 15 10
2 1 15 20 - 20 20 10 20 15 45 60 15
3 2 15 20 - 20 35 35 25 20 65 80 -
4 3 95 100 - 105 115 215 175 95 105 - -
5 4 95 100 - 105 80 215 - 80 105 - -
6 5 95 100 - 120 80 195 - - 105 - -
7 6 110 100 - 75 80 125 - - - - -
8 7 110 85 - - 80 70 - - - - -
9 8 - 50 - - 70 70 - - - - -
Double-cross corn hybrid DKB747 evaluated in the 2009/2010 harvest
Traditional path analysis(3)
1 0 15 15 15 15 15 15 15 15 15 15 15
2 1 25 25 - 25 35 20 60 20 50 65 20
3 2 25 25 - 25 35 55 60 30 50 65 -
4 3 150 145 - 110 285 215 530 205 95 - -
5 4 155 155 - 130 130 230 - 180 95 - -
6 5 155 155 - 130 130 185 - - 95 - -
7 6 155 155 - 105 115 160 - - - - -
8 7 155 155 - - 115 105 - - - - -
9 8 - 60 - - 105 115 - - - - -
Ridge path analysis(4)
1 0 15 15 20 15 20 10 25 10 15 15 10
2 1 20 20 - 20 25 15 45 20 40 65 15
3 2 25 20 - 20 35 55 60 25 50 70 -
4 3 150 145 - 110 285 215 530 205 95 - -
5 4 155 155 - 130 130 230 - 180 95 - -
6 5 155 155 - 130 130 185 - - 95 - -
7 6 155 155 - 105 115 160 - - - - -
8 7 155 155 - - 115 105 - - - - -
Table 7. Sample size (number of plants) for estimating the direct effects of explanatory variables(1) on grain
yield (YIELD) with a 95% confidence interval range equal to 0.35 for each path analysis scenario with the respective number of excluded variables (EV) in the single-cross corn hybrids P32R21 and 30F53 evaluated in the 2008/2009 and 2009/2010 harvests, respectively.
(1)PH: plant height at harvest; EIH: ear insertion height; EW: ear weight; NR: number of grain rows per ear; EL:
ear length; ED: ear diameter; CW: cob weight; CD: cob diameter; HGM: 100-grain mass; NGE: number of grains per ear; GL: grain length. (2)Scenarios defined in Material and Methods. (3)No change in the X’X correlation matrix
between explanatory variables, regardless of the condition number (CN). (4)Path analysis performed after adding
a k value to the diagonal of the X’X correlation matrix, and choosing the smallest k value sufficient to reduce the CN to <100. When the initial CN was <100, k = 0.0000 was added and the ridge path analysis produced the same values found in the traditional path analysis.
Scenario(2) EV Direct effects on YIELD
PH EIH EW NR EL ED CW CD HGM NGE GL
Single-cross corn hybrid P32R21 evaluated in the 2008/2009 harvest
Traditional path analysis(3)
1 0 10 10 15 15 15 10 15 10 15 15 10
2 1 15 15 - 20 25 15 20 15 20 30 15
3 2 15 15 - 20 25 25 20 15 20 30 -
4 3 45 40 - 55 75 95 75 45 60 - -
5 4 45 35 - 55 45 95 - 40 50 - -
6 5 40 35 - 55 45 95 - - 50 - -
7 6 45 40 - 50 45 55 - - - - -
8 7 40 35 - - 45 45 - - - - -
9 8 - 30 - - 45 45 - - - - -
Ridge path analysis(4)
1 0 10 10 10 10 10 10 10 10 10 10 10
2 1 15 10 - 15 15 10 15 10 20 30 10
3 2 15 10 - 15 25 25 15 15 25 35 -
4 3 45 40 - 55 75 95 75 45 60 - -
5 4 45 35 - 55 45 95 - 40 50 - -
6 5 40 35 - 55 45 95 - - 50 - -
7 6 45 40 - 50 45 55 - - - - -
8 7 40 35 - - 45 45 - - - - -
9 8 - 30 - - 45 45 - - - - -
Single-cross corn hybrid 30F53 evaluated in the 2009/2010 harvest
Traditional path analysis(3)
1 0 10 10 15 10 15 10 15 10 15 15 10
2 1 15 15 - 15 30 15 30 15 25 60 15
3 2 15 15 - 15 30 25 30 15 25 60 -
4 3 35 30 - 35 105 95 140 75 35 - -
5 4 35 35 - 35 50 105 - 75 35 - -
6 5 35 35 - 35 50 85 - - 30 - -
7 6 35 35 - 35 55 80 - - - - -
8 7 35 35 - - 50 60 - - - - -
9 8 - 20 - - 45 60 - - - - -
Ridge path analysis(4)
1 0 10 10 10 10 10 10 10 10 10 10 10
2 1 10 10 - 10 10 10 10 10 15 35 10
3 2 10 10 - 10 10 10 15 10 20 95 -
4 3 35 30 - 35 105 95 140 75 35 - -
5 4 35 35 - 35 50 105 - 75 35 - -
6 5 35 35 - 35 50 85 - - 30 - -
7 6 35 35 - 35 55 80 - - - - -
8 7 35 35 - - 50 60 - - - - -
Table 8. Sample size (number of plants) for estimating the direct effects of explanatory variables(1) on grain yield
(YIELD) with a 95% confidence interval range equal to 0.35 for each path analysis scenario with the respective number of excluded variables (EV) in the triple-cross corn hybrid DKB566 evaluated in the 2008/2009 and 2009/2010 harvests.
(1)PH: plant height at harvest; EIH: ear insertion height; EW: ear weight; NR: number of grain rows per ear; EL:
ear length; ED: ear diameter; CW: cob weight; CD: cob diameter; HGM: 100-grain mass; NGE: number of grains per ear; GL: grain length. (2)Scenarios defined in Material and Methods. (3)No change in the X’X correlation matrix
between explanatory variables, regardless of the condition number (CN). (4)Path analysis performed after adding
a k value to the diagonal of the X’X correlation matrix, and choosing the smallest k value sufficient to reduce the
Scenario(2) EV Direct effects on YIELD
PH EIH EW NR EL ED CW CD HGM NGE GL
Triple-cross corn hybrid DKB566 evaluated in the 2008/2009 harvest
Traditional path analysis(3)
1 0 10 10 15 15 15 10 15 10 15 15 10
2 1 15 15 - 20 30 15 20 15 45 40 15
3 2 15 15 - 20 30 35 20 20 45 40 -
4 3 50 50 - 85 80 120 100 70 80 - -
5 4 50 50 - 90 65 130 - 65 85 - -
6 5 50 55 - 75 70 120 - - 80 - -
7 6 50 50 - 50 70 90 - - - - -
8 7 45 50 - - 65 65 - - - - -
9 8 - 30 - - 60 60 - - - - -
Ridge path analysis(4)
1 0 10 10 10 10 10 10 10 10 10 10 10
2 1 15 15 - 15 15 10 15 10 25 35 10
3 2 15 15 - 15 25 35 15 15 45 45 -
4 3 50 50 - 85 80 120 100 70 80 - -
5 4 50 50 - 90 65 130 - 65 85 - -
6 5 50 55 - 75 70 120 - - 80 - -
7 6 50 50 - 50 70 90 - - - - -
8 7 45 50 - - 65 65 - - - - -
9 8 - 30 - - 60 60 - - - - -
Triple-cross corn hybrid DKB566 evaluated in the 2009/2010 harvest
Traditional path analysis(3)
1 0 15 15 15 10 15 10 15 10 15 15 10
2 1 20 20 - 15 25 15 30 15 30 45 15
3 2 20 20 - 15 25 30 30 20 30 45 -
4 3 55 60 - 55 85 90 150 60 55 - -
5 4 55 65 - 50 55 90 - 55 50 - -
6 5 60 65 - 50 55 75 - - 50 - -
7 6 60 60 - 45 60 65 - - - - -
8 7 60 60 - - 60 45 - - - - -
9 8 - 30 - - 50 45 - - - - -
Ridge path analysis(4)
1 0 10 10 10 10 10 10 10 10 10 10 10
2 1 15 15 - 15 15 10 20 10 20 30 10
3 2 10 15 - 15 20 30 25 15 30 45 -
4 3 55 60 - 55 85 90 150 60 55 - -
5 4 55 65 - 50 55 90 - 55 50 - -
6 5 60 65 - 50 55 75 - - 50 - -
7 6 60 60 - 45 60 65 - - - - -
8 7 60 60 - - 60 45 - - - - -
Table 9. Sample size (number of plants) for estimating the direct effects of explanatory variables(1) on grain
yield (YIELD) with a 95% confidence interval range equal to 0.35 for each path analysis scenario with the respective number of excluded variables (EV) in the double-cross corn hybrids DKB747 evaluated in the 2008/2009 and 2009/2010 harvests.
(1)PH: plant height at harvest; EIH: ear insertion height; EW: ear weight; NR: number of grain rows per ear; EL:
ear length; ED: ear diameter; CW: cob weight; CD: cob diameter; HGM: 100-grain mass; NGE: number of grains per ear; GL: grain length. (2)Scenarios defined in Material and Methods. (3)No change in the X’X correlation matrix
between explanatory variables, regardless of the condition number (CN).(4) Path analysis performed after adding
a k value to the diagonal of the X’X correlation matrix, and choosing the smallest k value sufficient to reduce the CN to <100. When the initial CN was <100, k = 0.0000 was added and the ridge path analysis produced the same values found in the traditional path analysis.
Scenario(2) EV Direct effects on YIELD
PH EIH EW NR EL ED CW CD HGM NGE GL
Double-cross corn hybrid DKB747 evaluated in the 2008/2009 harvest
Traditional path analysis(3)
1 0 15 15 15 15 15 10 15 10 15 15 10
2 1 15 15 - 15 20 15 20 15 35 40 15
3 2 15 15 - 15 20 20 20 15 35 40 -
4 3 55 55 - 60 60 105 100 60 60 - -
5 4 55 55 - 65 50 105 - 50 60 - -
6 5 55 55 - 70 45 105 - - 60 - -
7 6 55 55 - 45 45 65 - - - - -
8 7 55 50 - - 40 40 - - - - -
9 8 - 25 - - 40 40 - - - - -
Ridge path analysis(4)
1 0 10 10 10 10 10 10 10 10 10 10 10
2 1 10 10 - 15 10 10 15 10 25 30 10
3 2 10 10 - 15 10 15 15 10 40 50 -
4 3 55 55 - 60 60 105 100 60 60 - -
5 4 55 55 - 65 50 105 - 50 60 - -
6 5 55 55 - 70 45 105 - - 60 - -
7 6 55 55 - 45 45 65 - - - - -
8 7 55 50 - - 40 40 - - - - -
9 8 - 25 - - 40 40 - - - - -
Double-cross corn hybrid DKB747 evaluated in the 2009/2010 harvest
Traditional path analysis(3)
1 0 15 15 15 15 15 10 15 15 15 15 10
2 1 20 20 - 15 25 15 35 15 30 35 15
3 2 20 20 - 15 25 30 35 20 30 35 -
4 3 80 80 - 65 140 110 265 105 60 - -
5 4 80 80 - 65 75 120 - 90 50 - -
6 5 80 80 - 65 65 100 - - 55 - -
7 6 80 75 - 55 65 90 - - - - -
8 7 85 75 - - 65 65 - - - - -
9 8 - 35 - - 65 65 - - - - -
Ridge path analysis(4)
1 0 10 10 10 10 10 10 10 10 10 10 10
2 1 15 15 - 15 20 10 20 10 25 40 10
3 2 15 15 - 15 20 25 30 15 30 45 -
4 3 80 80 - 65 140 110 265 105 60 - -
5 4 80 80 - 65 75 120 - 90 50 - -
6 5 80 80 - 65 65 100 - - 55 - -
7 6 80 75 - 55 65 90 - - - - -
8 7 85 75 - - 65 65 - - - - -
Table 10. Sample size (number of plants) for estimating the direct effects of explanatory variables(1) on grain
yield (YIELD) with a 95% confidence interval range equal to 0.45 for each path analysis scenario with the respective number of excluded variables (EV) in the single-cross corn hybrids P32R21 and 30F53 evaluated in the 2008/2009 and 2009/2010 harvests, respectively.
(1)PH: plant height at harvest; EIH: ear insertion height; EW: ear weight; NR: number of grain rows per ear; EL:
ear length; ED: ear diameter; CW: cob weight; CD: cob diameter; HGM: 100-grain mass; NGE: number of grains per ear; GL: grain length. (2)Scenarios defined in Material and Methods. (3)No change in the X’X correlation matrix
between explanatory variables, regardless of the condition number (CN). (4)Path analysis performed after adding
a k value to the diagonal of the X’X correlation matrix, and choosing the smallest k value sufficient to reduce the
Scenario(2) EV Direct effects on YIELD
PH EIH EW NR EL ED CW CD HGM NGE GL
Single-cross corn hybrid P32R21 evaluated in the 2008/2009 harvest
Traditional path analysis(3)
1 0 10 10 15 10 15 10 10 10 10 15 10
2 1 15 15 - 15 20 15 15 15 15 20 15
3 2 15 15 - 15 20 20 15 15 15 20 -
4 3 30 30 - 45 45 65 50 35 35 - -
5 4 30 30 - 45 30 65 - 30 35 - -
6 5 30 25 - 40 30 65 - - 35 - -
7 6 30 25 - 30 30 40 - - - - -
8 7 30 25 - - 30 30 - - - - -
9 8 - 20 - - 30 25 - - - - -
Ridge path analysis(4)
1 0 10 10 10 10 10 10 10 10 10 10 10
2 1 10 10 - 10 10 10 10 10 10 15 10
3 2 10 10 - 10 10 10 10 10 10 30 -
4 3 30 30 - 45 45 65 50 35 35 - -
5 4 30 30 - 45 30 65 - 30 35 - -
6 5 30 25 - 40 30 65 - - 35 - -
7 6 30 25 - 30 30 40 - - - - -
8 7 30 25 - - 30 30 - - - - -
9 8 - 20 - - 30 25 - - - - -
Single-cross corn hybrid 30F53 evaluated in the 2009/2010 harvest
Traditional path analysis(3)
1 0 10 10 15 10 15 10 15 10 10 15 10
2 1 15 15 - 15 20 15 20 15 20 30 15
3 2 15 15 - 15 20 20 20 15 20 30 -
4 3 25 25 - 25 70 60 80 30 25 - -
5 4 25 25 - 25 35 60 - 30 20 - -
6 5 25 25 - 25 30 50 - - 20 - -
7 6 25 20 - 25 35 50 - - - - -
8 7 25 20 - - 30 35 - - - - -
9 8 - 15 - - 25 35 - - - - -
Ridge path analysis(4)
1 0 10 10 10 10 10 10 10 10 10 10 10
2 1 10 10 - 10 10 10 10 10 10 15 10
3 2 10 10 - 10 10 10 10 10 10 60 -
4 3 20 20 - 20 70 60 80 25 20 - -
5 4 25 25 - 25 35 60 - 30 20 - -
6 5 25 25 - 25 30 50 - - 20 - -
7 6 25 20 - 25 35 50 - - - - -
8 7 25 20 - - 30 35 - - - - -
Table 11. Sample size (number of plants) for estimating the direct effects of explanatory variables(1) on grain yield
(YIELD) with a 95% confidence interval range equal to 0.45 for each path analysis scenario with the respective number of excluded variables (EV) in the triple-cross corn hybrid DKB566 evaluated in the 2008/2009 and 2009/2010 harvests.
(1)PH: plant height at harvest; EIH: ear insertion height; EW: ear weight; NR: number of grain rows per ear; EL:
ear length; ED: ear diameter; CW: cob weight; CD: cob diameter; HGM: 100-grain mass; NGE: number of grains per ear; GL: grain length. (2)Scenarios defined in Material and Methods. (3)No change in the X’X correlation matrix
between explanatory variables, regardless of the condition number (CN). (4)Path analysis performed after adding
a k value to the diagonal of the X’X correlation matrix, and choosing the smallest k value sufficient to reduce the CN to <100. When the initial CN was <100, k = 0.0000 was added and the ridge path analysis produced the same values found in the traditional path analysis.
Scenario (2) EV Direct effects on YIELD
PH EIH EW NR EL ED CW CD HGM NGE GL
Triple-cross corn hybrid DKB566 evaluated in the 2008/2009 harvest
Traditional path analysis(3)
1 0 10 10 15 10 15 10 15 10 15 15 10
2 1 15 15 - 15 20 15 20 15 25 30 15
3 2 15 15 - 15 20 25 20 15 25 30 -
4 3 40 40 - 55 50 80 65 50 60 - -
5 4 40 40 - 55 45 80 - 40 60 - -
6 5 40 35 - 50 45 90 - - 55 - -
7 6 35 35 - 35 45 65 - - - - -
8 7 35 35 - - 35 35 - - - - -
9 8 - 20 - - 35 35 - - - - -
Ridge path analysis(4)
1 0 10 10 10 10 10 10 10 10 10 10 10
2 1 10 10 - 10 10 10 10 10 15 25 10
3 2 10 10 - 10 10 10 10 10 30 35 -
4 3 40 40 - 55 50 80 65 50 60 - -
5 4 40 40 - 55 45 80 - 40 60 - -
6 5 40 35 - 50 45 90 - - 55 - -
7 6 35 35 - 35 45 65 - - - - -
8 7 35 35 - - 35 35 - - - - -
9 8 - 20 - - 35 35 - - - - -
Triple-cross corn hybrid DKB566 evaluated in the 2009/2010 harvest
Traditional path analysis(3)
1 0 10 10 15 10 15 10 15 10 10 15 10
2 1 15 15 - 15 20 15 20 15 20 30 15
3 2 15 15 - 15 20 25 20 15 20 30 -
4 3 35 40 - 35 55 60 90 40 35 - -
5 4 45 40 - 35 40 55 - 40 35 - -
6 5 45 45 - 35 35 50 - - 35 - -
7 6 45 45 - 35 35 40 - - - - -
8 7 40 40 - - 35 30 - - - - -
9 8 - 20 - - 30 30 - - - - -
Ridge path analysis(4)
1 0 10 10 10 10 10 10 10 10 10 10 10
2 1 10 10 - 10 10 10 10 10 15 20 10
3 2 10 10 - 10 10 10 10 10 20 30 -
4 3 35 40 - 35 55 60 90 40 35 - -
5 4 45 40 - 35 40 55 - 40 35 - -
6 5 45 45 - 35 35 50 - - 35 - -
7 6 45 45 - 35 35 40 - - - - -
8 7 40 40 - - 35 30 - - - - -
Table 12. Sample size (number of plants) for estimating the direct effects of explanatory variables(1) on grain
yield (YIELD) with a 95% confidence interval range equal to 0.45 for each path analysis scenario with the respective number of excluded variables (EV) in the double-cross corn hybrid DKB747 evaluated in the 2008/2009 and 2009/2010 harvests.
(1)PH: plant height at harvest; EIH: ear insertion height; EW: ear weight; NR: number of grain rows per ear; EL:
ear length; ED: ear diameter; CW: cob weight; CD: cob diameter; HGM: 100-grain mass; NGE: number of grains per ear; GL: grain length. (2)Scenarios defined in Material and Methods. (3)No change in the X’X correlation matrix
between explanatory variables, regardless of the condition number (CN). (4)Path analysis performed after adding
a k value to the diagonal of the X’X correlation matrix, and choosing the smallest k value sufficient to reduce the
Scenario(2) EV Direct effects on YIELD
PH EIH EW NR EL ED CW CD HGM NGE GL
Double-cross corn hybrid DKB747 evaluated in the 2008/2009 harvest
Traditional path analysis(3)
1 0 10 10 15 10 15 10 15 10 15 15 10
2 1 15 15 - 15 15 15 15 15 20 25 15
3 2 15 15 - 15 15 20 15 15 20 25 -
4 3 35 35 - 45 45 65 60 40 40 - -
5 4 35 40 - 45 30 70 - 35 45 - -
6 5 35 40 - 45 30 60 - - 45 - -
7 6 35 40 - 30 30 40 - - - - -
8 7 35 30 - - 25 25 - - - - -
9 8 - 20 - - 25 25 - - - - -
Ridge path analysis(4)
1 0 10 10 10 10 10 10 10 10 10 10 10
2 1 10 10 - 10 10 10 10 10 15 20 10
3 2 10 10 - 10 10 10 10 10 25 35 -
4 3 35 35 - 45 45 65 60 40 40 - -
5 4 35 40 - 45 30 70 - 35 45 - -
6 5 35 40 - 45 30 60 - - 45 - -
7 6 35 40 - 30 30 40 - - - - -
8 7 35 30 - - 25 25 - - - - -
9 8 - 20 - - 25 25 - - - - -
Double-cross corn hybrid DKB747 evaluated in the 2009/2010 harvest
Traditional path analysis(3)
1 0 10 10 15 10 15 10 15 10 15 15 10
2 1 15 15 - 15 20 15 25 15 20 25 15
3 2 15 15 - 15 20 25 25 20 20 25 -
4 3 55 50 - 45 100 75 160 70 40 - -
5 4 50 50 - 45 45 75 - 65 40 - -
6 5 55 50 - 45 40 65 - - 40 - -
7 6 55 50 - 35 40 60 - - - - -
8 7 50 45 - - 40 35 - - - - -
9 8 - 20 - - 40 35 - - - - -
Ridge path analysis(4)
1 0 10 10 10 10 10 10 10 10 10 10 10
2 1 10 10 - 10 10 10 15 10 15 20 10
3 2 10 10 - 10 10 10 15 10 20 30 -
4 3 55 50 - 45 100 75 160 70 40 - -
5 4 50 50 - 45 45 75 - 65 40 - -
6 5 55 50 - 45 40 65 - - 40 - -
7 6 55 50 - 35 40 60 - - - - -
8 7 50 45 - - 40 35 - - - - -
The sample size (number of plants) required to estimate the direct effects of eleven
explanatory variables on YIELD in the traditional path analysis of the first scenario with a
CIR95% equal to 0.15 was reduced (15 plants ≤ n ≤ 25 plants) regardless of hybrid or harvest (Tables 1 to 3). However, it is highlighted that serious multicollinearity issues existed in that scenario (data not shown), and the ridge path analysis and/or exclusion of variables (scenarios 2 to 9) are recommended. The sample size for estimation of direct effects of the ridge path analysis for the same scenario and accuracy level ranged from 15 to 70 plants, depending on the hybrid, harvest, and explanatory variable. Furthermore, a greater sample size was usually necessary for estimating the direct effect of EW on YIELD, and the other variables, including
CW, HGM, and NGE, also indicated a need for greater sample sizes in the first scenario. Compared to the first scenario, an increase in the sample size required for estimating
the direct effects of the traditional (20 plants ≤ n ≤ 380 plants) and ridge (25 plants ≤ n ≤
295 plants) path analyses with a maximum 95%CI limit of 0.15 occurred in all hybrids and harvests after excluding EW from the second scenario (Tables 1 to 3). In this second scenario, an increase in sample size variability among explanatory variables, hybrids, and harvests occurred, especially in the single- and triple-cross hybrids from the 2009/2010 harvest, which displayed greater variations in the sample size required for estimating the direct effects of the ten explanatory variables used. Considering the same accuracy level, the sample size required for estimating the direct effects in the third scenario ranged from 30 to 380 plants in the traditional and ridge path analyses, depending on the hybrid, harvest, and explanatory variable.
Exclusion of the NGE variable from the fourth scenario resulted in a loss of predictive ability in both the traditional and ridge path analyses and in all hybrids and harvests because NGE had a strong, positive, direct effect on YIELD (data not shown). In general, this scenario required the greatest sample size for estimating the direct effects in corn path analyses in comparison to the other eight scenarios (Tables 1 to 3). From this scenario onwards, the sample sizes required for estimating the direct effects with a 95%CI of 0.15 were equal in the traditional and ridge path analyses. The measurement of 165 to 420 single-cross hybrid plants from the 2008/2009 harvest and 150 to 900 single-cross hybrid plants from the 2009/2010 harvest was required for estimating the direct effects of PH, EIH, NR, EL, ED, CW, CD, and HGM on YIELD (scenario 4) with a maximum 95%CI limit of 0.15, depending on the explanatory variable (Table 1). Conversely, the measurement of 200 to 485 plants in the 2008/2009 harvest and of 215 to 825 plants in the 2009/2010 harvest (Table 2) and the measurement of 225 to 580 plants in the 2008/2009 harvest and of 240 to >1000 plants in the 2009/2010 harvest (Table 3) were required for the triple- and double-cross hybrids, respectively, depending on the explanatory variable. The existence of high variability among the explanatory variables regarding the sample size required for estimating the direct effects on YIELD was observed in this scenario for a given hybrid level, harvest, and accuracy level (Figure 1A and B).
The exclusion of variables from the fourth scenario onwards failed to significantly reduce the coefficients of determination of the traditional and ridge path analyses (data not
of the type of path analysis (traditional or ridge) or explanatory variable (Table 1). At this same accuracy level, measurements of 565, 455, 415, 330, and 305 plants were required for estimating the direct effects of the explanatory variables on YIELD in scenarios 5, 6, 7, 8 and 9, respectively, for the single-cross hybrid 30F53 evaluated in the 2009/2010 harvest, regardless of the type of path analysis or explanatory variable.
For the triple-cross hybrid DKB566 from the 2008/2009 harvest, measurements of 585, 640, 455, 305, and 275 plants in scenarios 5, 6, 7, 8, and 9, respectively, were required for estimating the direct effects of explanatory variables on YIELD with a maximum 95%CI limit of 0.15, regardless of the type of path analysis (traditional or ridge) or explanatory variable (Table 2). At this same accuracy level, measurements of 385, 370, 305, 305, and 220 plants were required for estimating the direct effects of the explanatory variables on YIELD in scenarios 5, 6, 7, 8, and 9, respectively, for the triple-cross hybrid DKB566 evaluated in the 2009/2010 harvest, regardless of the type of path analysis or explanatory variable.
For the double-cross hybrid DKB747 from the 2008/2009 harvest, measurements of 500, 485, 350, 285, and 195 plants in scenarios 5, 6, 7, 8, and 9, respectively, were required for estimating the direct effects of explanatory variables on YIELD with a maximum 95%CI limit of 0.15, regardless of the type of path analysis (traditional or ridge) or explanatory variable (Table 3). At this same accuracy level, measurements of 580, 475, 440, 390, and 285 plants were required for estimating the direct effects of the explanatory variables on YIELD in scenarios 5, 6, 7, 8, and 9, respectively, for the double-cross hybrid DKB747 evaluated in the 2009/2010 harvest.
Researchers should use the ridge path analysis when choosing to use one of the first three scenarios, which, in general, generated the greatest path coefficients and the smallest sample sizes, given the significant issues of multicollinearity found primarily in the first two
scenarios (data not shown). Conversely, the fourth scenario displayed the greatest reduction in
the path coefficient due to the exclusion of NGE and, in general, required a greater sample size
for estimating the direct effects than the other eight scenarios (Tables 1 to 3). The exclusion of
variables from the fifth to the ninth scenarios failed to significantly reduce the path coefficients
(data not shown) but enabled a reduction in sample size. Therefore, the use of the ninth scenario of the path analysis was appropriate, regardless of hybrid and harvest, considering smaller required sample size compared to scenarios four to eight. Thus, the extreme scenarios
(scenarios 1, 2, 3, and 9) were conclusively the most recommended. Of these, the first three
scenarios require smaller sample sizes (Tables 1 to 3) and have greater predictive ability than the ninth scenario (data not shown), although in general they require circumventing measures to reduce multicollinearity. Conversely, the ninth scenario displayed the advantages of having a low degree of multicollinearity between explanatory variables and ease of measurement of
the few included explanatory variables (EIH, EL, and ED) in the field, which could contribute
to more rapid indirect selection of the highest yielding plants. Conversely, the intermediate scenarios (scenarios 4 to 8) require the measurement of a greater number of variables and require larger sample sizes than the ninth scenario (Tables 1 to 3) and, therefore, are not recommended.
The sample sizes required for estimating the direct effects of explanatory variables on YIELD with maximum 95%CI limits of 0.25 (Tables 4 to 6), 0.35 (Tables 7 to 9) and 0.45 (Tables 10 to 12) indicated that the performances across hybrids, harvests, scenarios, types of path analysis, and variables were similar to that discussed for the maximum 95%CI limit of 0.15 (Tables 1 to 3). However, a smaller sample size is required for those 95%CI, given the smaller accuracy of the estimate of direct effects at those accuracy levels.
the 2008/2009 and 2009/2010 harvests (Table 4), respectively, sufficed to estimate the
direct effects with a maximum 95%CI limit of 0.25, regardless of the type of path analysis (traditional or ridge) or explanatory variable (EIH, EL, or ED). The measurement of 100 and
90 plants evaluated in the 2008/2009 and 2009/2010 harvests (Table 5), respectively, sufficed
for estimating the direct effects in the triple-cross hybrid for this same scenario and accuracy level. Conversely, in the double-cross hybrid, the measurement of 70 and 115 plants in the 2008/2009 and 2009/2010 harvests (Table 6), respectively, ensured the estimation of the direct effects of EIH, EL, and ED for this same scenario and accuracy level. Thus, the measurement
of 120 plants sufficed for estimating the direct effects of EIH, EL, and ED on YIELD, with a
maximum 95%CI limit of 0.25, regardless of the type of hybrid, the harvests, and the type of path analysis. Therefore, the direct effects of EIH, EL, and ED on YIELD may be estimated
with a maximum 95%CI limit of 0.25 if an experiment is conducted with five treatments and
four replicates (totaling 20 plots) and six plants per plot (totaling 120 plants) are evaluated, as long as the treatment and local control effects are suppressed when estimating the Pearson
correlation coefficients and the direct effects of the path analysis.
The sample size required for estimating the direct effects in the different hybrids, harvests, scenarios, types of path analysis, and explanatory variables ranged from 10 to 265 plants for a 95%CI of 0.35 (Tables 7 to 9). The measurement of 45 and 60 plants of the single-cross hybrids from the 2008/2009 and 2009/2010 harvests (Table 7), respectively, measurement of 60 and 50 plants of the triple-cross hybrid evaluated in the 2008/2009 and 2009/2010 harvests (Table 8), respectively, and the measurement of 40 and 65 plants of the double-cross hybrid evaluated in the 2008/2009 and 2009/2010 harvests (Table 9), respectively, ensured the estimation of the direct effects of the explanatory variables EIH, EL, and ED on YIELD in the ninth scenario with a maximum CIR95% limit of the direct effect of 0.35.
The sample size required ranged from 10 to 160 plants for estimating the direct effects in the different hybrids, harvests, scenarios, types of path analysis, and explanatory variables with maximum 95%CI limits of 0.45 (Tables 10 to 12). The measurement of 30 and 35 plants of the single-cross hybrids from the 2008/2009 and 2009/2010 harvests (Table 10), respectively, measurement of 35 and 30 plants of the triple-cross hybrid evaluated in the 2008/2009 and 2009/2010 harvests (Table 11), respectively, and the measurement of 25 and 40 plants of the double-cross hybrid evaluated in the 2008/2009 and 2009/2010 harvests (Table 12), respectively, ensured the estimation of the direct effects of the explanatory variables EIH, EL, and ED on YIELD in the ninth scenario with a maximum 95%CI limit of the direct effect of 0.45.
DISCUSSION
The sample size required for estimating the direct effects varied between hybrids, harvests, scenarios, types of path analysis, explanatory variables, and accuracy levels. Accordingly, variability among hybrids, harvests, and measured traits or pairs of traits was observed when estimating the mean values of and correlations between corn traits (Storck et al., 2007; Cargnelutti Filho et al., 2010; Toebe et al., 2014, 2015). Therefore, the sample size recommended for estimating the mean values of corn traits ranged from 10 to 674 plants in the analyses performed (Wolkowski et al., 1988; Magari et al., 1996; Costa et al., 2003;
the measurement of 325, 150, 80, 60, 35, and 30 plants, respectively, for the estimation of the
mean and the coefficient of variation in twelve traits of single-, triple-, and double-cross corn
hybrids with maximum 95%CI of 10, 15, 20, 25, 30, and 35%.
The need to measure up to 252 plants, depending on the pair of traits analyzed, was
observed when estimating the Pearson correlation coefficients between corn traits using a
maximum 95%CI limit of 0.30 (Cargnelutti Filho et al., 2010). According to Toebe et al. (2015), the sample size varies among hybrids (single-, triple-, double-crosses), harvests, and
pairs of traits in corn. Those authors verified that larger sample size is required to estimate the correlation coefficient between weakly correlated traits and smaller sample size is needed to estimate the correlation coefficient between highly correlated traits. Also according to Toebe et al. (2015), 375, 195, and 120 plants are sufficient, respectively, to estimate the correlation coefficients of pairs of traits in corn with maximum 95%CI limit of 0.25, 0.35, and 0.45.
According to Streiner (2005), the use of an adequate sample size is important for the
accurate estimation of the path coefficients. According to the author, the use of a small sample size
may result in estimates of direct and indirect effects with high standard error values associated with the estimates. Path analysis requires a greater sample size than other multivariate methods, including multiple regression or factorial analysis, and various factors, including the numbers
of chains, coefficients, variables and possible sources of disturbance, can affect the sample size
required (Streiner, 2005). Petraitis et al. (1996) highlighted that path analysis is often used in conditions of moderate to high degrees of multicollinearity. Furthermore, according to these
authors, most published studies lack a sufficient sample size to support the use of path analysis and for an accurate estimation of path coefficients, a sample size at least 5 to 20 times greater than the number of coefficients to be estimated should be used. According to these same authors,
this ratio ranges from 2 to 90 times in published studies.
The present study revealed that reducing the number of explanatory variables, from the fourth to the ninth scenarios, resulted in reduced sample sizes, in accordance with Petraitis et al. (1996). Furthermore, variability in the sample size required for estimating direct effects was also observed depending on the explanatory variable for which the direct effect is to be estimated. However, the largest sample size found among the explanatory variables of a given scenario should be chosen because the path analysis of each scenario is performed
by partitioning the correlation coefficients into direct and indirect effects, considering all
explanatory variables jointly.
Alvi et al. (2003) measured 10 plants per plot with two replicates to estimate the direct and indirect effects of explanatory variables on corn YIELD. Thus, based on 20 plants, in each hybrid or line, the direct effects of PH, EIH, EL, ED, NR, number of grains per row, and one-thousand-grain weight on YIELD were estimated. Langade et al. (2013) evaluated 10 plants per plot to measure the variables in ten corn lines, grown in a randomized block design with three replicates, and used the means of plots, that is, 30 observations (10 lines x 3 replicates), for estimating the direct and indirect effects in the path analysis. Jayakumar et al. (2007) evaluated
five plants per treatment in three replicates to measure 14 traits used in the path analysis of corn lines and controls. Lopes et al. (2007) evaluated 15 plants per hybrid (five plants/plot x 3
replicates) and performed a general path analysis with n = 90 plants in an experiment conducted with six corn hybrids (15 plants per hybrid x six hybrids). However, the path analyses of each type of hybrid were performed based on only n = 30 plants (15 plants per hybrid x two hybrids).
findings of the present study, which noted based on the literature review that many studies
using path analysis in corn fail to report the sample size used. This complicated the comparison and discussion of the results generated in the present sample size study with those published in other studies. Furthermore, the use of an uneven number of observations when measuring explanatory and main variables was also noted. Moreover, different designs have been used across studies conducting path analysis, with evaluations performed according to the plants, plot means, treatment means, or path analysis based on all data from an experiment or set of
experiments. Therefore, the clear identification of the sample size used and the accuracy of the quantification associated with each estimate of direct effects becomes difficult. Thus, sample
size studies in path analysis should be encouraged in the most diverse possible combinations of scenarios of explanatory variables, types of hybrids, varieties and lines, harvests, sites, management strategies, agricultural crops, and accuracy levels. Furthermore, researchers are recommended to clearly report the sample size used when performing path analysis in each publication, which will enable readers to understand the consistency of the database used and
the reliability of the coefficients shown.
CONCLUSIONS
The use of the ninth scenario of path analysis is recommended regardless of hybrid and harvest given the ease of explanatory variable measurement (ear insertion height, ear
length, and ear diameter) and the smaller sample size required compared to the previous five
scenarios.
To estimate direct effects with the maximum 95%CI of 0.25, 10 to 530 plants are required depending on the type of hybrid, harvest, scenario, type of path analysis, and explanatory variables.
To estimate the direct effects of ear insertion height, ear length, and ear diameter on
grain yield in the ninth scenario with a maximum 95%CI of 0.25, 120 plants suffice regardless
of the type of hybrid, harvest, or type of path analysis.
ACKNOWLEDGMENTS
We thank Conselho Nacional de Desenvolvimento Científico e Tecnológico (CNPq)
and Coordenação de Aperfeiçoamento de Pessoal de Nível Superior (CAPES) for granting scholarships. We also thank the fellows and volunteers for their help in conducting the experiment and collecting data.
REFERENCES
Alvi MB, Rafique M, Tariq MS, Hussain A, et al. (2003). Character association and path coefficient analysis of grain yield and yield components maize (Zea mays L.). Pak. J. Biol. Sci. 6: 136-138. http://dx.doi.org/10.3923/pjbs.2003.136.138
Brera C, De Santis B, Prantera E, Debegnach F, et al. (2010). Effect of sample size in the evaluation of “in-field” sampling plans for aflatoxin B1 determination in corn. J. Agric. Food Chem. 58: 8481-8489 http://dx.doi.org/10.1021/jf1018356. Cargnelutti Filho A, Toebe M, Burin C, Silveira TR, et al. (2010). Sample size for estimating the Pearson correlation
coefficient among corn characters. Pesq. Agr. Bras. 45: 1363-1371 10.1590/S0100-204X2010001200005.