On the Automatic Recognition of Saudi License Plate
Khaled M. Almustafa
College of Engineering
Prince Sultan University
P. O. Box 66833, Riyadh, 11586
Kingdom of Saudi Arabia
ABSTRACT
In this paper three different algorithms for Automatic License Plate Recognition (ALPR) of the Saudi License Plates are described. All algorithms rely on processing information from lines strategically drawn vertically and horizontally through a character. The first algorithm calculates the number of peaks for each line. A peak is a place in the line where the pixels change from black to white. The second algorithm calculates the pixels density for a specific crossing line in a character. Pixel density is defined as the number of pixels having a specific intensity level to the total number of pixels in a line. The third algorithm calculates the position of the peaks introduced in the first algorithm rather than only their numbers. An algorithm was developed for each method to differentiate between all characters of the license plate. Uniformly distributed pseudo-random noise was added to simulate the performance of these algorithms in the presence of noisy images, also performance of the suggested algorithms were tested due to image rotation. A comparison between these algorithms also presented. These algorithms were proven to work even in some cases in which the characters were extremely degraded by noise.
Keywords
ALPR, Line Processing, Pixel Density, Number of Peaks, Position of Peaks, Segmentation.
1.
INTRODUCTION
Automatic license plate recognition (ALPR) has become an increasingly demanding application. Such an application usage can range from law enforcement, automatic traffic violation systems or identifying a vehicle in a video footage, into surveillance using cameras. These applications have large number of videos and still pictures that need to be processed. Processing such a huge data manually for a certain license plate is time consuming and overwhelming, beside all the possible errors that can be encountered in the process. The need for an automatic system that can detect and recognizes license plates is required for these applications, and for the systems running these applications. Recognition of each character of the license plate is the main task of any license plate recognition algorithm. Such task cannot be achieved using the general Optical Character Recognition (OCR) methods, because usually the license plate recognition system does not have the processing power required for the implementation of such algorithm. It also worth mentioning that simpler algorithms are usually implemented for the automatic recognition of a license plate, due to the limitation of the number of characters’ group in a specific license plate, as it will be explained shortly. All three algorithms, used to recognize characters in the Saudi license plates that are presented in this paper, depend on processing information
from specific lines strategically drawn through a character that was extracted from a Saudi license plate. It was assumed that the processed image contains only the character, which is being recognized, in its bounding box and no other character from the license plate exists in the same image. These locations of the mentioned lines are mainly, horizontal (H), taken through the image of the character at the top, middle and bottom, and vertical (V), taken through the image of the character at the right, left and middle. The location of these lines, except for the middle H and V lines, are determined by a factor of the length/width of the image. The first algorithm calculates the number of peaks for each line. A peak is a place in the line where the pixels changes from one intensity level to another, a transition from a white pixel into a black pixel in the image negative. This algorithm is based on an earlier version used to recognize characters in Lebanese plates [1]. The second algorithm calculates the pixels density in a character for a specific crossing line. Pixel density is defined as the percentage of a specific intensity level with respect to the total number of pixels in a given line. The third algorithm calculates the position of the peaks that was introduced in the first algorithm instead of the number of peaks for a specific crossing line. For each algorithm, the features of all characters in different sections of the Saudi license plate were obtained, and finding the best way to differentiate between these characters, based on their sections, was studied. Each algorithm starts by dividing the characters of a specific section of the license plate, such as numbers or letters, into smaller groups based on similarities between their features with respect to the returned values for all the crossing lines for a given algorithm. In most cases, all letters and numbers, in all different sections of the Saudi license plate, were recognized given a specific factor for the crossing line. In few cases, algorithms had some difficulties differentiating between a pair or more of characters for a specific factor of the crossing line. In such cases, extra information was required from another crossing line with different factor to recognize the character. In general, methods that have high processing requirements were able to distinguish between characters while methods that were computationally simple had some difficulty with some pairs.
The reason for introducing all three algorithms, as it will be demonstrated throughout the paper, is that each algorithm has its own limitations in recognizing some of the characters for a given factor, and a combination of factors for a given algorithm or a combination of algorithms for a given factor would enhance the performance of recognizing all the characters in a given group in the license plate.
license plate images. Section 5 presents the algorithm that calculates the number of peaks. Section 6 presents the algorithm that calculates pixel density. Section 7 presents the algorithm that calculates the positions of the peaks. Section 8 compares the presented algorithms, and section 9 concludes the paper with a summary of achievements and suggestions for future work.
2.
LITERATURE REVIEW
ALPR system relies on its functionality on character recognition. Character recognition methods that currently available in the literature can be classified into analytical methods [1-3], and global methods approaches [4-6]. In the analytical approach, in [1], individual characters are segmented from a license plate. Each character is recognized individually and the combination of the recognition results is used to produce a list of possible plates. In [2], a real time and robust method of license plate detection and recognition based on the morphology and template matching was present, and in [3], a new methodology to segment and recognize Malaysian car license plates automatically was proposed to solve the problem of segmenting different length licenses. In the global approaches, in [4], a region-based license plate detection method was proposed by using the mean shift to filter and segment a color vehicle image to get candidate regions, and [5-6] recognize a set of characters as a whole and does not rely on recognizing individual characters. The segmentation phase of the global approach gives an advantage over the analytical approach where the segmentation in the global approach is not necessary.
In [7-13], characters in a license plate are recognized using template matching. This method has two main disadvantages, mainly the matching requires for the system to have templates stored in the memory for the purpose of correlation, and the high sensitivity of the algorithm to noise and scale, where any change in the character’s shape might mislead to produce wrong results.
Neural networks are used for recognition in [14-17]. These methods are usually better for recognition, but they have their own disadvantages, such as the large delays in processing, due to the high complexity of these methods, and also they necessitate a phase of learning before they can be used.
3.
SAUDI LICENSE PLATES
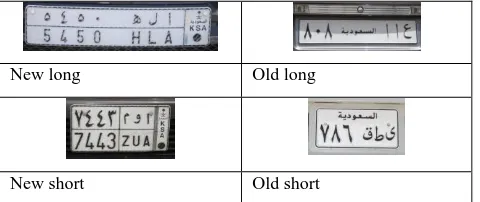
Saudi License plates have unique properties and shape as shown in Figure 1.
New long Old long
New short Old short
Figure 1: Shapes of Saudi License Plates
New license plates contain English and Arabic letters and Arabic and Hindi numerals, and they have two different types,
long and short, and in both types there are up to 4 characters in the number areas and only three characters in the letter areas. The old license plates also have two types, but contain only Arabic letters and Hindi numerals [19].
Also, the Arabic and the English portion of the new Saudi license plate have the following relation
:
Table 1: Equivalence of Arabic and English Characters
٠
0
٩
9
ع
E
١
1
ا
A
ق
G
٢
2
ب
B
ك
K
٣
3
ح
J
ل
L
٤
4
د
D
م
Z
٥
5
ر
R
ن
N
٦
6
س
S
ه
H
٧
7
ص X
و
U
٨
8
ط
T
ى
V
4.
PREPROCESSING STEPS
4.1.
Line Processing
In this paper, the line processing algorithm that was introduced in [1] was simplified, due to the fact that the Saudi license plate has less number of characters compared to the Lebanese license plate. This algorithm identifies the number of pixels on a specific line, which is drawn in a given location as shown in Figure 2. For each line, the transition from one intensity pixels into another (black to white or vice versa) is determined. More details will be given in Section 5.
Factor 1/4 of the total length of the image
The fixed crossing lines at locations 1/3 and 2/3
Figure 2: Crossing Lines of an Image
4.2.
Segmentation
The assumption that was carried out in this paper is that the image of the license plate was already processed by a localization module, which locates the license plate in an image and then pass the required, which is mainly a segmentation of a character drawn from a set of characters, in the given license plate, for it to be recognized by the recognition module.
4.3.
Preprocessing
Figure 3: Sample of a Character in the New Plates
5.
ALGORITHM FOR THE NUMBER
OF PEAKS APPROACH
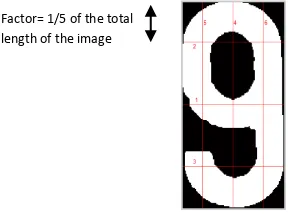
In this algorithm [19], the number of Peaks is calculated for a given factor. A peak is defined as a crossing from one intensity level to another, i.e. a white pixel to a black pixel. A line starting with a white pixel is considered to have one peak at the beginning. The lines labeled 1 and 4 in Figure 4 are always crossing the image at the middle of the image horizontally and vertically, and they referred to as (H) and (V) respectively.
On the other hand, lines 2, 3, 5 and 6 are taken at a distance, which is called a factor, from the boundaries of the bounding box of the character, and they referred to as top (T), bottom (B), left (L) and right (R) respectively. The factor is taken as a portion of the total length or width of the bounding box of the image.
Figure 4 shows a line labeled 3, which is drawn at a factor of 1/5, as an example. This algorithm returns a value of 2 for this line for the given image, since line 3 contains two transitions from black pixels to white pixels. For each possible character of the Saudi license plate, all 6 lines were processes, at a given factors, such as, 1/3, 1/4 and 1/10, and the numbers of peaks for each character at each line were recorded. The results for the English numbers, as an example, are shown in Tables 2.
Table 2 contains the factor F=1/4. Under each column, the number of peaks for the specific line is recorded for every character in that section. Each row contains the number of peaks returned for each character for each specific line. Similar tables were recorded for all possible characters in each section of the plate, using the same factor, so the algorithm would not need to change the position of a specific line depending on which section of a license plate that is being recognized.
Figure 4: Crossing Lines of an Image
Table 2: English Numbers’ Results for F=1/4
1 /4 H T B V L R
0 2 2 2 2 1 1
1 1 2 1 1 1 1
2 1 2 1 3 2 2
3 1 2 2 3 2 1
4 1 1 1 2 1 1
5 1 1 2 3 2 2
6 1 2 2 3 1 2
7 1 1 1 2 2 1
8 1 2 2 3 1 2
9 1 2 2 3 2 1
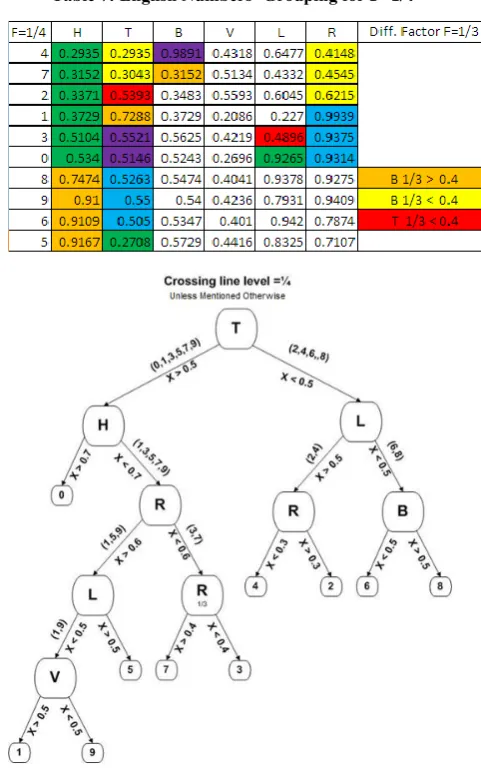
For each set of characters, crossing lines were selected, which divide the characters in the given section into increasingly smaller sized groups with minimum number of elements in each group. For example, for the English numbers, the L line divided the numbers into two different groups, one group has peak equal 1, which is mainly numbers 1, 4, 0, 6 and 8, and another group, which is the rest of the numbers, with number of peaks equal 2, then another line was picked to repeat the process until all or most characters are recognized, as shown in Table 3.
In some cases, characters cannot be distinguished using a specific factor, and then a different factor has to be used as seen in the following cases:
i. Differentiating between 6 and 8, and 3 and 9 is not possible for the English numbers using 1/4 factor, as seen in Table 3.
ii. Differentiating between 6, 1 and 0 is not possible for the Arabic numbers using 1/4 factor, as seen in Figure 5. The algorithm also cannot distinguish between English letters T and L as seen in Figure 6.
Table 3: English Numbers’ Grouping for F= 1/4
F=1/4 H T B V L R
1
1
2
1
1
1
1
4
1
1
1
2
1
1
0
2
2
2
2
1
1
6
1
2
2
3
1
2
8
1
2
2
3
1
2
7
1
1
1
2
2
1
3
1
2
2
3
2
1
9
1
2
2
3
2
1
2
1
2
1
3
2
2
5
1
1
2
3
2
2
Figure 5: Flow Chart to Recognize Arabic New Numbers
There are many ways to combine the results from different factors for the same characters groups. One of them is to start with the factor that divides the group into maximum number of sub-groups using different lines, then at the event we reach the end of the sub-groups without distinguishing all the characters, we can use another factor for these characters as seen in the right side of Figure 5 for the English numbers using factor 1/10, and for the T line to distinguish between numbers 7 and 9.
Figure 6: Flow Chart to Recognize English Letters
5.1.
Results for Number of Peaks Algorithm
Figure 7 shows an example of an ideal image that was extracted from the Saudi license plate. It is a noise free image, and was used to check the recognition ability of the algorithm for the ideal case, then noisy images were considered, and the following results were obtained.Figure 7: Example for a Character Used for Simulation
Figure 8: Image from Plate to Recognition with Artificial Noise
Figure 8 shows the results of the simulation of the algorithm on the mentioned character. In all the simulations, an artificial noise was added to the image of the character to check the performance of the algorithm with noisy images. Figure 9 shows the result of the simulation of the algorithm on another character that was extracted from the image of a noisy plate, and the addition of the artificial noise was minimal.
In both cases, the algorithm successfully recognized both characters, were Figures 8 and 9 show the different stages of the algorithm including the preprocessing steps that were mentioned earlier.
Figure 9: Recognition of a Noisy Plate with Real Noise
5.2.
Error Performance for Number of
Peaks Algorithm
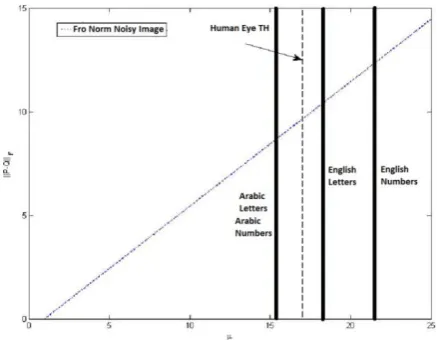
An artificial noise was added to clean images of characters, as seen in the added noise section of Figure 8. The error was simulated using the following equation.
𝑃 = 𝑄 + 𝜇𝑛
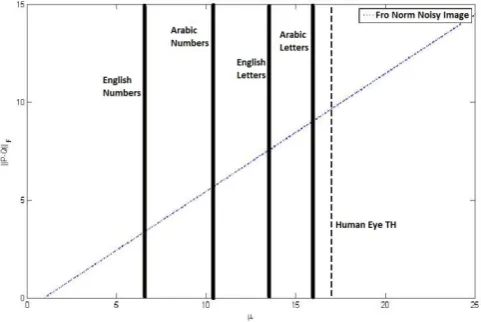
Where 𝑄 is a matrix representation of the given image and 𝑛 is an equal size matrix consisting of normally distributed random numbers to simulate the noise, and 𝜇 is the noise factor and was varied between [0:25]. The Frobenius norm of (𝑃 − 𝑄) for different values of µ was calculated and the results are shown in Figure 10. Figure 10 shows the results of running the algorithm on artificially induced noisy photos of English numerals, English Letters , Arabic Numbers and Arabic Letters using the number of peaks algorithm and simulating an average of 60 runs for each character. It turns out that the value of the threshold of recognition is equal to 𝜇 = 15.93 for Arabic letters, 𝜇 = 6.57 for English numbers, 𝜇 = 13.55 for English letters and 𝜇 = 10.42 for Arabic Numbers, while the human eye threshold was 17 in this case. The human eye threshold was based on the human responses to the noisy images, and it was determined after checking with number of participants.
The performance of the algorithm was also tested when the images of the characters are rotated. The rotation of the image is only considered around the z-axis (perpendicular to the image plane) with an angle θ measured from the x-axis counter clockwise as seen in Figure 11.
Figure 10: Performance of the Frobenius norm of (P-Q) as a Function of 𝝁 for the Number of Peaks Algorithm
The solid lines in Figure 11 indicate the x and y axis, and the broken lines show the axes after they were rotated by the angle of rotation θ.
Figure 11: a Sample of a Rotated Image
Figure 12 shows an output simulation of the preprocessing stage before applying the recognition algorithm on the given image. The figure shows the image used and the image
complement which is necessary for the recognition algorithm, and also shows the rotated image before applying the recognition algorithm.
Figure 12: Output Simulation of the Preprocessing Stage
The test was done on all possible characters in a Saudi license plate. The results for the performance of the algorithm due to rotation, for English numbers as an example, are shown in Table 4.
Table 4: Resulted Rotational Thresholds for the Number of Peaks Algorithm for English Numbers
English Number
Threshold Angle for Number of Peaks Algorithm
Positive Rotation Negative Rotation
0 180o -180 o
1 180o -3 o
2 3o -1 o
3 5o -5 o
4 17o -9 o
5 1o -1 o
6 43o -26 o
7 1o -4 o
8 4o -3 o
9 4o -3 o
The second column of table 4 shows the maximum rotational angle, which a given character can be correctly identified by the recognition algorithm. Any degree of rotation greater than the threshold angle, for a specific image, would give incorrect results. It is clear that 0 is invariant under rotation since, no matter how it is rotated, it will always give two peaks. 5 is the least invariant number to rotation since a rotation of 1 degree will make it unrecognizable by this algorithm.
6.
PIXEL DENSITY ALGORITHM
Similar to the number of peaks algorithm approach regarding the crossing lines and their location, only this algorithm depends on calculating the pixels density in a character for a specific crossing line. Pixel density is defined as the percentage of a specific intensity level with respect to the total number of pixels in a given line [20]. The lines are taken as shown in Figure 13.
the entire pixels that line T is covering. Any given factor can be in the range of [0:0.49] to simulate the crossing line.
Figure 13: Crossing Lines of an Image Table 5 shows the results of the pixels density of the crossing lines, based on the top row of the table for the given factor 1/4, and for the characters of the Arabic numbers. Grouping the characters into smaller groups, similar to the previous algorithm until all characters are recognized, is shown in Table 6.
Table 5: Arabic Numbers’ Percentage for F= 1/4
F=1/4 H T B V L R
0
0.9836 0.6721 0.6885 0.9846 0.6769 0.67691
0.6154 0.7179 0.4359 0.6686 0.3837 0.80232
0.4667 0.3867 0.44 0.7099 0.6173 0.41363
0.3368 0.9158 0.2421 0.6885 0.612 0.17494
0.3765 0.2941 0.3176 0.7711 0.7169 0.16875
0.4894 0.7553 0.9681 0.7197 0.7576 0.79556
0.2574 0.2277 0.3663 0.3216 0.206 0.55787
0.5 0.7442 0.2674 0.6042 0.526 0.44278
0.5349 0.2674 0.7326 0.6368 0.4474 0.50539
0.2737 0.6211 0.4 0.4591 0.4364 0.8227Table 6: Arabic New Numbers’ grouping for F=1/4
F=1/4 H T B V L R
6
0.2574 0.2277 0.3663 0.3216 0.206 0.55788
0.5349 0.2674 0.7326 0.6368 0.4474 0.50534
0.3765 0.2941 0.3176 0.7711 0.7169 0.16872
0.4667 0.3867 0.44 0.7099 0.6173 0.41363
0.3368 0.9158 0.2421 0.6885 0.612 0.17497
0.5 0.7442 0.2674 0.6042 0.526 0.44271
0.6154 0.7179 0.4359 0.6686 0.3837 0.80239
0.2737 0.6211 0.4 0.4591 0.4364 0.82275
0.4894 0.7553 0.9681 0.7197 0.7576 0.79550
0.9836 0.6721 0.6885 0.9846 0.6769 0.6769Also in many cases, similar to the number of peaks algorithm, a specified factor cannot distinguish between all characters in a given group, and the use of another factor is needed in order to fully recognize all characters, as explained in the following examples:
i. Differentiating between 8, 9 and 6 is not possible for the English numbers using factor 1/4, as seen in Table 7, unless other factor is used.
ii. Differentiating between 3 and 7 is not possible for the Arabic new numbers using factor 1/4, as seen in Figure 14, unless other factor is used.
Table 7: English Numbers’ Grouping for F=1/4
Figure 14: Flow Chart for Recognizing Arabic New Numbers
6.1.
Results for the Pixel Density Algorithm
Simulation was done on all the images representing all possible characters in different sections of the license plate. The pixel density percentages calculated for numbers 9 and 6, as mentioned in the previous algorithms are shown in Tables 8 and 9 respectively.Table 8: Percentages for Number 9 with Artificial Noise
H 1/4 T 1/4 T 1/3 B 1/3
0.8812 > 0.6 0.5050 > 0.4 0.5248 > 0.4 0.2673 < 0.4
Table 9: Percentages for Number 6 with Noisy Image
H 1/4 T 1/4 T 1/3
0.9231 > 0.6 0.7077 > 0.4 0.3538 < 0.4
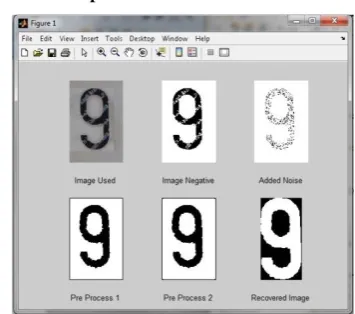
Figure 15 shows the case of the number 9 with maximum addition of the artificial noise up to the level where it can hardly be recognized by the human eye, but the algorithm was able to recognize it successfully. The results for the crossing lines in the recovered image are given in Table 10.
Table 10: Percentages for Figure 15
H 1/4 T 1/4 T 1/3 B 1/3
0.76 > 0.6 0.49 > 0.4 0.52 > 0.4 0.26 < 0.4
Figure 15: Plate to Recognition with Extensive Artificial Noise
The algorithm was able to recognize the mentioned character successfully.
6.2.
Error Performance for Pixel Density
Algorithm
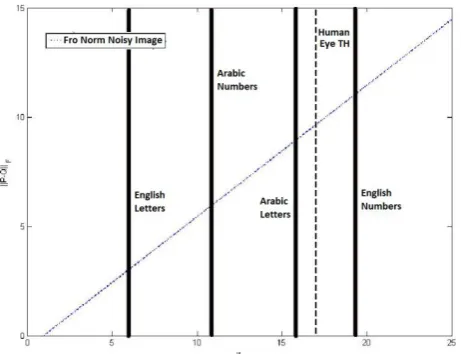
The same error analysis that was done for the number of peaks algorithm was simulated for the percentage algorithm. It turns out that the percentage algorithm gives better results, on average, than the number of peaks approach. In Figure 16, and for the case of English numbers the value of the threshold for recognition is 𝜇 = 21.48, for English Letters 𝜇 = 18.32, for Arabic numbers 𝜇 = 15.38 and for Arabic Letters 𝜇 = 15.37. All values for were calculated as an average of 60 runs for all possible characters. The dashed vertical line shows the human eye threshold as it was shown in the previous algorithm.
Figure 16: Performance of the Frobenius norm of (P-Q) as a Function of 𝝁 for the Percentage Algorithm
Performance of the algorithm due to image rotation was also tested. The results are shown in Table 11. It is clear from those tables that the percentage algorithm is more sensitive to rotation than the number of peaks algorithm.
Table 11: Resulted Rotational Thresholds for the Pixel Density Algorithm for English Numbers
English Number
Threshold Angle for Pixel Density Algorithm
Positive Rotation Negative Rotation
0 12o -16 o
1 9o -8 o
2 18o -6 o
3 14o -15 o
4 30o -27 o
5 59o -15 o
6 3o -24 o
7 10o -29 o
8 19o -16 o
9 23o -23 o
7.
POSITION OF THE PEAKS
ALGORITHM
Each column in the table has two headings. The topmost heading indicates the line used H, T, B, V, L and R. The lower heading indicates the position on the line where the peak is presented. A 1 in a column means that there is a peak in that position for that line. A 0 indicates no peak is found in that position on that line. Grouping the characters into smaller groups, similar to the previous algorithms, until all characters are recognized is shown in Table 13
Figure 17: Crossing Line of an Image for the Position Algorithm
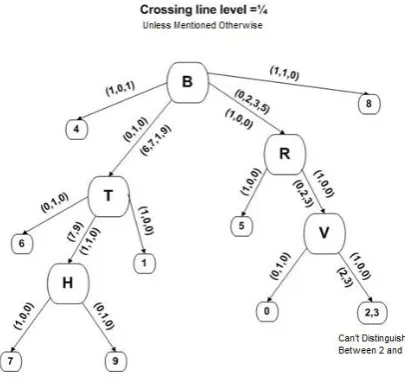
Table 12: Arabic Old Numbers’ Position of the Peaks for Specific Line Crossing for F=1/4
Table 13: Arabic Old Numbers’ Grouping for F= 1/4
Figure 18: Flow Chart for Recognizing Arabic Old Numbers Numbers
Figure 19: Flow Chart for Recognizing Arabic Letters
Also in many cases, similar to the other two algorithms, a specified factor cannot distinguish between all characters in a given group, and the use of other factor is need in order to fully recognize all the characters, as seen in the following examples:
i. Differentiating between 2 and 3 is not possible for the Arabic old numbers using factor ¼, as seen in Figure 18. ii. Also for the Arabic letters, the characters for letters ا (A) and م(Z)also cannot be distinguished from each other using the factor 1/4 alone as seen in Figure 19.
7.1.
Results for the Position of the Peaks
Algorithm
positions returned when the numbers 9 and 6 were recognized respectively.
Table 14: Positions for Number 9 with Artificial Noise
R 1/4 V 1/4 H 1/4
[1,0,0] [1,1,1] [1,0,0]
Table 15: Positions for Number 6 with Noisy Image
R 1/4 L 1/4
[1,1,0] [1,0,0]
The algorithm was able to identify the mentioned characters successfully.
7.2.
Error Performance for the Position of
the Peaks Algorithm
The same error analysis that was done for the number of peaks algorithm, and the pixel density algorithm were repeated for the position of peaks algorithm.
Figure 20 shows a plot of the Frobenius norm of (P-Q) as a function of 𝜇. For the case of English numbers the value of the threshold of recognition is 𝜇 = 6.48, for English Letters 𝜇 = 13.62, for Arabic numbers 𝜇 = 10.48 and for Arabic Letters 𝜇 = 15.82. All values for were calculated as an average of 50 runs for all possible characters. The dashed vertical line shows the human eye threshold as it was shown in the previous two algorithms.
Figure 20: Performance of the Frobenius norm of (P-Q) as a Function of 𝝁 for the number of Peaks Algorithm
The algorithm was also tested on rotated images of all possible characters. Table 16 gives the angles of rotation in which each character was correctly recognized.
Table 16: Resulted Rotational Thresholds for the Peak Position Algorithm for English Numbers
English Number
Threshold Angle for the Position of Peaks Algorithm
Positive Rotation Negative Rotation
0 6o -7o
1 10o -3o
2 14o -15o
3 9o -9o
4 29o -5o
5 7o -20o
6 7o -3o
7 5o -17o
8 5o -8o
9 7o -13o
8.
ALGORITHMS COMPARISON
It was shown that the “number of Peaks” algorithm can successfully recognize English numbers in new Saudi license plates; however, it cannot distinguish between Arabic numbers 0, 1 and 6 in old and new Saudi license plates for some specified factors. The algorithm can successfully recognize old and new Arabic letters, but it cannot distinguish between English letters T and L for some factors.
It was shown that the “percentage algorithm” can correctly recognize all English and Arabic numbers and letters in new Saudi plates and Arabic numbers and letters in old Saudi plates if different factors are used for a given group of characters.
It was shown that the “position of peaks” algorithm can correctly recognize English and Arabic numbers and English letters in new Saudi plates. It can also recognize Arabic letters in old Saudi plates. However, it cannot distinguish between Arabic letters ا and م in new Saudi plates. Moreover, Arabic numbers 2 and 3 in old Saudi plates cannot be distinguished unless different factors are used
9.
CONCLUSION
In this paper three methods for recognizing characters in Saudi license plates were introduced. All methods rely on analyzing information about pixels in six lines. Three lines are taken vertically across the bounding box of the character to be recognized while the other three lines are taken horizontally. Each three lines are taken in the middle of the character and around the middle; left and right of the middle for vertical lines and above and below the middle for horizontal lines. The place at which the non-middle lines are taken is always at a distance from the nearest boundary of the bounding box. This distance is a percentage of the total length and is called a factor. The first method, number of peaks, was an extension of a method that was developed for Lebanese license plates. It counts the number of times there is a difference (peak) between pixels along the line from black to white. The second method, pixel percentage method, calculates the percentage of character pixels to total number of pixels on a line. The third method, peak positions method, relies on the positions of the peaks of the first method rather than their number.
noise. Percentages method is the most resistant to rotation errors while the peak positions method gives the worst results when characters are rotated.
Currently the developed methods run on a PC using MATLAB. Future research should concentrate on optimizing the current MATLAB code to support real-time video. Currently, it would take around 7 seconds on average to process all characters in a given Saudi license plate. Such a response time is acceptable only for cases where the vehicle stops in front of the camera. The algorithms are highly parallelizable. First, the lines can be independently processed and we do not need to wait for one line to be processed to be able to process another. Even the processing of the lines can be parallelized since the information resulted from a line is local and does not depend on global features. Another area of optimization would be to explore the alternative lines that can be used to recognize a character. This is especially important if we want to parallelize the work since an alternative line might be required for another set of characters and thus would have been processed for those characters. Finally, optimization can also be achieved by trying to see whether mixing between processing of lines using different methods can give better results. For example, starting with the number of peaks method and then switching to the positions of peaks or percentages.
Future work should also focus on checking whether the methods are valid for other license plates within the Gulf Cooperation Council (GCC), Middle East and North Africa (MENA) region or the world. The methods are independent of the language used. They explore the differences between shapes of the characters being used and therefore should be applicable to any license plate. Furthermore, it would be interesting to see whether the methods (or an extension) can be used for recognition of other than license plate characters. Road signs, passport information, indoor direction signs are all valid areas to test the methods since they involve a limited set of characters that have unique differences.
10.
REFERENCES
[1] Hasan Obeid and Rached Zantout, “Line Processing: An Approach to ALPR Character Recognition”, ACS/IEEE International Conference on Computer Systems and Applications, Amman, Jordan, May 13-16, 2007. [2] S. Hamidreza Kasaei, S. Mohammadreza Kasaei, S.
Alireza Kasaei, New Morphology-Based Method for Robust Iranian Car Plate Detection and Recognition, International Journal of Computer Theory and Engineering, Vol. 2, No. 2 April, 2010, 1793-8201. [3] Wenjing Jia, , Huaifeng Zhang, Xiangjian He,
Region-based license plate detection, Journal of Network and Computer Applications, Volume 30, Issue 4, November 2007, Pages 1324-1333.
[4] Wisam Al Faqheri and Syamsiah Mashohor, A Real-Time Malaysian Automatic License Plate Recognition (M-ALPR) using Hybrid Fuzzy, IJCSNS International Journal of Computer Science and Network Security, VOL.9 No.2, February 2009.
[5] Bacel Agha, Majed Yehya, Mazen Jerman, Tarek Hattab, and Khalil Sidawi, "Arabic Optical Character Recognition System," Beirut Arab University, 2004-2005, pp. 5-19.
[6] http://cslu.cse.ogi.edu/HLTsurvey/ch2node6.html, Survey of the State of the Art in Human Language Technology (1996)
[7] Remus Brad, "License Plate Recognition System,” Proceedings of the 3rd International Conference on Information, Communications and Signal Processing, Singapore, October 2001
[8] Ponce, P., Wang, S.S. & Wang, D.L. (2001). License Plate Recognition. Report, Department of Electrical and Computer Engineering, Carnegie Mellon University.
Retrieved from
http://www.ece.cmu.edu/~ee551/Final_Reports/Gr18.551 .S00.pdf.
[9] Ye Wang, Honggang Zhang, Xu Fang, and Jun Guo, “Low-Resolution Chinese Character Recognition of Vehicle License Plate Based on ALBP and Gabor Filters”, 2009 Seventh International Conference on Advances in Pattern Recognition, February 4-9, Kolkata, India.
[10]David Chanson and Timothy Roberts, "License Plate Recognition System," Department of Electrical and Electronic Engineering, Manukau Institute of Technology, Auckland.
[11]LV Fang , Zhang song-yu and HU lin-jing, “Image Extraction and Segment Arithmetic of License Plate Recognition”, 2nd International Conference on Power Electronics and Intelligent Transportation System, Dec. 19, 2009, Shenzhen, China.
[12]Serkan Ozbay and Ergun Ercelebi, "Automatic Vehicle Identification by Plate Recognition," Transactions on Engineering, Computing and Technology, version 9, November 2005, ISSN 1305-5313.
[13]Muhammad Sarfraz, Mohammed Jameel Ahmed, Syed A. Ghazi, "Saudi Arabian License Plate Recognition System," International Conference on Geometric Modeling and Graphics, , pp. 36, 2003 International Conference on Geometric Modeling and Graphics (GMAG'03), London, England, July 16-July 18.
[14] Broumandnia, A. & Fathy, M. (2005, January). Application of Pattern Recognition for Farsi License Plate Recognition," International Journal on Graphics, Vision and Image Processing. Volume 5. Issue 2. (pp. 25-31).
[15]Halina Kwasnicka and Bartosz Wawrzyniak, "License Plate Localization and Recognition in Camera Pictures", Faculty Division of Computer Science, Wroclaw University of Technology, Artificial Intelligence Methods, November 13-15, 2002, Gliwice, Poland. [16] Van Heerden, R.P. &Botha, E.C. (2010, November).
Optimization of Vehicle License Plate Segmentation and Symbol Recognition. The 21st Annual International Symposium of the Pattern Recognition Association of South Africa. Stellenbosch, South Africa.
[18]Rafael C. Gonzalez and Richard E. Woods, "Digital Image Processing," Second edition, Prentice Hall, pp. 523-532, 2002, ISBN: 0130946508.
[19]Khaled Almustafa, Rached N. Zantout, Hasan R. Obeid and Fadi Sibai “Recognizing Characters in Saudi License Plates Using Character Boundaries,” International Conference on Innovations in Information Technology, 2011 pp. 415 – 420, Abudabi, UAE
[20]Khaled Almustafa, Rached N. Zantout, Hasan R. Obeid, "Pixel Density: Recognizing Characters in Saudi License
Plates," 10th International Conference on Intelligent Systems Design and Applications, 2010, ISDA 2010 Egypt.
[21]Khaled Almustafa, Rached N. Zantout, Hasan R. Obeid, “Peak Position, Recognizing Characters in Saudi License Plates,” 2011 IEEE GCC Conference and Exhibition for Sustainable Ubiquitous Technology, Dubai, UAE,