Research on Flame Detection Method by Fusion Feature
and Sparse Representation Classification
Xiangang Jiang
*, Chuanxiu Hu, Zizhu Fan, Panpan Zhang
East China Jiaotong University, Nanchang 330013, Jiangxi, China.
* Corresponding author. Tel.: 13657007067; email: [email protected] Manuscript submitted June 24, 2015; accepted October 15, 2015. doi: 10.17706/ijcce.2016.5.4.238-245
Abstract: In order to improve recognition accuracy and efficiency for real-time monitoring, the paper proposed a static-dynamic fusion feature method by pixel’s color moment and covariance matrix descriptor in the CYMK and YCrCb color space. It employs the covariance matrix descriptors to represent the singular
flame’s feature in a assemble vector by analyzing rationality of selection and combination of the features. It proposed a method of blending and classification of flame’s attributes by sparse dictionary from the covariance matrix descriptor and color’s low order moments. It had implemented and analyzed sparse representation classification of flame regions by MP and OMP processing. The experiments showed that the OMP sparse representation classification gain higher classification accuracy than other traditional classification methods.
Key words: Covariance matrix descriptor, image processing, orthogonal matching pursuit, sparse dictionary.
1.
Introduction
In this paper, we explore the multi-feature fusion of covariance matrix descriptors to express spatial-temporal OMP methods are employed to obtain the sparse representation coefficients. As a comparison, information of the flame region as vector feature. A sparse dictionary is refined out by matching pursuit and orthogonal matching pursuit processing from the samples of the flame and the non-flame. Finally, the MP and the Riemannian manifold distance, logarithmic Euclidean distance and support vector machine have been introduced for the covariance matrix measurement analysis [1].
2.
Feature Definition and Composition
2.1.
Defining Spatial-Temporal Features
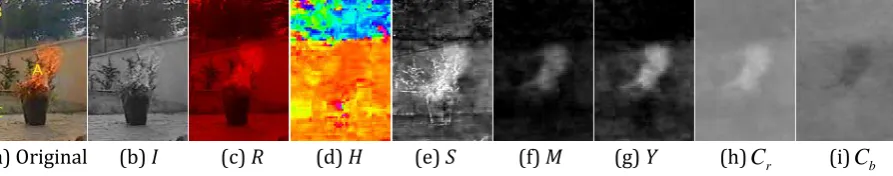
In channels of different color space models, the measurement and discrimination for a flame region are dissimilar. Some color model’s channels and component are acclimated to human vision for being used to describe the singular properties of the flame regions [2]. The flame region’s spatial-temporal domain features are decomposed in different channel image showninthe Fig. 1.
space can segment the flame region apparently. The color components of Cr and Cb of the YCrCb space offer
distinguish for the flame region. We analyze and describe features of spatial distribution and the frequency of the jump of image region, by space domain and time domain [3], [4].
(a) Original (b) I (c) R (d) H (e) S (f) M (g) Y (h)
C
r (i)C
b Fig. 1. The different feature channel images of a flame.2.2.
Defining Features Based on Color Moment
For describing color distribution of a flame region, its first order color moment μij is employed to present
average color strength of the flame region, and its second order color moment 2 ij
is employed to present color variance, and finally its third order color moment sijis employed to show the color skewness of the
region. Owing to the better flame segmentation performances by using the components of Cr, Cb and Y, so
that the low-order color moments features of the components of Cr, Y, Cb are employed to describe color
texture and distribution, they are defined as follows:
flame
Moments
{
,
,
,
,
,
,
,
,
}
r r r b b b
C C C Y Y Y C C C
u
s
u
s u
s
(1)2.3.
Defining Fusion Features Based on Covariance Matrix Descriptor
In order to describe the flame region preferably, many kinds of features should be fused into an integrated vector [5]. The covariance matrix descriptors is an appropriate method to fuse a flame’s multiple features. Let the n-dimensions feature vector be
[ ,
1 2, ,
]
T n
F
f f
f
. We have N trained samples. The krepresents the kth sample. The covariance between the ith feature and the jth feature of a flame region is defined as follows:
1 1 1
1
1
1
1
N N N
ij ik ik jk jk
k k k
c
f
f
f
f
N
N
N
(2)From the foregoing, descriptor Cij of a covariance matrix is a symmetric matrix. Its elements on the
diagonal line are variances of different features of a flame region, but its elements on the off-diagonal are correlations of different features.
Now, some features are chosen and fused into a combination of features as
1. In consideration of thefact that more red component of a flame region than that of blue,
RB
is introduced to
1. In view of thejumping of intensity of a flame area, Imax is also introduced to
1. Generally, all features are analyzed bytheir common statistical properties of frames. Let the number of frames of a spatial-temporal block is k, ti
( /2 ) ( /2 )
( /2 ) ( /2 )
( /2 ) ( /2 ) ( /2 ) ( /2 )
( /2 ) ( /2 )
max min b
max
max(
( , ,
),
( , ,
))
min(
( , ,
),
( , ,
))
( ( , ,
)
( , ,
))
( ( , ,
)
( , ,
))
max( ( , ,
), ( , ,
))
i k i k
i k i k
i k i k i k i k
i k i k
r r r
b b
C
C x y t
C x y t
C
C x y t
C x y t
RB
R x y t
B x y t
R x y t
B x y t
I
I x y t
I x y t
( /2 ) ( /2 )
( , ,
i k)
( , ,
i k)
t
I x y t
I x y t
(3)The combination of features
1 is as follows:max min
1
[
,
b,
,
max,
]
T
r t
C
C
RB I
I
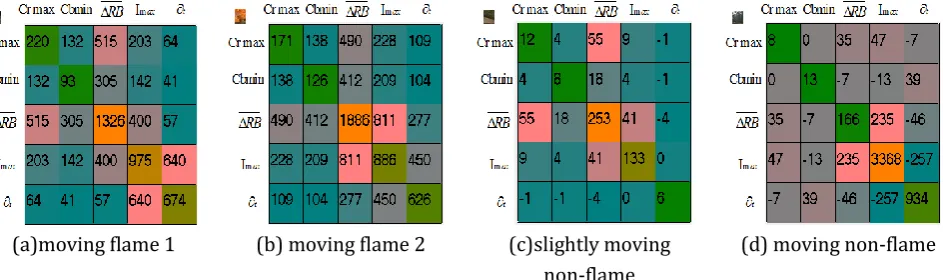
(4)Based on the experimental data, Fig. 2 reveals four covariance matrices based on combination of features
1
on spatial-temporal domain. In Fig. 2, there are two covariance matrices of the flame area and two covariance matrices of the non-flame area [6].(a)moving flame 1 (b) moving flame 2 (c)slightly moving non-flame
(d) moving non-flame
Fig. 2. Covariance matrices of the flame area and the non-flame area.
3.
Classification Method
3.1.
Measuring Distance Based on the Covariance Matrix Descriptors
Measuring model of descriptor of a covariance matrix is mainly based on the measurement of affine Riemannian space [7], [8]. The distance between descriptors of two covariance matrix is shown as follows:
2
1 2 1 2
1
(
,
)
ln
(
,
)
n
k k
C C
C C
(5)1 2
(
,
)
k
C C
is the kth generalized eigenvalue for descriptorsC
1 andC
2 of covariance matrix [9]. Because the calculation of this Riemannian distance is too complicated, we decide to simplify the calculation and show it as follows:2
1 2 1 2
(
C C
,
)
Tr
(ln(
C
) ln(
C
))
3.2.
Classification and Recognition Based on Sparse Expression
3.2.1.
Sparse expression based on matchingpursuit
In 1993, Mallat and Zhang propose matchingpursuit algorithm that can drastically reduce computing time for finding the approximate solution [10]. Matching pursuit algorithm is shown as follows: firstly, we choose a columnvector (0)
j
F
from feature matrix F that is most similar to test sample x. Let α be theappropriate coefficient, we can get vector difference 0
1 j
x
x
F
. Secondly, we choose a columnvector(1) j
F
from feature matrix F that is most similar to test sample x1, and we can get vector difference(1)
2 1 1 j
x
x
F
. Repeated iteration as the above method. Finally, vector x of the test sample can be expressed as linear combination of vectors of the training samples [11], when the vector difference approximates zero vectors [12], [13].3.2.2.
Sparse expression based on orthogonal matchingpursuit
Orthogonal Matching Pursuit algorithm [14] is that it can orthogonalize all selected columnvectors which is most similar to residual value to construct a new solution space and let feature signal x of the flame area project again in the new solution space. According to experiments, we can know that when the number of iterations of MP and OMP are the same, the reconstruction effect of OMP is better than MPs. It means that sparse expression classifier based on OMP can recognize a flame region more accurately. Here are detailed steps for decomposing feature signal of the flame region by OMP.
1) We calculate the inner product of feature signal x of the flame area and the column of over-complete dictionary matrix F of the flame area. And we choose a columnvector
F
j from feature matrix F thathas largest absolute value of the inner product with feature signal x as most similar to test sample x. In the (r+1)th iteration, the largest absolute value of inner product is shown as follows:
(1,..., )
,
rsup
,
r j j N r j
R f F
R f F
(7)2) If
R f F
r,
j r
is true,we should stop the iteration.3) The decomposition by OMP, in the first iteration, is shown as follows:
0 0 1 0
0
,
j j 1 1 j 1x
R f
x F
F
R f
F
R f
(8)In the second iteration, the decomposition is shown as follows:
1
2 0
,
i ii j j
i
x
R f F
F
R f
2 0 2 11
F
j 2F
jR f
2
, with 1 2 01 2
j j
F
b F
(9)The decomposition by OMP, in the (r+1)th iteration, is shown as follows:
1 1
1 1
0 r
r r i
j i j r
i
F
b
F
, with
r1,
F
j i
0
,i
0,1,
,
r
1
(10)
2 1
1 1
,
r r
r r
R f F
r j
,1 1 1
1 1 1 1
r r r r
i i
b
i r
1
1 1
0 r
i r
i j r
i
x
F
R
f
, with
R
r1f F
,
j i
0
,i
0,1,
,
r
(12)4) Circulate the steps in order. Until
R f F
r,
j r
is true,finish the circulation.We always choose a columnvector ( )i j
F
from feature matrix F that has largest absolute value of innerproduct with the residual value
R f
i , for OMP and MP. The improvement of OMP algorithm is that it setweight of atoms that belong to selected samples again by solving the problem of leastsquaremethod, at each update iteration, to ensure that the residual value is least and the projection is optimal [15].
3.2.3.
Sparse decomposition based on sparse dictionary
In experiment, the sparse dictionary is trained and refined by the combination of features
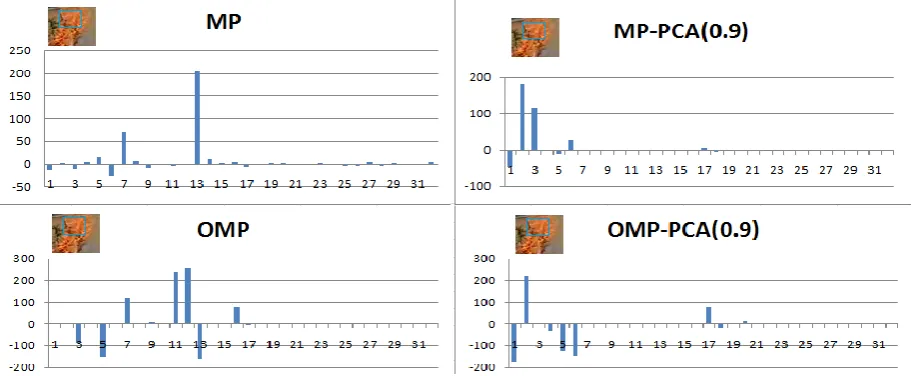
1 of 16 flame positive samples and 16 negative samples. 1-16th samples are corresponding to positive samples of the flame regions and 17-32nd samples for the negatives. In Fig. 3, the heights of histograms are sparse decomposition coefficients [16]. The results are shown as follows:Fig. 3. Histogram of sparse decomposition coefficients on the flame area.
In MP-PCA0.9 of Fig. 3, orthogonal characters of feature varieties are ensured by PCA (Principal Component Analysis). This can make up the inadequacy of sparse decomposition by MP and make almost all of nonzero sparse decomposition coefficients of the flame area correspond to 1-16 samples. Because OMP already orthogonalizes all atoms of sparse dictionary, we introduce PCA method to improve computation efficiency for sparse decomposition. In the process of the sparse decomposition, we get a conclusion that the coefficients of the first and second matching are much larger than other coefficients. This means that other coefficients are used to modify the residual value.
4.
Experiment Results and Analysis
descriptors) from covariance matrix that is constructed by the features assemble of
1, and adopt them to train the flame model. One candidate flame region is ensured by function (13). The number of pixels whose absolute differencevalue ofC
randC
b is larger than the thresholdT
Crb is accumulated asN
Crb, and thenumber of pixels whose intensity changes in different frames is accumulated as
N
I,if the ratio of therb
C
N
and the total number of pixels in the block is bigger than the threshold
T
CR, and at the same time the ratioof
N
I and the total number of pixels in the block is more than the thresholdT
IR, the investigatedspatial-temporal block is affirmed as a suspicious flame area. The rule function is shown as follows:
In experiments, we take the threshold rb
C
T
as 25, and setT
CR as 0.2. LetT
I be 10. LetT
IR be 0.15. The recognition rates and classification times are shown in Table 1:Table 1. Recognition Rates and Classification Times for Different Features and Classifiers
Classification methods
Accuracy False alarm rate Running time/s (100 frames) Non-candidate Candidate Moment CMD Moment CMD Moment CMD Moment CMD Riemann 96.8 0.005 0.64 0.19 SVM-RBF 96.4 97.8 0.09 0.006 0.56 0.46 0.19 0.16 SRC+MP 96.7 97.9 0.07 0.003 1.23 0.96 0.24 0.22 SRC+OMP 96.9 98.0 0.05 0.005 1.86 1.25 0.28 0.26 SRC+MP+PCA 97.3 98.5 0.05 0.004 1.23 0.64 0.25 0.21 SRC+OMP+PCA 98.6 99.5 0.03 0.003 1.13 0.44 0.21 0.15
In the case of non-candidate processing,it need more time to classify an flame region than the one that is candidate, either by the moment or the CMD (covariance matrix descriptor) features. It is emerged that higher false alarm rate by the moment, from TABLE1. However, the covariance matrix descriptors that reflect flame’s inherent property appears a higher accuracy of recognition and lower false alarm rate by
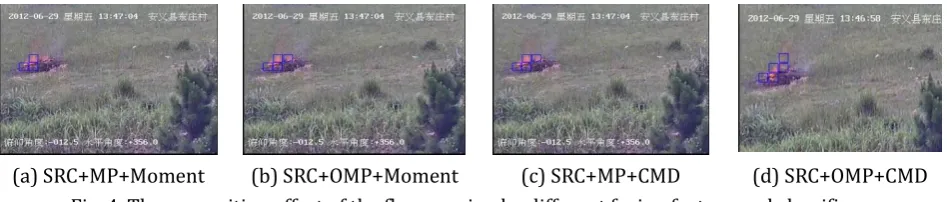
CMD. SRC processed by OMP has a better performance than MP. The flame recognition result for different assemble features and classifiers, and they are shown in Fig. 4.
(a) SRC+MP+Moment (b) SRC+OMP+Moment (c) SRC+MP+CMD (d) SRC+OMP+CMD
Fig. 4. The recognition effect of the flame region by different fusion feature and classifiers.
Through Fig. 4, we know that the effect of
CMD
processing is better than that of color momentprocessing for recognizing a flame region. Through Fig. 4(c) and Fig. 4(d), we know that if we employ the
if
,Inc(
)
(
/
(
,
))
rb rb
rb
r b C C
C M N CR
C
C
T
N
N
M N
T
and( / 2) ( / 2)
if
( , ,
)
( , ,
)
, Inc(
)
(
/
(
,
))
i k i k I I
I M N IR
I x y t
I x y t
T
N
N
M N
T
OMP to do reconstruction and decomposition of SRC, orientated flame region is more precise with less false alarm rate. All the factors have been taken into consideration through the Table 1 and Fig. 4, It is sure that the sparse representation is a best choice and valid for a flame region classification.
5.
Conclusion
In this paper, we select some singular spatial-temporal features of the flame region and amalgamate them in assembled descriptors of covariance matrix. The singular properties of the flame regionin the YC Cr b
color space spatial-temporal block and single frame’s lower order moments have been analyzed to construct flames’ over-complete sparse dictionary. Moreover, it has been observed as the standard template for Riemann distance classification that the clustering center value of all samples which has biggest sparse expression frequency for testing flame regions. Experiment results show that the proposed sparse representation method for flame detection is a reliable and cost-effective solution with high recognition accuracy and low false alarm rate in real-time monitoring.
Acknowledgment
This research has been supported by the National Natural Science Funds of China under Award #61622031, #61263032.
References
[1] Habiboglu, Y. H., Gunay, O., & Cetin, A. E. (2011). Real-time wildfire detection using correlation descriptor. Proceedings of 19th European Signal Processing Conference (pp. 894-898).
[2] Sun, Y. X., Xie, Z., & Gao, J. (2013). A novel kernel classification method via image novelty detection. Acta Optica Sinica,33(10).
[3] Angayarkkani, K., & Radhakrishnan, N. (2010). An intelligent system for effective forest fire.
International Journal of Computer Science and Information Security, 7(1), 202-208.
[4] Ko, B. C., Cheng, K. H., & Nam, J. Y. (2009). Fire detection based on vision sensor and support vector machines. Fire Safety Journal, 44(3), 322-329.
[5] Rong, J. Z., Yao, W., Gao, W., et al. (2013). Fire video detection method based on multi-features fusion.
Journal of Combustion Science and Technology, 19(3), 227-233.
[6] Cui, B., & Qiao, J. (2009). Forest flame image segmentation method based on Cr, Cb color space. Journal
of Shenyang University of Technology, 31(1), 89-92.
[7] Habiboglu, Y. H., Günay, O., & Cetin, A. E. (2012). Covariance matrix-based fire and flame detection method in video. Machine Vision and Applications, 23(6), 1103-1113.
[8] Porikli, F., Tuzel, O., & Meer, P. (2006). Covariance tracking using model update based on lie algebra.
Proceedings ofIEEE Conference on Computer Vision and Pattern Recognition (pp. 728-735).
[9] Förstner, W., & Moonen, B. (1999). A metric for covariance matrices. Control Engineering, 30(12), 45-49. [10]David, L., & Donoho, M. E. (2003). Optimally sparse representation in general (nonorthogonal)
dictionaries via L1 minimization. Proceedings of the National Academy of Sciences, 100(5), 2197-2202. [11]Gabriel, P., Jalal, F., & Jean-Luc, S. (2007). Learning adapted dictionaries for geometry and texture
separation. Proceedings of Society of Photo-Optical Instrumentation Engineers: Vol. 6701 (p. 670). [12]Yin, W., Li, Y., Zhou, Z., et al. (2013). Remote sensing image fusion based on sparse representation. Acta
Optica Sinica, 33(4).
[14]Wang, C. (2011). Research on Sparse Classification Method of Facial Image. M.S. thesis, Dept. Elect. Eng., Chongqing University, Chongqing, China.
[15]Cevher, V., & Krause, A. (2011). Greedy dictionary selection for sparse representation. IEEE Journal of Selected Topics in Signal Processing, 5(5), 979-988.
[16]Chen, J., & Wang, Y. (2012). Research of the compressive imaging technology. Laser & Optoelectronics Progress, 49(3), 15-22.
Xiangang Jiang was born in April 1958. He is a professor of East China Jiaotong University. He graduated from Railway Institute of Mechanical Engineering and Automation of Central South University in July 1982. He graduated from engineering graphics graduate student class of Beijing University of Aeronautics and Astronautics, in July 1985. From June 1997 to June 1998, He was a visiting scholar in the University of Strathclyde. From February 2003 to February 2004, He was a visiting scholar in the University of Cranfield. He has been engaged in higher education for 28 years, and engaged in bilingual teaching for 6 years. Now, he works at East China Jiaotong University, Jiangxi, China. His research fields are computer graphics and image information processing.
He has published 130 academic theses, with three books about the digital image pattern recognition engineering software design. He is a committee of East China Jiaotong University Academic Committee.
Chuanxiu Hu was born in January 1993. She graduated from Anhui University of Science and Technology in July 2013. Now, she is a postgraduate at East China Jiaotong University. Her research fields are computer graphics and image information processing.
Zizhu Fan was born in August 1975. He graduated from the Computer and Information Engineering College, Hefei University, and he has a master of engineering degree. He is a PhD candidate in Harbin Institute of Technology. Now, he is an associate professor at East China Jiaotong University. His research fields are pattern recognition and machine learning.
He has published 20 academic theses in IEEE Transactions on Neural Networks,
Neurocomputing, and Journal of Information & Computational Science. Some of his papers were indexed by SCI and EI.