Original Research Article
Prevalence of malnutrition and its determinants in an elderly
people in South India
Satyanarayana Konda
1*, Ravi Kumar B. P.
1, Purushottam A. Giri
2INTRODUCTION
According to the World Health Organization (WHO), the population of worldwide elderly people aged ≥60 years is projected to reach 1.5 billion by 2050, a dramatic threefold increase from 524 million in 2010, with the highest increase in developing countries.1 India’s elderly population is also growing rapidly and accounted for 8.1% of the total population in 2011.2 Such a rapid rise in the elderly population will definitely pose several challenges such asscanty income to support themselves,
absence of social security, loss of social status and lack of opportunities for use of their time. Therefore, India needs to prepare to address these social, psychological, economic and health needs of this aging population. According to the 2016 Global Nutrition Report, malnutrition affects 1 in 3 people worldwide making it a growing public health challenge.3 Studies suggest that 31 to 46% of elderly population, depending on the subgroup studied, are at risk for malnutrition.4 Malnutrition is highly prevalent in the elderly population due to various diseases and impairments such as cognitive and physical
ABSTRACT
Background: The population of elderly people aged ≥60 years is increasing worldwide and is projected to reach 1.5 billion by 2050. In India, the elderly people constitute 8.1% of the total population. Malnutrition is highly prevalent in the elderly population due to various diseases and impairments.
Methods: A cross-sectional study was carried out amongst 209 elderly people from February 2018 to April 2018. A questionnaire was used to collect data related to socio-demographic characteristics, Mini Nutritional Assessment (MNA) and regarding medication use, comorbidity, use of a walking aid, smoking and alcohol consumption. The MNA tool was used for the assessment of nutrition status. For an assessment of functional status, the activities of daily living scale and instrumental activities of daily living scale were used. Descriptive analysis and Chi-square test were used to present the data.
Results: The average MNA score was 23.5 (SD=4.3, range: 7-30) and that of BMI was 23.8 (SD=3.9, range: 15.6-38.9). Of 209 study participants, 9.1% were malnourished, 32.5% were at risk of malnutrition and remaining 58.4% were having normal nutritional status. The possible predictors of malnutrition were older age, lower education level, staying single, unemployed, low income and less than three meals daily.
Conclusions: The overall prevalence of malnutrition was found to be 9.1% but the proportion of elderly people at risk of malnutrition was relatively high. Diagnosis and treatment of elderly people at high risk for malnutrition based on the findings of this study may improve functional status and prognosis of elderly people.
Keywords: Malnutrition, Elderly, Mini nutritional assessment, Risk factors, South India
Department of Community Medicine, 1Mamata Medical College, Khammam, Telangana, 2IIMSR Medical College, Badnapur, Jalna, Maharashtra, India
Received: 20 May 2018
Revised: 12 June 2018
Accepted: 13 June 2018
*Correspondence:
Dr. Satyanarayana Konda, E-mail: [email protected]
Copyright: © the author(s), publisher and licensee Medip Academy. This is an open-access article distributed under the terms of the Creative Commons Attribution Non-Commercial License, which permits unrestricted non-commercial use, distribution, and reproduction in any medium, provided the original work is properly cited.
decline, depressive symptoms, emotional variations, poor oral health and socioeconomic changes.5 It is associated with a number of adverse events such as increased risk for falls and pressure sores, impaired wound healing, decreased locomotor activity with delayed reflexes, high incidence of non-communicable diseases, weight lossand increased morbidity. It is also linked to decreased muscle mass, alteration in the structure and function of gastrointestinal system, higher infection rates, poor health outcomes and impaired quality of life.6,7 These can be prevented if nutritional status among elderly people is assessed with simple nutritional measures and treated malnutrition on time. The Mini Nutritional Assessment (MNA) is a useful screening tool to detect malnutrition and risk of malnutrition among elderly people.8 The tool was first developed and published in 1994. It has been widely validated in elderly people and has been extensively used in studies worldwide.9 The MNA tool involves anthropometric measures, dietary problems, weight changes, mobility issues and neuropsychological status. The tool classifies individuals into categories of well nourished, at risk of malnutrition or malnourished. Studies conducted in different parts of India have reported prevalence of malnutrition between 7% and 19% among elderly people using MNA tool and various factors were found to be associated with malnutrition including age, gender, education level, socio-economic status, marital status, number of meals daily, cognitive and physical impairment.10-13 However, there is no data available on the prevalence of malnutrition and its associated factors in Khammam district of Telangana state in South India. Keeping this in mind, the present study was designed to assess the nutritional status among community dwelling elderly people in Khammam, and to describe the socio-demographic and health related factors associated with malnutrition.
METHODS
Study design and study population
A cross-sectional study was carried out amongst 209 elderly people from February 2018 to April 2018. The urban health center of Mamata Medical College and Hospital has six areas from which three areas were randomly selected. The total number of households in these three areas was 1175. In 937 houses, there were no elderly people and nonresponse was obtained in 63 houses. Hence, we surveyed 175 households and 209 elderly people were interviewed. A pilot tested and validated structured questionnaire was used to collect the data from elderly people at least 60 years old from these areas.
Data collection techniques and tools
The information obtained from the study participants included socio-demographic characteristics (age, gender, marital status, education level, occupation, living
containing 8 items (telephone usage, shopping, cooking, housekeeping, laundry, transportation, ability to take medications and financial management) were used. Statistical analysis
All statistical analyses were performed using SPSS, version 18.0 (SPSS Inc., Chicago, IL). For continuous variables means and standard deviations (SD) were used to present the data, while categorical variables were presented as frequency and percentages. Appropriate tests of significance (Chi-square, Student’s t and F-tests) were applied wherever necessary at the 5% level of significance. The p<0.05 was considered as statistically significant at 95% confidence level.
RESULTS
Table 1: Socio-demographic characteristics of study participants.
No. (%) Socio-demographic characteristics
Age (in yrs)
<65 93 (44.5) 65-75 97 (46.4) >75 19 (9.1)
Sex Female 80 (38.3)
Male 129 (61.7) Completed secondary
school
No 159 (76.1) Yes 50 (23.9) Marital status Single 62 (29.7) Married 147 (70.3) Occupation Non-working 144 (68.9) Working 65 (31.1) No. of household
members
<4 98 (46.9) ≥4 111 (53.1) Per-capita income (INR) <7000 ≥7000 110 (52.6) 99 (47.4) Smoking No 172 (82.3)
Yes 37 (17.7) Alcoholism No 173 (82.8)
Yes 36 (17.2) Comorbidity No 80 (38.3) Yes 129 (61.7) Oral medication No 123 (58.9) Yes 86 (41.1) MNA score
<17 19 (9.1) 17-23.5 68 (32.5) >23.5 122 (58.4) Living alone No 179 (85.6) Yes 30 (14.4) Number of meals daily <3 ≥3 70 (33.5) 139 (66.5)
Functional characteristics
ADL independent Yes 183 (87.6) No 26 (12.4) IADL independent Yes 153 (73.2)
No 56 (26.8)
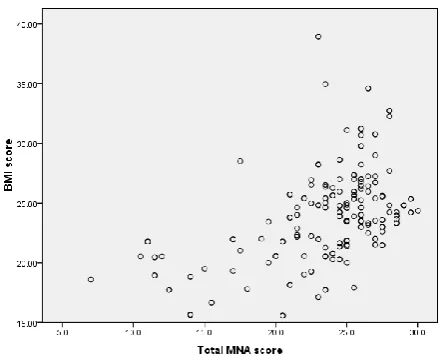
We collected data from 209 elderly people with almost equal representation from each of three areas. The average age of the total participants was 66.8 (SD=6.3, range: 60-90) years and 61.7% were males. The socio-demographic and descriptive characteristics of study participants are shown in Table 1. Mean heights and weights were greater among men compared with women, the difference being statistically significant. The average MNA score was 23.5 (SD=4.3, range: 7-30) and that of BMI was 23.8 (SD=3.9, range: 15.6-38.9). Mean MNA score was almost equal for both men and women. Of 209 study participants, 183 showed functional independence based on ADL scores and 153 based on IADL scores. According to BMI, 8.1% of the elderly people were underweight, 25.8% were overweight and 34.4% were obese. The total MNA score was significantly correlated with BMI (r=0.47; p<0.001) (As shown in Figure 1). Thirty subjects lived alone and majority were not requiring any support services.
Figure 1: Scatter plot and Spearman correlation coefficient (r) of BMI and total MNA score.
BMI=Body Mass Index; MNA=Mini Nutritional Assessment
respect to the mean height and gender distribution (As shown in Table 2). The risk factors associated with malnutrition were old age, low education level, staying single, unemployed, low socio-economic status, less than
three meals daily and use of oral medications (As shown in Table 3). Among the functional characteristics studied, both ADL and IADL dependence was significantly associated with malnutrition.
Table 2: Association between MNA scores and anthropometric measurements of elderly people (n=209).
Variable Well nourished
MNA >23.5
At risk of malnutrition MNA 17-23.5
Malnourished
MNA <17 P value
No. (%) 122 (58.4) 68 (32.5) 19 (9.1)
Age (mean ± SD) 65.6±5.1 66.7±5.7 75.3±8.7 <0.001
Male / Female 76/46 41/27 12/7 0.955
Weight (kg) 67.8±10.1 61.3±11.0 50.3±7.3 <0.001
Height (cm) 164.5±8.4 162.8±6.2 163.7±4.5 0.310
BMI (kg/m2) 25.0±3.1 23.2±4.4 18.7±1.9 <0.001
MUAC (cm) 25.4±6.9 24.3±5.5 20.2±1.2 0.004
CC (cm) 34.1±3.7 31.5±4.6 27.4±1.4 <0.001
MNA = Mini Nutritional Assessment; BMI = Body Mass Index; MUAC = Mid Upper Arm Circumference; CC = Calf Circumference
Table 3: Comparison of socio-demographic characteristics with nutritional status according to MNA scores of elderly people.
Socio-demographic characteristics Well nourished N (%)
At risk of malnutrition N (%)
Malnourished
N (%) P value
Age (in years)
<65 63 (67.7) 28 (30.1) 2 (2.2)
<0.001 65-75 52 (53.6) 39 (40.2) 6 (6.2)
>75 7 (36.8) 1 (5.3) 11 (57.9)
Sex Female 46 (57.5) 27 (33.8) 7 (8.8) 0.955
Male 76 (58.9) 41 (31.8) 12 (9.3)
Completed secondary school No 84 (52.8) 59 (37.1) 16 (10.1) 0.016 Yes 38 (76.0) 9 (18.0) 3 (6.0)
Marital status Single 24 (38.7) 22 (35.5) 16 (25.8) <0.001 Married 98 (66.7) 46 (31.3) 3 (2.0)
Occupation Non-working 79 (54.9) 47 (32.6) 18 (12.5) 0.032 working 43 (66.2) 21 (32.3) 1 (1.5)
No. of household members <4 65 (66.3) 26 (26.5) 7 (7.1) 0.090 >=4 57 (51.4) 42 (37.8) 12 (10.8)
Per-capita income (INR) <7000 53 (48.2) 44 (40.0) 13 (11.8) 0.007 >=7000 69 (69.7) 24 (24.2) 6 (6.1)
Smoking Yes 23 (62.2) 10 (27.0) 4 (10.8) 0.677
No 99 (57.6) 58 (33.7) 15 (8.7)
Alcoholism Yes 23 (63.9) 9 (25.0) 4 (11.1) 0.547 No 99 (57.2) 59 (34.1) 15 (8.7)
Comorbidity Yes 71 (55.0) 42 (32.6) 16 (12.4) 0.095 No 51 (63.8) 26 (32.5) 3 (3.8)
Oral medication Yes 29 (33.7) 43 (50.0) 14 (16.3) <0.001 No 93 (75.6) 25 (20.3) 5 (4.1)
Living alone Yes 18 (60.0) 9 (30.0) 3 (10.0) 0.914 No 104 (58.1) 59 (33.0) 16 (8.9)
Number of meals daily <3 ≥3 31 (44.3) 31 (44.3) 8 (11.4) 0.013 91 (65.5) 37 (26.6) 11 (7.9)
Functional characteristics
ADL independent Yes 115 (62.8) 59 (32.2) 9 (4.9) <0.001 No 7 (26.9) 9 (34.6) 10 (38.5)
IADL independent Yes 100 (65.4) 46 (30.1) 7 (4.6) <0.001 No 22 (39.3) 22 (39.3) 12 (21.4)
DISCUSSION
The present study used the MNA tool, developed by Guigoz, to determine the prevalence of malnutrition or malnutrition risk in elderly people 60 years and above.8 To our knowledge, this is the first report to describe the prevalence of malnutrition and its associated factors in elderly people in Khammam. In the present study, we found 9.1% of the study participants as malnourished, 32.5% were at risk of malnutrition and the remaining 58.4% were having normal nutritional status. Studies conducted in other parts of India reported prevalence of malnutrition between 7 and 19%.10-13 While in other countries it is reported between 0.4 and 24%.15-19 These studies observed different prevalence rates of malnutrition due to use of different definitions for malnutrition and different settings such as private households, general practice, communities and institutions. Because of these differences, the prevalences found are difficult to compare. Among the socio-demographic characteristics assessed, older age, lower education level, staying single, unemployed, low income, use of oral medications and less than three meals daily were associated with malnutrition.
In this study, older age was associated with lower MNA scores. This finding has been shown in some previous studies13,20 while others have shown that age has no effect on nutritional status.21,22 We observed that the older participants were less active and reported reduced appetite and decreased food intake. Therefore, increased focus on nutritional status is required as the age of the elderly people increases. Previous studies have shown that age is associated with increased anorexia and further development of malnutrition among the older population.23-25 In addition, studies have also shown that the prevalence of malnutrition is low in community living elderly people but the risk for malnutrition increase substantially with increase in age.16,21,26 In the present study, we failed to observe an association between gender and nutritional status in contrast to some previous studies.13,18 In this study, nutritional status was associated with education. This could be explained by the fact that higher education can lead to higher income and better lifestyle resulting in a better nutritional status. Furthermore, educated people are more informed about the importance of food for health and more able to understand nutrition. Several authors found that a higher educational level contributes to a better nutritional status.16,18,21
In the current study, malnutrition was more commonly observed among those with a single marital status (unmarried, divorced or widowed). A recent systematic review of 28 observational studies provided strong evidence for the lack of association between the death of a spouse and malnutrition, while some studies have suggested that there is a relationship between marital status and nutritional status, these results remain controversial.20,27 Although the precise mechanism by
which marriage confers health benefits are unclear, studies have shown that married adults have better health and survival.18 Hence, the nutritional status of the elderly can be improved by special attention to those who are single. Similar to findings of study in Lebanon, we found strong association between occupation status and malnutrition.7 In this study, higher income was inversely associated with malnutrition which was already reported in a study conducted among elderly people in Colombia where no income was significantly associated with a lower MNA score.28 Other authors also revealed the same finding that elderly people who live in poverty are at greater risk of malnutrition.19 This effect could be due to reduced food availability, consumption of food low in essential nutrients and growing food insecurity as a result of low income. The socio-economic conditions also influence dietary choices and eating patterns thereby affecting the nutritional status. Many studies reported a strong association between smoking or alcoholism with malnutrition.16 However, in this study, we could not observe any such association.
The present study found that elderly people on oral medications were malnourished than those who were not on oral medications. Oral medications among elderly people may lead to malnutrition by impairing food absorption or enhancing excretion, or by causing nausea, vomiting, diarrhea, constipation.29 Previous studies have also observed the same association between the use of oral medications and malnutrition.20,21 No significant association was found between living status and nutritional status in the current study which was in consonance with studies done by Agarwalla in India and Winter in Australia.13,15 However, some studies have shown that malnutrition was more prevalent among elderly people who lived alone.16
In this study we found that lower MNA scores were associated with those elderly people who had less than three meals daily. A similar finding was reported in south India where most of the elderly malnourished or at risk of malnourishment consumed less than three meals daily.10 Other studies have shown that dry mouth, chewing and swallowing problems and difficulty preparing or eating full meals contributed to malnutrition.30
and instrumental activities of daily living (IADL) scales for the assessment of functional status among elderly people.13,17,28 In this study, the rates of ADL-dependency and IADL-dependency were significantly higher in malnourished group.
In the present study, we observed three limitations. Firstly, the cross-sectional design of the study does not allow examination of causal relationships. Secondly, the association between cognition and nutritional risk is not tested. Finally, the selection of only three areas for the purpose of the study limits the generalization of the results to the whole population.
CONCLUSION
The overall prevalence of malnutrition among elderly people was found to be 9.1%, but the proportion of elderly people at risk of malnutrition was relatively high (32.5%). The possible predictors were older age, lower education level, staying single, unemployed, low income, use of oral medications and less than three meals daily. Functional status, assessed by ADL and IADL, also was correlated with nutrition status. Diagnosis and treatment of elderly people at high risk for malnutrition based on the findings of this study may improve functional status and prognosis of elderly people.
ACKNOWLEDGEMENTS
We profusely thank community social workers at the study sites for their support in this work and interns for their participation in collecting the data. We also thank all the participants for sharing their experiences with us.
Funding: No funding sources Conflict of interest: None declared
Ethical approval: The study was approved by the Institutional Ethics Committee
REFERENCES
1. National Institute on Aging, National Institutes of Health. United States: NIH Publication. Global Health and Ageing. 2011. Available at: http://www.who.int/ageing/publications/global_heal th.pdf. Accessed on 10 April 2018.
2. Census of India. Registrar General of India office, Government of India, India; 2011.
3. International Food Policy Research Institute. 2016. Global Nutrition Report 2016: From Promise to Impact: Ending Malnutrition by 2030.Washington, DC: IFPRI, 2016.
4. Kaiser MJ, Bauer JM, Ramsch C, Uter W, Guigoz Y, Cederholm T, et al. Mini Nutritional Assessment International Group. Frequency of malnutrition in older adults: a multinational perspective using the Mini Nutritional Assessment. J Am GeriatrSoc. 2010;58:1734-8.
5. Favaro-Moreira NC, Hofmann SK, Matthys C, Vereecken C, Vanhauwaert E, Declercq A, et al. Risk Factors for Malnutrition in Older Adults: A Systematic Review of the Literature Based on Longitudinal Data. Adv Nutr. 2016;7:507-22 6. Bostrom AM, Van Soest D, Kolewaski B, Milke
DL, Estabrooks CA. Nutrition Status Among Residents Living in a Veterans’ Long-Term Care Facility in Western Canada: A Pilot Study. J Am Med DirAssoc. 2011;12:217-25.
7. Boulos C, Salameh P, Barberger-Gateau P. Factors associated with poor nutritional status among community dwelling lebanese elderly subjects living in rural areas: results of the AMEL study. J Nutr Health Aging. 2013:1-8.
8. Guigoz Y, Vellas B, Garry PJ. Mini Nutritional Assessment: a practical assessment tool for grading the nutritional state of elderly patients. Facts Res Gerontol. 1994;4(2):15-59.
9. Vellas B, Sieber C. The MNA revisited. What does the data tell us? Paris, France: Scientific Symposium Proceedings XIXth IAGG World Congress of Gerontology and Geriatrics; 2009.
10. Vedantam A, Subramanian V, Rao NV, John KR. Malnutrition in free-living elderly in rural south India: prevalence and risk factors. Public Health Nutr. 2009:13(9);1328-32.
11. Mathew AC, Das D, Sampath S, Vijayakumar M, Ramakrishnan N, Ravishankar SL. Prevalence and correlates of malnutrition among elderly in an urban area in Coimbatore. Indian J Public Health. 2016;60:112-17.
12. Majumder M, Saha I, Chaudhuri D. Assessment of Nutritional Risk in Community-Dwelling Older Adults (65 to 75 Years) in Kolkata, India, J Nutr Gerontol Geriatr. 2014;33(2):126-34.
13. Agarwalla R, Saikia AM, Baruah R. Assessment of the nutritional status of the elderly and its correlates. J Fam Community Med. 2015;22:39-43.
14. Shi R, Duan J, Deng Y, Tu Q, Cao Y, Zhang M, Zhu Q, Lu Y. Nutritional status of an elderly population in southwest China: a cross-sectional study based on comprehensive geriatric assessment. J Nutr Health Aging 2015;19(1):26-32.
15. Winter J, Flanagan D, Mcnaughton SA, Nowson C. Nutrition screening of older people in a community General practice, using the MNA-SF. J Nutr Health Aging. 2013;17(4):322-5.
16. Lin WQ, Wang HHX, Yuan LX, Li B, Jing MJ, Luo JL, et al. The unhealthy lifestyle factors associated with an increased risk of poor nutrition among the elderly population in China. J Nutr Health Aging. 2017;21(9):943-53.
17. Schueren M, Monasch SL, Vries OJ, Danner SA, Kramer MHH, Muller M. Prevalence and determinants for malnutrition in geriatric outpatients. Clinical Nutrition. 2013;32:1007-11. 18. Ghimire S, Baral BK, Callahan K. Nutritional
19. Gunduz E, Eskin F, Gunduz M, Bentli R, Zengin Y, Dursun R, Icer M, Durgun HM, Gurbuz H, Ekinci M, Yesil Y, Guloglub C. Malnutrition in Community-Dwelling Elderly in Turkey: A Multicenter, Cross-Sectional Study. Med Sci Monit. 2015;21:2750-6.
20. Krzyminska-Siemaszko R, Chudek J, Suwalska A, Lewandowicz M, Mossakowska M, Kroll-Balcerzak R, et al. Health status correlates of malnutrition in the polish elderly population-results of the Polsenior study. Eur Rev Med Pharma Sci. 2016;20:4565-73. 21. Mitri R, Boulos C, Adib SM. Determinants of the
nutritional status of older adults in urban Lebanon. Geriatr Gerontol Int. 2017;17:424-32.
22. Maseda A, Diego-Diez C, Lorenzo-Lopez L, Lopez-Lopez R, Regueiro-Folgueira L, Millan-Calenti JC. Quality of life, functional impairment and social factors as determinants of nutritional status in older adults: The VERISAÚDE study. Clin Nutr. 2017;37(3):993-9.
23. Chen CC, Chang CK, Chyun DA, McCorkle R. Dynamics of nutritional health in a community sample of American elders: a multidimensional approach using roy adaptation model. Adv Nurs Sci. 2005;28(4):376-89.
24. Han Y, Li S, Zheng Y. Predictors of nutritional status among community-dwelling older adults in Wuhan, China. Public Health Nutr 2009;12(8):1189-96.
25. Tsai AC, Chang TL, Yang TW, Chang-Lee SN, Tsay SF. A modified mini nutritional assessment without BMI predicts nutritional status of
community-living elderly in Taiwan. J Nutr Health Aging. 2010;14(3):183-9.
26. Kagansky N, Berner Y, Koren-Morag N, Perelman L, Knobler H, Levy S. Poor nutritional habits are predictors of poor outcome in very old hospitalized patients. Am J Clin Nutr. 2005;82(4):784-91. 27. Van der Pols-Vijlbrief R, Wijnhoven HA, Schaap
LA, Terwee CB, Visser M. Determinants of protein-energy malnutrition in community-dwelling older adults: a systematic review of observational studies. Ageing Res Rev. 2014;18:112-31.
28. Chavarro-Carvajal D, Reyes-Ortiz C, Samper-Ternent R, Arciniegas AJ, Gutierrez CC. Nutritional Assessment and Factors Associated to Malnutrition in Older Adults: A Cross-Sectional Study in Bogota, Colombia. J Aging Health. 2015;27(2):304-19. 29. Agarwal E, Miller M, Yaxley A, Isenring E.
Malnutrition in the elderly: A narrative review. Maturitas. 2013;76:296-302.
30. Nykanen I, Lonnroos E, Kautiainen H, Sulkava R, Hartikainen S. Nutritional screening in a population-based cohort of community-dwelling older people. Eur J Public Health. 2012;23(3):405-9.
31. Flodin L, Svensson S, Cederholm T. Body mass index as a predictor of 1 year mortality in geriatric patients. Clin Nutr. 2000;19:121-5.