http://www.ijcmph.com pISSN 2394-6032 | eISSN 2394-6040
Original Research Article
Green school audit of twenty two schools in Pune city
Varsha Vaidya*, Jayashree Gothankar, Prasad Pore, Reshma Patil, Sujata Murarkar
INTRODUCTION
Climate change is one of the most important global environmental challenges facing humanity with implications for food production, natural ecosystem, freshwater supply and health, along with many other factorsmaking it an issue of great priority to be addressed with immediate effect.1
Humankind's activities are altering the world's climate by increasing the atmospheric concentration of energy-trapping gases (greenhouse gases), thereby amplifying
the natural "greenhouse effect" that makes the Earth habitable.2
Addressing the urgent need to introduce meaningful environmental education at the school level in India, CSE’s Green Schools programme (GSP) goes beyond nature education to get children to evaluate and precisely measure their own environmental footprint using the Green Schools manual.3
The Green School audit is a tool designed to help school communities to audit their use of natural resources
ABSTRACT
Background: The Green school audit is a tool designed to help school communities to audit their use of natural resources. It provides schools with the methodology to become environmental managers by assessing themselves. Green school audit was part of green games initiatives of commonwealth youth games Pune 2008 with objective to carry out environmental audit of schools involving school children.
Methods: The programme was carried out from March 2008 to October 2008 as a part of Green Games initiative of Commonwealth Youth Games. Twenty two schools voluntarily participated in this programme. Four medical students per school and one teacher from the Department of Community Medicine were posted per school to train one school teacher and twenty five school children about the audit. Each school wasprovided with a Green school manual; a do it yourself (DIY) guide that helped students to assess the five key elements that comprises their school’s environment namely air, water, land, energy and waste.
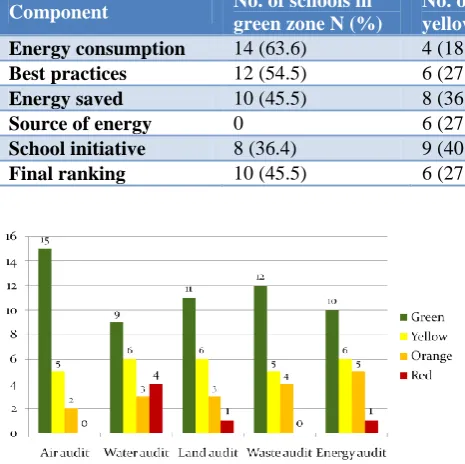
Results: 15 schools were in green zone for air audit, 9 schools were in green zone for water audit, 11 schools were in green zone for land audit, 13 schools were in green zone for waste audit and 10 schools were in green zone for energy audit.
Conclusions: This assessment helped each participating school to identify where it currently stood and where it should be with regard to the environmental standards prescribed in the manual. This is a learning programme for students helping them to develop environmentally conscious attitudes and ultimately a responsible behavior.
Keywords: Green school audit, School environment awareness programme
Department ofCommunity Medicine, Bharati Vidyapeeth Medical College, Pune, Maharashtra, India
Received: 20 November 2017
Revised: 21 December 2017
Accepted: 23 December 2017
*Correspondence:
Dr. Varsha Vaidya,
E-mail: [email protected]
Copyright: © the author(s), publisher and licensee Medip Academy. This is an open-access article distributed under the terms of the Creative Commons Attribution Non-Commercial License, which permits unrestricted non-commercial use, distribution, and reproduction in any medium, provided the original work is properly cited.
providing schools with the methodology to become environmental managers by assessing themselves.4
The environmental issues we face, both as individuals and within our broader society, are now so pervasive and ingrained within our cultural ways of being that we can no longer look to science and technology alone to solve these problems. As a consequence, environmental learning can and should include a sustained critique on dominant societal and industrial practices that often contribute to widespread and localized environmental problems.5
Under the GSP, schools across India carry out rigorous self-audit on environmental practices within their own premises, following a set of guidelines outlined in a manual published by CSE, titled How Green is my School? A do-it your-self manual. The schools use the manual in their environmental studies programmes and as an activity in the eco-clubs.6 It is within our potentiality to modify schools to prevail as healthy environments and to promote ecological sustainability in variable dimensions for students as well as staff. It would sculpt children to grow up into responsible adults by helping them realize that their actions as a whole can have repercussions that can affect mankind globally. Thus the objective was to carry out green school audit of twenty two schools of Pune city, involving school children.
METHODS
Green School audit was introduced as a part of environment awareness programme under green games
initiative of Commonwealth Youth Games Pune 2008. The programme was carried out from March 2008 to October 2008. Environment awareness programme with green school audit was conducted in 60 schools in Pune city, by the Department of Community Medicine and 22 schools volunteered to participate in the Green School Audit.
Training was imparted to one school teacher and twenty five school children about the audit by faculty members and medical students of Department of Community Medicine.
Each school was provided with a Green School manual; a do it yourself (DIY) guide.7
The audit was performed by students under the guidance of teachers, according to the manual and the results were shared with the rest of the school during school assembly.
Audit teams were assigned to each of the five components i.e. air, water, land, waste and energy. Each audit team comprised of five to ten students, one teacher, parent and one person from school maintenance, transport section or Gardener etc. as per the type of audit.
Faculty members from the Department of Community Medicine visited schools, confirmed the findings and collected the audit reports.
Individual audits were scored out of 100 and the total scare was out of 500.
Table 1: Criteria for air audit.
Task Maximum points Criteria for Maximum points
Audit team 5 Involving transport staff
Oxygen balance 10 Green area 12 sqm/person
School vehicles with PUC certificates 10 All vehicles with PUCs plus mileage
Commuting practices 30 Shared transport, walking, bicycle, school bus
Ventilation in rooms 15 A big window in each room
School’s initiatives 30 Involving students, awareness programs, written policy
Total 100
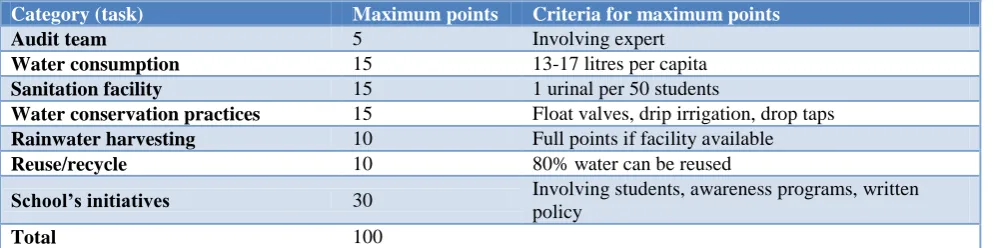
Table 2: Criteria for water audit.
Category (task) Maximum points Criteria for maximum points
Audit team 5 Involving expert
Water consumption 15 13-17 litres per capita
Sanitation facility 15 1 urinal per 50 students
Water conservation practices 15 Float valves, drip irrigation, drop taps
Rainwater harvesting 10 Full points if facility available
Reuse/recycle 10 80% water can be reused
School’s initiatives 30 Involving students, awareness programs, written policy
Table 3: Criteria for land audit.
Category Maximum points Criteria for maximum points
Formation of audit team 5 Involving expert
% of green area 20 33% of total area
Land use 10 3.40 sqm built-up per student
Biodiversity 20 Total number of plant species out of 100
Pesticide 10 Use of bio-pesticides or not using any
School’s initiatives 30 Awareness program involving students, written policies
Involvements of students in
maintenance of green area 5 Involving students
Total 100
Table 4: Criteria for waste audit.
Area Maximum points Criteria for maximum points
Audit team 5 Expert involvement
Total waste generated 10 150 gm/person/day
Collection of waste 10 Separate covered dustbins in each classroom
Recycling of waste 20 Plastic, paper, metal, scrap to be recycled completely
Reuse of waste 15 Use of blank pages of last year’s notebooks, second hand book stall, backside of paper
Disposal of biodegradable waste 10 Vermicomposting or bioculture
School initiatives 30 Awareness, policy
Total 100
Table 5: Criteria for energy audit.
Category Maximum points Criteria for maximum points
Energy consumption 30 40-46mJ/day/person
Best practices 10 CFL, switching off equipments, cleaning of
tube-lights and bulbs
Energy savings 20 Compared to last years’ bill
Source of energy 10 Non-conventional use, solar, bio-gas
School’s initiatives 30 Awareness program, written policy, involving students
Total 100
All schools were color coded as per performance.3
Green code was for marks between-70% to 100% Yellow code was for marks between-50% to 69% Orange code was for marks between-35% to 49% Red code was for marks between-0% to 34% Green School award was given to the first three schools.
RESULTS
Oxygen balance depends on the correlation of total green area of the school and the green area required to generate the required quantity of oxygen (Table 6).
School vehicles were ranked according to number and type of vehicle and contrast between existing mileage and passenger capacity with the same stated by manufacturer and their PUC certificates (Table 6).
Commuting practices included calculation of number of people travelling by school or public transport, carpooling and by bicycle or walking (Table 6).
Ventilation was determined by correlating the number of well ventilated rooms and the total number of rooms in the school (Table 6).
School’s initiative was appraised by conduction of awareness programs related to air and transport and implementation of transport management (Table 6).
Table 6: Air Audit of schools.
Component No. of schools in
green zone N (%)
No. of schools in yellow zone N (%)
No. of schools in orange zone N (%)
No. of schools in red zone N (%)
Oxygen balance 11 (50) 3 (13.6) 2 (9.1) 6 (27.3)
School vehicle 18 (81.8) 2 (9.1) 2 (9.1) 0
Commuting practices 13 (59.1) 7 (31.8) 1 (4.5) 1 (4.5)
Ventilation 14 (63.6) 5 (22.7) 3 (13.6) 0
School initiative 10 (45.5) 9 (40.9) 3 (13.6) 0
Final ranking 15 (68.2) 5 (22.7) 2 (9.1) 0
Table 7: Water audit of schools.
Component No. of schools in
green zone N (%)
No. of schools in yellow zone N (%)
No. of schools in orange zone N (%)
No. of schools in red zone N (%)
Water consumption 13 (59.1) 4 (18.2) 3 (13.6) 2 (9.1)
Sanitation facilities 12 (54.5) 5 (22.7) 3 (13.6) 2 (9.1)
Water conservation 11 (50) 8 (36.4) 3 (13.6) 0
Rainwater harvesting 4 (18.2) 3 (13.6) 1 (4.5) 14 (63.6)
Water reuse 3 (13.6) 1 (4.5) 0 18 (81.8)
School initiative 13 (59.1) 5 (22.7) 2 (9.1) 2 (9.1)
Final ranking 9 (40.9) 6 (27.3) 3 (13.6) 4 (18.2)
Table 8: Land audit of schools.
Component No. of schools in
green zone N (%)
No. of schools in yellow zone N (%)
No. of schools in orange zone N (%)
No. of schools in red zone N (%)
% Green area 11 (50.0) 3 (13.6) 2 (9.1) 6 (27.3)
Land use 5 (22.7) 10 (45.5) 3 (13.6) 4 (18.2)
Biodiversity 9 (40.9) 5 (22.7) 5 (22.7) 3 (13.6)
Pesticide use 14 (63.6) 4 (18.2) 2 (9.1) 2 (9.1)
School initiative 10 (45.5) 5 (22.7) 5 (22.7) 2 (9.1)
Final ranking 11 (50.0) 7 (31.8) 3 (13.6) 1 (4.5)
Table 9: Waste audit of schools.
Component No. of schools in
green zone N (%)
No. of schools in yellow zone N (%)
No. of schools in orange zone N (%)
No. of schools in red zone N (%)
Generation of Waste 15 (68.2) 5 (22.7) 2 (9.1) 0
Frequency of
Collection 14 (63.6) 5 (22.7) 2 (9.1) 1 (4.5)
Recycling 10 (45.5) 6 (27.3) 4 (18.2) 2 (9.1)
Reuse 18 (81.8) 3 (13.6) 1 (4.5) 0
Disposal 10 (45.5) 9 (40.9) 2 (9.1) 2 (9.1)
Final ranking 13 (59.1) 5 (22.7) 4 (18.2) 0
Sanitation facilities were estimated by checking the number of water closets, urinals, drinking water fountains and ablution taps per student (Table 7).
Water conservation in schools was checked by presence of means to prevent wastage of water like, plugging of leakages, cleaning of toilets, and installation of float valves, drop taps and fire exhaust fans in toilets (Table 7).
Rainwater harvesting was evaluated using the amount of rainwater that could be harvested by the school with the amount of rainwater actually being harvested (Table 7).
School’s initiative was estimated by conduction of awareness programs on issues related to water and presence of a policy on judicious use of water (Table 7).
Percentage of green area is comparison of total green area in square meters with 33% of total area in square meters. Green area includes areas that have grass cover, tree cover or horticulture (Table 8).
Land use includes the comparison of area per student available in the school with the area per student as per ISI standard within the built area and the playfield area (Table 8).
Biodiversity comprised of number of species of flora and fauna in the school area (Table 8).
Pesticide use within the school was calculated, keeping in view the avoidance of use of pesticides, use of bio pesticides, use of restricted pesticides, and use of combinations of pesticides. Points were awarded for discouraging pesticide use (Table 8).
School’s initiative was estimated by conduction of awareness programs related to land and biodiversity and implementation of land management schemes (Table 8).
Generation of waste was calculated by comparing ideal quantity of waste generation with waste generated per capita per day (Table 9).
Frequency of collection included checking of segregation of waste at source and during collection and the percentage of waste collection points (Table 9).
Recycling and reuse included determination of quantity of solid waste reused in comparison with total quantity of that type of waste (Table 9).
Disposal of waste was calculated by checking quantity of solid waste being disposed in sanitary landfill compared to the total quantity of that type of waste (Table 9).
Energy consumption was calculated by comparing ideal per capital energy consumption and the school’s per capita energy consumption taking electricity, transport and other means into consideration (Table 10).
Table 10: Energy audit of schools.
Component No. of schools in
green zone N (%)
No. of schools in yellow zone N (%)
No. of schools in orange zone N (%)
No. of schools in red zone N (%)
Energy consumption 14 (63.6) 4 (18.2) 2 (9.1) 2 (9.1)
Best practices 12 (54.5) 6 (27.3) 1 (4.5) 3 (13.6)
Energy saved 10 (45.5) 8 (36.4) 2 (9.1) 2 (9.1)
Source of energy 0 6 (27.3) 2 (9.1) 14 (63.6)
School initiative 8 (36.4) 9 (40.9) 3 (13.6) 2 (9.1)
Final ranking 10 (45.5) 6 (27.3) 5 (22.7) 1 (4.5)
Figure 1: Rating of school according to different audits.
Practices of energy conservation by the school were observed. These included presence of CFL tubes, sealing of refrigerators, maintaining a suitable temperature of air conditioners (AC), maintenance of AC filters, turning off of lights, fans, ACs, computer monitors etc, when not in use etc (Table 10).
Energy saved was derived by comparing the energy consumption data of two consecutive years, keeping in
view factors like change in strength of the school (Table 10).
Source of energy was estimated by assigning points for each type of source of energy consumed by the school (Table 10).
School’s initiative was appraised by conduction of awareness programs regarding energy consumption and conservation and implementation of initiatives (Table 10).
DISCUSSION
Air audit
schools had adequately ventilated rooms. In a similar audit conducted in a Gujarat, ventilation equipment and air filters were inspected regularly and replaced as needed and adequate amount of fresh air was supplied to classrooms. Use of eco-friendly paint, adhesive and other materials that reduces potential indoor air contaminants was promoted. A check was kept on smoke in areas adjacent to the cooking, preparation and eating areas.8
Water audit
The water audit indicates that fair methods have been employed in order to conserve water. Water consumption of schools was checked and compared with the ideal consumption in liters per capita/per day, for different types of schools and 59.1% schools had consumption within the ideal amount for that type of school. About 54.5% schools had adequate sanitation facilities and 50% schools used means to ensure conservation of water.
Generally, 80% of the total amount of water used is available as waste water, which may be recycled or reused.7
The rainwater harvesting was calculated and only 18.2% of the schools were found to have systems for rain water harvesting. 81.8% schools were found to have unsatisfactory implementation of water reuse. In an audit conducted in Punjab, rain water harvesting systems were installed in 73.68% schools and water recycling was in practice in 93.74% of the schools.9
Land audit
Results indicate that 50% schools were found to have sufficient green area while 27.3% schools lacked space that could be classified as green area.
On anticipating the area per student available in the school, 45.5% schools scored within 50%-69%, when checked with the same according to ISI standard within built-in and playfield areas.
Only 40.9% schools were found to have adequate diversity of flora and fauna in their campus.
When pesticide usage within the school was calculated, 63.6% of schools were found to be in the green category for discouraging use of pesticides of using bio-pesticides.
Strategically placed trees, the creation of food and habitat gardens, water conservation, and the elimination of pesticides, school grounds can be good places to study sustainability. Natural plantings of trees and shrubs can diminish air and noise pollution and assist in cooling classrooms.10
Waste audit
A waste audit helps determine the quantity and categories of waste generated in a particular environment. Present
study revealed that 68.2% schools followed protocol of segregation of waste at source and collection.
While assessing the collection of waste, 63.6% schools were found to have satisfactory frequency of collection, segregation of waste at source and during collection.
Only 45.5% schools were perceived to have directed suitable efforts towards recycling of waste, which is a significant way to conserve energy.
When assessed for the reuse of waste, 81.8% schools were in the green category.
About 45.5% schools carried out standard methods of disposing solid waste in sanitary landfills.
Energy audit
Total energy consumed by the school was calculated including, electricity from the board, fuel (petrol, diesel, CNG), LPG, solar, wind, among many others and the average energy consumption is ranged between 40.2-46.2, 43.8-49.8 and 18.6-24.6 for day schools, day boarding schools and residential schools respectively in MJ/day/person.7 63.6% schools were found to be in the green category.
About 54.5% schools were found to have been using means to implement conservation of energy and 45.5% schools were found to have saved energy when their consumption over consecutive years was compared.
Sources of energy were checked and 63.6% schools were found to be using a higher percentage of sources of energy that lead to more pollution and were thus placed in the red category. The Green School Audit was conducted in Krishna Public School, Chattisghar and resulted in implementation of measures to decrease energy conservation of the school while promoting awareness among students, teachers and other staff.11
CONCLUSION
All the children enthusiastically participated in the programme. This assessment helped each participating school to identify where it currently stood and where it should be with regard to the environmental standards prescribed in the manual. This is a learning programme for students helping them to develop environmentally conscious attitudes and ultimately a responsible behavior. All schools should be encouraged to continue doing yearly audit. Audit process will help participating schools to set targets and improve its environmental performance each year. This comparison and approach will move schools towards achieving sustainability.
ACKNOWLEDGEMENTS
conducting green school audits in various schools in Pune city as a part of green games initiative.
Funding: Commonwealth youth games and UNEP Conflict of interest: None declared
Ethical approval: Not required
REFERENCES
1. Thakur JS. Protecting health from climate change. Indian J Community Med. 2008;33:139-40.
2. Majra JP, Acharya D. Protecting health from climate change: Preparedness of medical interns. Indian J Community Med. 2009;34:317-20.
3. Available at: http://www.gobartimes.org/content/ what-green-schools-programme-ii. Accessed on 15 June 2015.
4. Available at: http://www.sustainableschools.ae/ gsa.aspx. Accessed on 20 June 2015.
5. Environmental Learning and Experience. An Interdisciplinary Guide For Teachers. Available at: https://www2.gov.bc.ca/assets/gov/education/kinder garten-to-grade-12/teach/teaching-tools/
environmental-learning/environ_learning_exper.pdf. Accessed on 20 June 2015.
6. Green laurels for Daramdin Sr. Sec. School, makes it to the Changemaker list of CSE Sikkim Express, 19, 2008. Available at www.sikkimforest.gov.in. Accessed on 10 June 2015.
7. How Green is my school - A do it yourself manual by Center for Science and Environment, India. 8. Green school audit done in B-Kanae school,
Modasa, Gujarat Available at: http://www.green- schoolsalliance.org/schoolprofile/b-kanae-school-modasa-gujarat. Accessed on 15 June 2015.
9. Jerath N, Ladhar SS, Deepali SS. Evaluation of environmental Status in Schools of Punjab, India Through conducting Self Environmental Audit. Evaluation of Environmental Ethiop J Educ Sc. 2012;7(2):83-96.
10. Sustainable Schools: Best Practices Guide. Published by Ministry of Education, 2010. Available at: http://www.bced.gov.bc.ca/green schools/sustbestpractice.htm. Accessed on 20 June 2015.
11. Green Audit of School. Krishna Public School, Raipur, Chattisgarh. Available on http://eindia.
eletsonline.com/2012/green-audit-of-school-krishna-public-school/ Accessed on 10 June 2015.