Original Research Article
Socioeconomic and health correlates disability in India
Radhe Shyam Mishra*, Sanjay K. Mohanty
INTRODUCTION
The international classification of functional disability and health (ICF) defines disability as an umbrella for impairments, activity limitations and participation restriction.1 The term disability involved complex interactions between individual and social environment.2 In the present perspective disability is a major developmental challenges and has been increasingly recognized by multiple stake holders; academia, international organization, national and state government and the civil society.3-6 Globally, about one billion people (15% of world population) are living with some form of disability of which about 100 million are under 15 years.1 Moreover, disability had shown increasing trend over time and across countries. Increase in disability is
associated with demographic transition and
epidemiological transition across and among countries. Demographic transition leading to increase in share of older population those are more prone to disability. Epidemiological transition leading to increase of non-communicable diseases (NCDs) such as diabetes, cardiovascular disease, cancer and mental health disorder are also increasing the risk of disability. About two-third of life years lived with disability in low and middle income countries are attributed to chronic diseases.6
People with disability suffers from long term physical,
mental, intellectual and sensory impairment
systematically excluded from development agenda.7,8 People with disability tend to have poorer health, lower educational attainments, lower work participation, restrict the range of tasks and lives with higher incidence of
ABSTRACT
Background: Disabled people suffered from multiple deprivations; poor health, low educational attainment, lower work participation and higher incidence of poverty. With demographic and epidemiological transition, the prevalence of disability also increases. This paper examines the socio economic and health correlates of disability in India.
Methods: The unit data from District Level Household Survey (DLHS 4), is used in the analysis. Seven type of disability; namely, mental, visual, hearing, speech, locomotor, multiple, and any disability are analysed. Bi-variate and logistic regression analysis has been used to examine the association between disability and its socioeconomic, health covariates.
Results: Prevalence of any disability was 2800 per 100,000 population in India. Prevalence of disability in non-empowered action group (EAG) states was highest for visual (800) followed by locomotor, hearing and mental. Age gradient of disability is quite strong; about 1140 person had any disability by age 10 compared to 3290 by age 40 years. Economic differentials in disability is large. Prevalence of any disability was 3680 among poorest wealth quintile compared to 2540 among richest.
Conclusions: Disability was significantly higher in poor, less educated and older adults.
Keywords: Disability, Socioeconomic, Type of disability, Chronic diseases International Institute for Population Sciences (IIPS), Mumbai, India
Received: 13 November 2017
Accepted: 14 December 2017
Accepted: 16 December 2017
*Correspondence:
Dr. Radhe Shyam Mishra,
E-mail: [email protected]
Copyright: © the author(s), publisher and licensee Medip Academy. This is an open-access article distributed under the terms of the Creative Commons Attribution Non-Commercial License, which permits unrestricted non-commercial use, distribution, and reproduction in any medium, provided the original work is properly cited.
poverty.9-11 Disability leads to increase dependency and health spending at households.1,10
Indian scenario
India is the second most populous country of the world with 1.21 billion population having about 22 million disabled people.12 Total fertility rate (TFR) was 2.3 with large variation across the states.13 Prevalence of disability is increasing in India across states and over time. It was highest in state of Tamil Nadu followed by Haryana.12 The growth rate of elderly population was about twice than overall population. On other hand, non-communicable diseases (NCDs) are leading cause of death and morbidity.14 Limited health care facilities, lower coverage of social security system and low capacity to pay for health services is leading to increase disabled. The census of India provide seven type of disability; namely Seeing, Hearing, Speech, Movements, Mental retardation, Mental Illness any other, and one category Multiple disability. It counts only extreme form of disability. Recently, the district level household survey (DLHS-4) collected information on the disability from 21 states and 275 districts of India. The definition used in various census and surveys within country are not strictly comparable but it represent the broader picture of disability. However, the definition used in census of India 2011 and DLHS-4 are of broadly similar.
Review of literature
Most of studies on disability are from developed countries and addressed varying dimension of disability.15 People in older age suffer from multiple disabilities and it increases with decreasing socio economic status.16,17 Pattern holds true for each type of disability and an increasing function of age. Studies on disability are often linked to poverty, discrimination, health, health care utilization and work participation. Studies linking disability and poverty are numerous.9,15,18,19 Causation of poverty and disability is bidirectional and the pathways of poverty and disability has been discussed elsewhere.20,21
Disability is significantly associated with higher multidimensional poverty, lower educational attainment, lower employment rates and higher medical expenditure in developing countries.22 While there are multiple factors contributing to the poverty among people with disabilities, poor and unequal access to education or employment and the unequal distribution of resources are likely to be a the main causes of poverty.23 Disable people are faces discrimination at labour market and wage discriminiation.24-28 Attitudes toward disabled people are deeply rooted in the social and cultural values of society.29 Disability is often what we perceive; and in the mind of the perceiver. 28
Elimination of chronic diseases from the elderly population could lead to a compression of morbidity in elderly disable.30 Studies linked child disability with
nutrition and cognitive development in low and middle income countries. The burden of neurological impairment was higher in rural areas and neonatal were identified as high risk factors.31 Hearing and intellectual disabilities are most commonly studies. Impairment in cognitive and hearing are significantly associated with increasing age, predominantly age 75 years and above. In developing countries there is an evidence that malnutrition lead to the disability.32 Studies show that, in the recent year socioeconomic inequalities and disability prevalence have increasingly been considered as correlate.19,21,33
Need of the study
The study has been conceptualized with the following rationale. First, disability is the vital issues and poses challenges to the state of development. Disabled are the most vulnerable group and had higher incidence of poverty, ill health, illiteracy and unemployment. In addition they suffers from societal prejudices, discrimination with respect to health care, employment and other public facilities. Though prevalence of disability is higher in developing countries and increasing over time, there are limited number of studies that addressed the dimensions and structure of disability in India. Evidences also suggest increasing in various form of disability in India and the spatial form of disability in India is large.12,34 Second, in India, there are a few studies that addressed the socio-economic and demographic correlates of disability.9 Poverty may increase the risk of disability through several pathway, many of which are related to poor health and its determinants. Chronic ailments and their effects on working capacity provide a problem for our society which may be considered in terms of economics, sociology, medicine, or personal suffering, but none alone can give a full picture. Disability is affecting more to the poor and less educated who have least capacity to pay for health care.16 Third, India is on advanced stage of demographic and epidemiological transition that might be leading to increase in disability across age groups. In this context, this paper examines the socio-economic and demographic correlates of disability in India.
Data
The unit data of District Level Household Survey (DLHS-4) used in the analyses. The survey was conducted in 2012-13 by International Institute for Population Sciences (IIPS), Mumbai with financial support and overall guidance from Ministry of Health and Family Welfare, Govt of India in non-empowered action group (NEAG) states of India (The NEAG states are
Arunachal Pradesh, Sikkim, Haryana, Manipur,
mortality, the NEAG states are demographically better off states of India. Many of the NEAG states has long achieved the replacement level of fertility. The NEAG states covered under DLHS 4 includes 17 states and 4 union territories. The survey was not completed in Gujarat, Jammu and Kashmir, Delhi, Dadar and Nagar Haveli, Daman and Diu and Lakshadweep due to unavoidable circumstances. The main objective of this survey was to provide demographic and health indicators for those states/districts for which the AHS was not conducted. The advantages of using this data is large sample size and most recent in nature. Besides, it provides comprehensive information on demographic, social and health of individuals and used household schedule, woman schedule, men’s schedule and village schedule. The finding of this survey and the unit data for 21 states and union territories is publicly available (www. rchiips.org/DLHS-4.html). The DLHS 4 has successfully completed 378487 households and1687736 individual in country. We have used household schedule that provides detailed information on age, sex, educational level, work status, chronic illness, acute illness and any form of disability for each member of the household. Information on disability was collected on the date of survey on eight categories namely, mental, visual, hearing, speech, locomoto, multiple, others and any disability.
METHODS
The analyses are presented for 21 state of India among these four selected states of India; Haryana, Tamil Nadu, West Bengal and Maharashtra. The states are selected to reflect diverse socio-economic and demographic situation. The state of Maharashtra, located in western parts of India, is economically developed states while state of Tamil Nadu, southern state of India is in advanced stage of demographic transition and socially developed. State of West Bengal is located in eastern India and economically less developed state of India. The
state of Haryana is one of the northern state of India with better economic condition. All these states have either reached low fertility level or nearing to replacement level of fertility and reflect regional diversity in India. Along with these states, estimates of all NEAG states are also provided. We have used the sub-sample of adults (18+) and disability estimates (per 100,000 population) are provided by key socio-economic characteristics; sex, educational level and wealth quintile and presence of chronic diseases. Descriptive statistics and logistic regression is used to understand differentials and significant predictors of disability. A wealth index is computed using 42 variables for rural areas and 37 for urban areas using principal component analyses (PCA). The wealth index is categorised into quintiles and used. A set of logistic regression models are used to understand the significant predictors of type of disability. For regression analyses, four type of disability, namely, any disability, mental disability, visual disability and locomotive disability based on prevalence are used. The outcome in logistic regression analysis is coded as 0 or 1, where 1 indicates that the presence of specific form of disability and 0 otherwise. The socio economic variables used are age, sex, wealth quintile, educational level, caste, religion and presence/absence of chronic diseases.
RESULTS
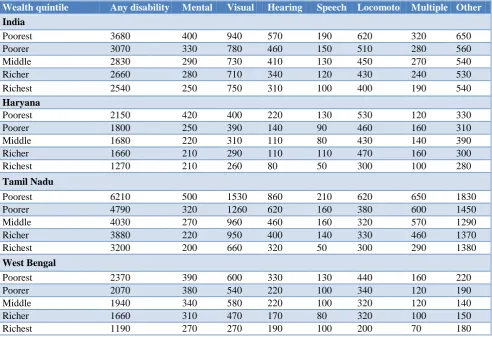
Table 1 presents basic households characteristics of India and four of its states. The median age of India was 28 years; 31 years in Tamil Nadu and 26 years in Haryana. About 29% population in India were under age 18 years, 62% were in 18-64 years and 7% were aged 65 more. The ranking of wealth distribution varies across the states of India. A higher proportion of population in poorest quintile were from West Bengal followed by Maharashtra and Tamil Nadu. The extent of disability was 2.2% in India, 4.5% in Tamil Nadu, 2.1% in West Bengal, 1.8% in Maharashtra and 1.5% in Haryana.
Table 1: Basic characteristics of sample population in India, 2014.
India Haryana Tamil Nadu West Bengal Maharashtra
No. of households surveys 1687736 166334 116281 116281 253123
Sex ratio 988 889 1074 993 957
Percent urban 39.5 40.3 46.1 48.1 44.5
Educational attainment (mean years) 2.6 2.7 2.7 2.4 2.7
Age distribution (%)
Lt 18 30 32.6 27.5 29.9 30.6
18-64 63 61.1 64.7 63.7 61.3
65+ 6.8 6.2 7.7 6.3 8
Median age 28 26 31 28 28
Wealth quintile
Poorest 20 7.8 22 37 22.7
Poorer 20 11.2 23.9 22 20.1
Middle 20 14.7 23.1 18.9 20.5
Richer 20 21.4 20.7 15.8 21.3
Richest 19.9 44.7 10 6.08 15.2
Table 2: Type of disability (per 100,000 population) in selected states of India (18+), 2014.
State Any disability Mental Visual Hearing Speech Locomoto Multiple Others
Arunachal Pradesh 1270 130 240 290 110 250 100 150
Sikkim 1350 120 250 350 250 100 190 90
Haryana 1570 230 310 110 80 400 130 310
Manipur 1720 460 360 330 110 170 60 240
Maharashtra 1860 280 380 230 110 400 160 310
Meghalaya 1910 170 370 250 50 80 60 940
Kerala 2120 430 460 210 120 360 100 450
Mizoram 2130 370 510 560 130 240 90 230
West Bengal 2130 370 590 350 140 370 130 180
Goa 2150 240 250 250 80 370 240 710
Tripura 2490 220 350 560 170 630 160 400
India 2800 320 800 420 140 490 260 560
Karnataka 3100 300 600 410 170 820 400 400
Nagaland 3410 110 1060 1360 140 90 380 270
Pondicherry 3430 320 830 420 210 570 210 870
Andaman Nicobar 3520 330 1530 760 90 240 250 330
Himachal Pradesh 4110 240 850 1020 180 300 720 790
Telangana 4400 490 1690 570 170 630 170 670
Tamil Nadu 4550 320 1120 550 160 400 550 1460
Punjab 4660 440 1510 560 160 870 260 860
Andhra Pradesh 5490 450 2290 660 190 660 370 870
Chandigarh 5940 270 3010 480 170 150 180 1670
Table 3: Type of disability by wealth quintile among adults (18+) in selected state of India, 2014.
Wealth quintile Any disability Mental Visual Hearing Speech Locomoto Multiple Other
India
Poorest 3680 400 940 570 190 620 320 650
Poorer 3070 330 780 460 150 510 280 560
Middle 2830 290 730 410 130 450 270 540
Richer 2660 280 710 340 120 430 240 530
Richest 2540 250 750 310 100 400 190 540
Haryana
Poorest 2150 420 400 220 130 530 120 330
Poorer 1800 250 390 140 90 460 160 310
Middle 1680 220 310 110 80 430 140 390
Richer 1660 210 290 110 110 470 160 300
Richest 1270 210 260 80 50 300 100 280
Tamil Nadu
Poorest 6210 500 1530 860 210 620 650 1830
Poorer 4790 320 1260 620 160 380 600 1450
Middle 4030 270 960 460 160 320 570 1290
Richer 3880 220 950 400 140 330 460 1370
Richest 3200 200 660 320 50 300 290 1380
West Bengal
Poorest 2370 390 600 330 130 440 160 220
Poorer 2070 380 540 220 100 340 120 190
Middle 1940 340 580 220 100 320 120 140
Richer 1660 310 470 170 80 320 100 150
Wealth quintile Any disability Mental Visual Hearing Speech Locomoto Multiple Other
Maharashtra
Poorest 2520 340 560 380 190 530 210 420
Poorer 1870 310 370 360 140 460 140 290
Middle 1850 270 380 310 130 430 160 330
Richer 1520 240 310 230 90 470 130 260
Richest 1350 190 240 160 40 300 140 230
Table 4: Type of disability by educational level and chronic disease among adults (18+) in selected state of India, 2014.
Education Any disability Mental Visual Hearing Speech Locomoto Multiple Other
India
Less than primary 3740 490 980 560 240 520 310 630
5-8 2740 260 710 360 110 460 240 600
9-10 2300 210 570 260 80 450 170 560
11-15 1590 140 450 130 40 340 110 390
16+ 1600 100 530 120 20 270 110 450
Chronic diseases
No chronic 2670 300 680 380 130 430 230 510
Any chronic 6700 470 2100 930 180 1170 600 1250
Haryana
Less than primary 1670 420 200 110 150 260 250 290
5-8 1490 170 260 90 60 460 120 330
9-10 1430 150 280 90 50 450 70 340
11-15 960 80 230 40 20 310 40 240
16+ 830 80 180 30 0 180 70 280
Chronic disease
No chronic 1410 220 270 90 70 340 120 290
Any chronic 2540 280 530 240 120 740 190 460
Tamil Nadu
Less than primary 6450 450 1410 770 270 510 770 2270
5-8 4700 310 1030 530 170 450 610 1600
9-10 3720 250 800 370 120 330 430 1410
11-15 2250 160 540 180 30 250 280 810
16+ 2640 140 650 180 50 300 240 1080
Chronic disease
No chronic 4300 310 1060 530 150 380 490 1370
Any chronic 12800 420 3030 1600 250 960 2150 4390
West Bengal
Less than primary 2450 490 540 450 230 370 170 200
5-8 1900 320 570 280 100 360 90 170
9-10 1360 230 360 190 50 310 50 170
11-15 1070 200 260 80 60 270 40 170
16+ 1040 120 350 190 0 190 80 120
Chronic disease
No chronic 1740 340 430 260 140 300 110 360
Any chronic 4580 550 1420 900 120 890 320 380
Maharashtra
Less than primary 2690 480 500 350 230 480 240 420
5-8 1640 250 370 210 90 340 110 280
9-10 1490 160 290 150 60 390 100 340
11-15 1170 130 220 100 50 310 80 280
16+ 910 80 210 100 10 160 90 260
Chronic disease
No chronic 1720 270 360 210 100 350 150 1300
Table 5 (a): Odds ratio of any disability and mental disability in selected state of India, 2014.
Variable Haryana Tamil Nadu
West
Bengal Maharashtra Haryana
Tamil Nadu
West
Bengal Maharashtra
Residence Any disability Mental disability
Rural®
Urban 0.44*** 0.70*** 0.71*** 0.80*** 0.85 0.874 0.84 0.85
Sex
Male®
Female 1.04*** 0.87*** 0.88 0.74*** 0.78 0.784 1.01* 0.86
Age group 18-30®
31-40 0.18*** 2.22*** 2.02*** 1.98*** 2.52*** 5.213*** 3.32*** 5.87***
41-50 0.22*** 3.11*** 2.92*** 2.18*** 3.04*** 5.148*** 2.70*** 5.51***
51-60 0.26*** 4.57*** 3.10*** 2.98*** 2.10* 3.196*** 3.03*** 7.34***
61-70 0.47*** 6.71*** 4.84*** 4.05*** 3.76*** 2.733*** 3.21*** 5.28***
71+ 0.81*** 9.71*** 6.45*** 7.55*** 2.78 3.524*** 3.89*** 4.45***
Education
Less than primary®
5-8 0.07 0.80*** 0.86 0.74*** 0.43*** 0.765*** 0.69** 0.56***
9-10 0.07 0.75*** 0.61*** 0.73*** 0.35*** 0.665*** 0.52*** 0.39***
11-15 0.06*** 0.58*** 0.51*** 0.62*** 0.23*** 0.425*** 0.43*** 0.33***
16+ 0.10** 0.69*** 0.52* 0.52*** 0.20*** 0.360** 0.10*** 0.20***
Wealth quintile
Poorest®
Poorer 0.11 0.82*** 0.97 0.76*** 0.63 0.610*** 1.30 1.09
Middle 0.09 0.66*** 0.90 0.76*** 0.48** 0.556*** 1.13 1.15
Richer 0.09 0.60*** 0.75 0.62*** 0.60* 0.511*** 1.03 0.90
Richest 0.07*** 0.46*** 0.54*** 0.50*** 0.58** 0.510*** 0.72 0.76
Marital status
Never married® Currently
married 0.06*** 0.72 0.49*** 0.48 0.38*** 0.183*** 0.29*** 0.12***
Others 0.11 0.91 0.55*** 0.56 0.39* 0.430*** 0.48** 0.22***
Caste
SC®
ST 0.16*** 0.91 0.81 0.86 2.14** 0.736 0.88 2.17***
OBC 0.07 0.97 1.41*** 0.87* 1.17 0.905 1.18 1.42*
Other 0.07 1.29 1.15 0.89 1.10 1.556 1.48** 1.38
Religion
Hindu®
Muslim 0.13 0.90 0.89 0.89 0.66 1.540* 1.01 0.72
Christian 0.94 1.14 0.77 1.41 0.608 0.94 1.03
Others 0.17 1.92 0.67 1.01 2.11** 1.39 1.12
Chronic disease
No chronic®
Any chronic 1.02*** 1.90 1.86*** 1.87*** 1.19 2.147*** 1.90*** 1.56**
Note:®: Reference Category; Level of Significance: *** p<0.01; ** p<0.05; *p<0.1.
Table 5(b): Odds ratio of visual and locomotors disability in selected state of India, 2014.
Variable Haryana Tamil Nadu
West
Bengal Maharashtra Haryana
Tamil Nadu
West
Bengal Maharashtra
Residence Visual disability Locomotors disability
Rural®
Urban 0.84 0.66*** 0.51*** 0.75** 0.88 0.61*** 0.58*** 0.79*
Sex
Male®
Variable Haryana Tamil Nadu
West
Bengal Maharashtra Haryana
Tamil Nadu
West
Bengal Maharashtra
Visual disability Visual disability
Age group
18-30®
31-40 1.68** 1.65*** 1.98*** 1.15 4.53*** 1.79** 1.50 2.27***
41-50 2.80*** 2.59*** 3.60*** 1.97*** 3.95** 3.49*** 2.28*** 2.69***
51-60 3.09*** 4.71*** 3.70*** 2.96*** 7.99*** 4.52*** 2.80*** 3.89***
61-70 5.77*** 7.04*** 5.75*** 2.62*** 21.91*** 11.65*** 5.20*** 11.63***
71+ 5.26*** 10.53*** 6.64*** 5.94*** 92.39*** 24.47*** 9.95*** 32.27***
Education
Less than primary®
5-8 1.35 0.87* 1.10 0.94 0.74 0.86 0.78 0.94
9-10 1.44 0.84* 0.66** 0.81 0.78 0.82 0.49*** 0.73*
11-15 1.47 0.79** 0.58** 0.71** 0.54 0.61** 0.27*** 0.58**
16+ 1.18 1.02 1.02 0.84 0.41 0.70 0.61 0.58
Wealth quintile
Poorest®
Poorer 1.02 0.85* 1.02 0.70** 0.54 0.86 1.04 0.58***
Middle 0.84 0.68*** 1.11 0.75** 0.32** 0.61*** 0.93 0.62***
Richer 0.87 0.59*** 0.91 0.62*** 0.24*** 0.49*** 0.73 0.58***
Richest 0.78 0.38*** 0.41** 0.43*** 0.18*** 0.32*** 0.52 0.49***
Marital status
Never married®
Currently-married 0.47*** 1.01 0.92 0.73* 0.34** 1.33 1.00 0.49***
Others 0.34** 1.42** 0.63 1.01 0.11*** 1.57* 1.07 0.63
Caste
SC®
ST 2.39*** 0.86 0.45** 0.67** 2.04 0.64* 1.03 1.04
OBC 0.85 0.96 1.46** 0.74** 0.94 0.88 1.50* 1.00
Other 0.89 0.94 1.41** 0.70** 1.05*** 0.71 1.11 0.91
Religion
Hindu®
Muslim 0.97 0.73* 0.98 0.99 0.51 0.74 0.76 0.75
Christian 0.85 1.02 1.24 0.79 0.41 0.99 0.84 0.91
Others 0.71 0.88 1.05 0.76 3.74*** 0.82 0.56 1.20
Chronic disease
No chronic®
Any chronic 1.36 1.42*** 1.66*** 1.56*** 1.59* 1.33* 1.81*** 1.37*
Note:®: Reference category; Level of significance: *** p< 0.01; ** p< 0.05; *p< 0.1.
Table 2 present seven type of disability (per 100,000 population) namely, mental, visual, hearing, speech, locomotive along with multiple disability, any disability and other disability in 21 states and union territories of India. The states are arranged in ascending order of any disability. The prevalence of disability varies largely across states of India. Among the states, any disability was highest in Chandigarh (5940) followed by Andhra Pradesh (5490), Punjab (4650) and Tamil Nadu (4550) and lowest in states of Arunachal Pradesh (1270) followed by Sikkim (1350) and Haryana (1570). It appears that those states with lower fertility and higher proportion of elderly population (barring the state of Kerala) had higher prevalence of any disability. Among
highest prevalence was in state of Nagaland followed by Himachal Pradesh. Results suggests that the pattern of type of disability varies across states of India to a larger extent.
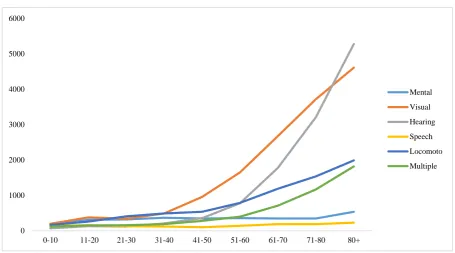
Disability is associated with age; with increase in age the chance of disability increases. The rate of increases of disability also varies by type of disability. Figure 1 presents that Age pattern of each of disability is quite distinct. Each of disability barring speech had a strong age gradient. Age gradient is strongest in visual followed
by hearing and locomotive disability. Increase in disability with age is modest till age 40 after which it increases faster. The most prominent disability across age group is visual disability that increases from 490 and in age group 31-40 to 4610 by age group 80 and above. In case of hearing also disability increase from 360 in 31-40 age group to 5280 by age 80 above. The locomotive and multiple disability also increases with age. Among these six type of disability, disability in speech is relatively stable over age.
Figure 1: Age pattern of type of disability (per 100,000 populations) in India, 2014.
State level differential
Table 3 presents type of disability by wealth quintile in selected states of India. In India, any disability among the poorest wealth quintile was 3680, 3070 among poorer, and 2540 among richest wealth quintile. Pattern holds true for each of specific disability including multiple disability. For example, In case of mental disability, prevalence varies from 400 among poorest wealth quintile to 250 among the richest wealth quintile while in case of locomotive disability it varies from 620 among poorest wealth quintile to 400 among the richest wealth quintile. State pattern in economic differential of disability is similar to national pattern. In case of West Bengal, any disability varies from 2520 among the poorest wealth quintile to 1350 among the richest wealth quintile. In Tamil Nadu, Prevalence of any disability was about 6210 among those belong from the poorest wealth quintile while it was 3200 among the richest wealth quintile. Visual disability was of higher in Maharashtra compared to other three states. Disability was highest among the poorest and lowest among the richest wealth
quintile in all four states suggesting that economic gradient in disability is robust in India.
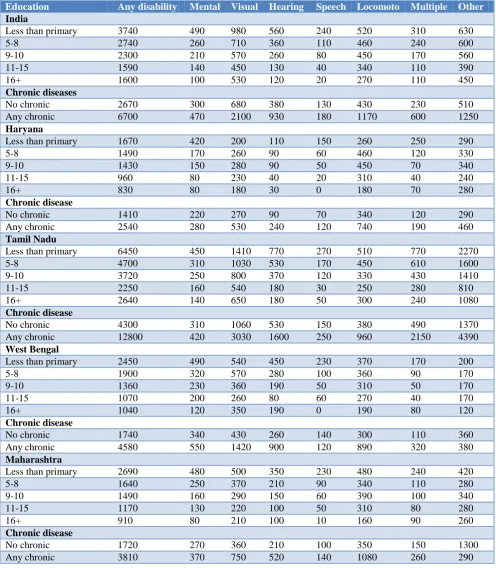
Table 4 presents type of disability by educational attainment and chronic diseases in four selected states and a combined estimates for NEAG states. In general, disability is negatively associated with educational attainment (year of schooling) irrespective of place of residence. The prevalence of any disability in India was 3740 among those with less than primary schooling, 2740 among those with 5-8 years of schooling, 2300 among those with 9-15 years of schooling and 1590 among those with 16 years and above schooling. This pattern in disability holds true for each type of disability and each of state suggesting that educational gradient of disability is robust. In case of Tamil Nadu, any form of disability varies from 6450 among illiterate to 2640 among those who completed 16 years and more of schooling. This holds true for each type of disability across the states. In West Bengal, differentials in any disability was of lower order by educational group. Disability is positively associated with chronic diseases; 6700 among who had a
0 1000 2000 3000 4000 5000 6000
0-10 11-20 21-30 31-40 41-50 51-60 61-70 71-80 80+
Mental
Visual
Hearing
Speech
Locomoto
chronic disease and 2670 among those who did not had any chronic disease in India. The pattern is similar in states of India.
Predictors of disability
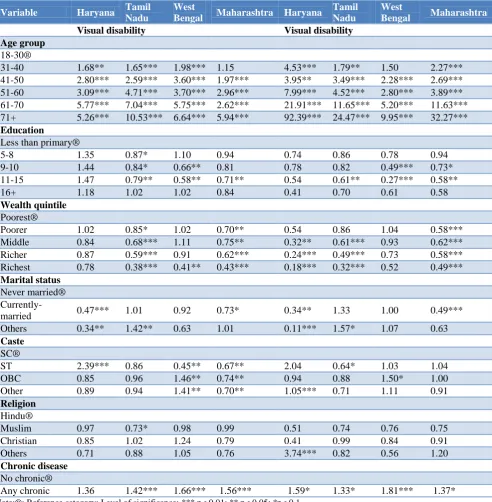
Table 5 (a-b) present results of logistic regression analyses of any disability, mental disability, locomotive disability and visual disability for states of Haryana, Tamil Nadu, West Bengal and Maharashtra. The dependent variable is dichotomous (type of disability) and independent variables are a set of socio-economic and demographic factors. Adjusted odds ratio with significance level for each type of disability are presented. Table 5 (a) presents results of any and mental disability. In case of any disability, age and place of residence are significant predictors in all selected states. Urban residence people are less likely to be disables compared to rural. For example, in Tamil Nadu, urban residents are 30% less likely to be disabled compared to rural residents. Age gradient of disability is strong cutting across states. Odds ratio of being disable in 71 above age group is 9.7 times compared to 18-30 age group in Tamil Nadu, 6.5 times in West Bengal and 7.6 times in Maharashtra. Education gradient of disability is strong across states. For example, in Maharashtra, Odds of disability among those with 16 years and above schooling was about 50% lower than those of illiterate. The pattern is also similar in other states. Wealth gradient of disability is significant in state of Tamil Nadu and Maharashtra but not in West Bengal. Odds ratio of disability among those who had chronic disease is 86% more in Tamil Nadu and 87% more in Maharashtra. The pattern is similar with respect to mental disability, visual and locomotive disability.
DISCUSSION
Disability is multifaceted; associated with poverty, ill health, and lower cognitive development and cultural taboos. Though disability is a priority research agenda, there are limited studies on dimension, structure and correlates of disability owning to data constraints and lack of programmatic attention.35,36 Demographic an epidemiological transition along with low level of development call for urgent attention on understanding the socio-economic and demographic correlates of disability. Using micro data from DLHS-4, this study examines the socio economic and health correlates to disability with different type of disabilities in India.
The followings are salient findings of paper. First, disability rate varies largely across states by socio-economic and demographic characteristics. State differential in disability suggest that Tamil Nadu had higher prevalence rate of disability ailments. Economic gradient of disability is strong cutting across states. Prevalence of disability was higher among the poorest and least among the richest across states. Second, education gradient of disability is also strong. Less
educated are more likely to be disabled cutting across states. Third, age gradient of disability is most prominent. In all selected states, age is positively and significantly associated with each type of disability. This further confirms that demographic transition lead top increase in disability in the population. Disability is also positively and significantly associated with chronic diseases.35,37 Fourth, rural population are more likely to be disabled than urban population in each type of disability cutting across states. Overall, the findings of this study are consistent with existing literature.
CONCLUSION
The higher prevalence of disability among older adults may be the combined effect of population ageing and disability. Besides, disability at birth, the rate of disability increases with certain diseases and accident. Older adults, particularly, elderly are more prone to chronic diseases that might be leading to disability. Education, and economic gradient of disability are strong and most prominent. Disease related disability could be lessened if medical care is taken at time. Hence, disability is an important issue for policy making from socio economic and demographic point of view and not just only medical point. The policies that promote access to education and employment may be particularly important for the well-being of persons with disabilities (PWD) in the Indian context. Therefore, providing access to basic capabilities to persons with impairment might be a way to reduce the challenges for disable people in India.
Funding: No funding sources Conflict of interest: None declared Ethical approval: Not required
REFERENCES
1. World Health Organization. International
Classification of Functioning, Disability and Health: ICF. World Health Organization, 2001.
2. Topliss E. Provision for the Disabled (2nd), 1979. 3. Stone E, Priestley M. Parasites, pawns and partners:
disability research and the role of non-disabled researchers. Br J Sociol. 1996;47(4):699-716. 4. Tomlinson M, Swartz L, Officer A, Chan KY,
Rudan I, Saxena S. Research priorities for health of people with disabilities: an expert opinion exercise. The Lancet. 2009;374(9704):1857-62.
5. United Nations Development Programme (UNDP). Humanity Divided: Confronting Inequality in Developing Countries. Bureau for Development Policy 2013.
6. WHO. World Report on Disability.
WHO/NMH/VIP/(2011)11.01.
8. Yeo R, Moore K. Including disabled people in poverty reduction work:“Nothing about us, without us”. World Development. 2003;31(3):571-90. 9. Appunni SS, Deshpande AP. Work Participation
among Disabilities in India. Journal of Social Sciences. 2009;21(2):117-22.
10. Gannon B, Nolan B. Disability and labour force participation in Ireland. 2004;35(2):135-55.
11. Meyer B, Mok WK. Disability, earnings, income and consumption. National Bureau of Economic Research; 2009.
12. Census of India. Data on Disability. Office of the Registrar General & Census Commissioner, New Delhi, 2011. Available at http://www.disability affairs.gov.in/upload/uploadfiles/files/disabilityinind ia2011data.pdf. Accessed on 3 August 2017. 13. RGI. Office of the Registrar General. Available on
http://www.censusindia.gov.in/vital_statistics/.html. Accessed on 3 August 2017.
14. Office of the Registrar Genral. Report on causes of death in India 2001-03, Ministry of home affairs, New Delhi, 2003. Available on http://www.cghr. org/wordpress/wp-content/uploads/Causes_of_ death_2001-03.pdf. Accessed on 10 October 2017. 15. Lamichhane K, Kartika D, Ballabha D. Analysis of
Poverty between People with and without Disabilities in Nepal. JICA Research Institute. 2014.
16. Gannon B, Munley M. Age and disability:
Explaining the wage differential. Social Sci Med. 2009;69(1):47-55.
17. Coppin AK, Ferrucci L, Lauretani F, Phillips C, Chang M, Bandinelli S, Guralnik JM. Low socioeconomic status and disability in old age: evidence from the InChianti study for the mediating role of physiological impairments. J Gerontology Series A: Biological Sci Med Sci. 2006;61(1):86-91. 18. United Nations Development Programme (UNDP). Humanity Divided: Confronting Inequality in Developing Countries. Bureau for Development Policy, 2013.
19. Braithwaite J, Mont D. Disability and poverty: a survey of World Bank poverty assessments and
implications. ALTER- Eur J Disability
Research/Revue Européenne de Recherche sur le Handicap. 2009;3(3):219-32.
20. Mitra S, Posarac A, Vick B. Disability and poverty in developing countries: a multidimensional study. World Development. 2013;41:1-8.
21. Yeo R, Moore K. Including disabled people in poverty reduction work: “Nothing about us, without us”. World Development. 2003;31(3):571-90. 22. Mitra S, Sambamoorthi U. Employment of persons
with disabilities: evidence from the National Sample Survey. Economic and Political Weekly. 2006: 199-203.
23. Barnes C, Sheldon A. Disability, politics and poverty in a majority world context. Disability Society. 2010;25(7):771-82.
24. Acemoglu D, Angrist JD. Consequences of
employment protection? The case of the Americans with Disabilities Act. Journal of Political Economy. 2001;109(5):915-57.
25. Barnes C, Mercer G. Disability culture. Handbook of disability studies. 2001:515-34.
26. DeLeire T. Changes in wage discrimination against people with disabilities: 1984-93. J Human Resources. 2001: 144-158.
27. Miles M. Disability in South Asia-millennium to millennium. J Religion Disability Health. 2002;6(2-3):109-15.
28. Wright BA. Physical disability-A psychosocial approach. HarperCollins Publishers; 1983.
29. Coppin AK, Ferrucci L, Lauretani F, Phillips C, Chang M, Bandinelli S, Guralnik JM. Low socioeconomic status and disability in old age: evidence from the InChianti study for the mediating role of physiological impairments. J Gerontol Series A: Biological Sci Med Sci. 2006;61(1):86-91.
30. Verbrugge LM, Lepkowski JM, Imanaka Y.
Comorbidity and its impact on disability. The Milbank Quarterly. 1989: 450-484.
31. Mung'ala-Odera V, Meehan R, Njuguna P, Mturi N, Alcock KJ, Newton CR. Prevalence and risk factors of neurological disability and impairment in children living in rural Kenya. Int J Epidemiol. 2006;35(3):683-8.
32. Maulik PK, Darmstadt GL. Childhood disability in low-and middle-income countries: overview of screening, prevention, services, legislation, and epidemiology. Pediatrics. 2007;120(Supplement 1):S1-55.
33. Elwan A. Poverty and disability: A survey of the literature. Washington, DC: Social Protection Advisory Service; 1999.
34. Saikia N, Bora JK, Jasilionis D, Shkolnikov VM. Disability divides in India: evidence from the 2011 census. PloS one. 2016;11(8):e0159809.
35. Sousa RM, Ferri CP, Acosta D, Albanese E, Guerra M, Huang Y, et al. Contribution of chronic diseases to disability in elderly people in countries with low and middle incomes: a 10/66 Dementia Research
Group population-based survey. Lancet.
2009;374(9704):1821-30.
36. Oliver M. Social policy and disability: some theoretical issues. Disability Society. 1986;1(1):5-17.
37. Joshi K, Kumar R, Avasthi A. Morbidity profile and its relationship with disability and psychological distress among elderly people in Northern India. Int J Epidemiol. 2003;32(6):978-87.
APPENDIX
Table 1: Age pattern of disability (per 100,000 populations) in selected states of India, 2014.
Age group Any disability Mental Visual Hearing Speech Locomoto Multiple Others
0-10 1140 180 200 70 140 170 120 260
11-20 1720 310 380 130 160 260 150 320
21-30 1860 320 340 120 130 410 160 380
31-40 2460 370 490 210 120 490 190 580
41-50 3290 350 960 360 100 540 280 710
51-60 5100 360 1650 780 140 790 400 990
61-70 8270 350 2680 1780 190 1190 710 1350
71-80 11610 350 3720 3210 190 1540 1170 1430
80+ 15940 540 4610 5280 230 1990 1820 1470
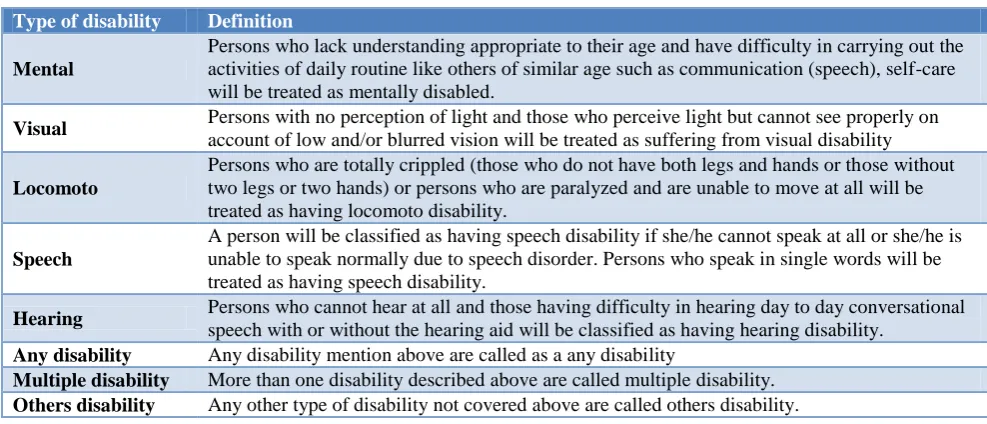
Table 2: Definition of type of disability as used in DLHS-4, 2014.
Type of disability Definition
Mental
Persons who lack understanding appropriate to their age and have difficulty in carrying out the activities of daily routine like others of similar age such as communication (speech), self-care will be treated as mentally disabled.
Visual Persons with no perception of light and those who perceive light but cannot see properly on
account of low and/or blurred vision will be treated as suffering from visual disability
Locomoto
Persons who are totally crippled (those who do not have both legs and hands or those without two legs or two hands) or persons who are paralyzed and are unable to move at all will be treated as having locomoto disability.
Speech
A person will be classified as having speech disability if she/he cannot speak at all or she/he is unable to speak normally due to speech disorder. Persons who speak in single words will be treated as having speech disability.
Hearing Persons who cannot hear at all and those having difficulty in hearing day to day conversational
speech with or without the hearing aid will be classified as having hearing disability.
Any disability Any disability mention above are called as a any disability
Multiple disability More than one disability described above are called multiple disability.