Original Research Article
Community based descriptive study on assessment of nutritional status
among preschool children Pullipakkam village, Tamil Nadu
Gladius Jennifer H.*, Archana Lakshmi P. A.
INTRODUCTION
Nutrition by WHO: “The science of food and its relationship to heath, It is concerned primarily with the part played by nutrients in body growth, development and maintenance”.1
The nutritional status is influenced by the adequacy of food intake both in terms of quantity and quality and also by physical health of individual. The nutrition assessment is to obtain precise information on the prevalence and geographic distribution of nutritional problems of a given community and identification of individuals at risk.
Malnutrition is defined as pathological state resulting from a relative or absolute deficiency or excess of one or more essential nutrients.1 The effects of malnutrition on the community are both direct and indirect. The direct effects are subclinical nutrition deficiency diseases such as kwshiorkar, marasmus, vitamin and mineral deficiency diseases and indirect effects are high morbidity, mortality among young children and delayed physical and mental growth and development.1
From National Family Health Survey III, in India 7.6% of children under five years of age suffer from wasting due to acute under nutrition. More than one third of the
ABSTRACT
Background: Nutrition assessment is to obtain precise information on the prevalence of nutritional problems and identification of individuals at risk. 25.7% of Indian children under five years were underweight and 28.6% were stunted due to chronic under nutrition, India accounts for more than 3 out of 10 stunted children in the world. Under nutrition is substantially higher in rural areas. Hence, this study conducted. The objective of the study was to assess the nutritional status of preschool children (1-5 years) in Pullipakkam, field practice area of KIMSRC.
Methods: An observational study conducted in Pullipakkam from January 2017 to February 2017. 75 children aged 1–5 years were selected by simple random sampling. After getting informed consent from parents, Data were collected using structured questionnaire by interview method. Chi square test at 5% α were calculated by using SPSS 20V.
Results: Among 75 children, stunting (52.8%), wasting (62.3%), mid arm circumference less for age (13.3%). 73% had inadequate calories intake. There was no significant association (p>0.05).
Conclusions: The nutritional status of the children usually remains under question. Parents have to be properly health educated on balanced diet with locally available low cost foods has to given.
Keywords: Stunting, Wasting, Calories, Preschool children
Department of Community Medicine, Karpaga Vinayaga Institute of Medical Sciences and Research Centre, Kancheepuram, Tamil Nadu, India
Received: 21 February 2018
Revised: 20 March 2018
Accepted: 21 March 2018
*Correspondence:
Dr. Gladius Jennifer H.,
E-mail: [email protected]
Copyright: © the author(s), publisher and licensee Medip Academy. This is an open-access article distributed under the terms of the Creative Commons Attribution Non-Commercial License, which permits unrestricted non-commercial use, distribution, and reproduction in any medium, provided the original work is properly cited.
world's children who are wasted live in India.2 25.7% of Indian children under five years are underweight and 28.6% are stunted due to chronic under nutrition, India accounts for more than three out of every ten stunted children in the world. Under nutrition is substantially higher in rural than in urban areas.2 The percentage of children severely underweight is almost five times higher among children whose mothers have no education than among children whose mothers have 12 or more years of schooling. India has the highest number of low birth weight babies per year at an estimated 7.4 million. Only 54.2% of newborns were put to breast within one hour of birth. Less than half of children (48.7%) under 6 months of age are exclusively breastfed. Only 31.7% children aged 6 to 23 months are fed appropriately according to all three recommended practices for infant and young child feeding.2
Despite recent achievement in economic progress in India, the fruit of development has failed to secure a better nutritional status among all children of the country. Hence this study attempt. The objective of the study is to assess the nutritional status of preschool children (1-5 years) in pullipakkam, field practice area of Karpaga Vinayaga Institute of Medical Sciences and Research Centre.
METHODS
We conducted Cross Sectional Study to assess nutritional status for children aged 1–5 years in Pullipakkam, Rural Health Centre, KIMS & RC from January 2017 to February 2017. The total no of children (1-5 years) in Pullipakkam were approximately 200. The required samples by minimum sample size determination for the population ranged 150-200 at 5% level of significance were 75, selected by simple random sampling.3 Study participants aged 1 to 5 years were included in the study, after getting informed consent from parents. The children lesser than one year of age; the parents not given concern to participate were excluded.
Primary data were collected with structured questionnaire by interview method. The questionnaire contains variables such as age, sex, education and occupation of parents, family income, SES, breast feeding, EBF, weaning, immunization etc. The children were examined, hair, face, eyes, teeth, gums, skin, neck, nails etc. The anthropometric measurements such as weight (kgs), height (cm), mid arm circumference (cm), head and chest circumference (cm) were measured. Assessment of dietary intake was administered by 24 hrs recall method.
Calculation of anthropometric measurements for age:
We used IAP classification to classify normal and abnormality.1,4 The formulas were;
1. Weight for age= (age in years *2)+8. The scores were graded as normal ≥81, Grade I= 71-80, Grade II= 61-70, Grade III= 51-60 and Grade IV ≤50 2. Height for Age were classified as Normal ≥96 cm,
Mild impaired= 87.5 cm-95 cm, Moderate impaired= 80 cm - 87.4 cm and severe ≤79 cm.
3. Mid arm circumference was categorized as normal = 13.5 cm, mild/moderate= 12.5 cm–13.5 cm and severe ≤12.5 cm.
The Calories were classified as adequate and inadequate for given age. Age 1-3 years= 1060 and 4-6 years= 1350 were considered as adequate calories for age.1,4
Statistical analysis
Data were analyzed using statistical software SPSS 20 v. Frequency and percentages were calculated and represented in tables and graph. Chi square test was calculated to find the association at 5% level of significance.
RESULTS
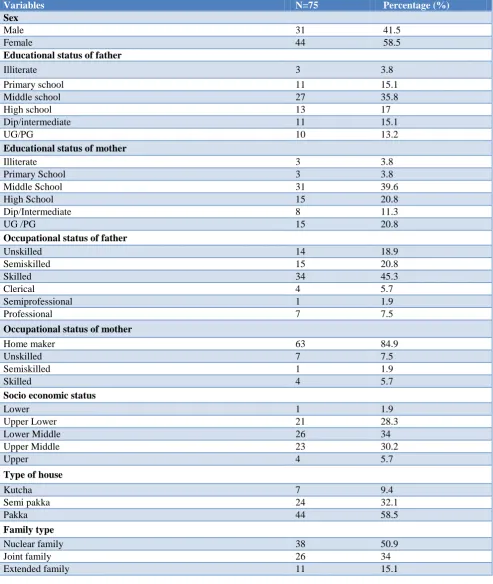
Among 75 Study participants 58.5% were female and 41.5% were male. Majority of parents completed their middle school and most of the fathers were skilled workers and mothers were home maker. Nearly 64% were in middle class families and 58.5% possess pakka houses (Table 1). Most of deliveries held in Govt. hospital 52.8% were born by caesarian section. Colostrums had given 88.7%. Nearly 67.9% regularly dewormed (Table 2).
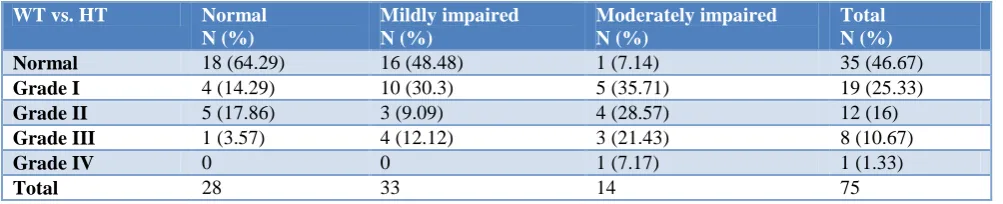
Among mildly impaired by height forage, 30.3% had grade I, 9.09% had grade II and 12.12% had grade III wasting. Among moderately impaired children 35.71%
had grade I, 28.57% had grade II, 21.43% had grade III and 7.17% had grade IV wasting (p>0.05) (Table 4).
Table 1: Demographic profile of study participants.
Variables N=75 Percentage (%)
Sex
Male 31 41.5
Female 44 58.5
Educational status of father
Illiterate 3 3.8
Primary school 11 15.1
Middle school 27 35.8
High school 13 17
Dip/intermediate 11 15.1
UG/PG 10 13.2
Educational status of mother
Illiterate 3 3.8
Primary School 3 3.8
Middle School 31 39.6
High School 15 20.8
Dip/Intermediate 8 11.3
UG /PG 15 20.8
Occupational status of father
Unskilled 14 18.9
Semiskilled 15 20.8
Skilled 34 45.3
Clerical 4 5.7
Semiprofessional 1 1.9
Professional 7 7.5
Occupational status of mother
Home maker 63 84.9
Unskilled 7 7.5
Semiskilled 1 1.9
Skilled 4 5.7
Socio economic status
Lower 1 1.9
Upper Lower 21 28.3
Lower Middle 26 34
Upper Middle 23 30.2
Upper 4 5.7
Type of house
Kutcha 7 9.4
Semi pakka 24 32.1
Pakka 44 58.5
Family type
Nuclear family 38 50.9
Joint family 26 34
Table 2: Birth details and feeding practices of the study participants.
Variables N=75 Percentage (%)
Mode of delivery
Normal 35 47.2%
LSCS 40 52.8%
Place of delivery
Govt. hospital 59 79.2%
Private hospital 16 20.8%
Preterm delivery 6 7.5%
Term delivery 69 92.5%
Birth spacing
1–2 years 43 57%
3–4 years 30 40%
>5 years 2 3%
Birth weight
<2.5 kg 16 21%
>2.5 kg 59 79%
Breast feeding
Adequate 29 38%
Inadequate 46 62%
Colostrums
Given 67 88.7%
Not Given 8 11.3%
Weaning practices
Proper weaning 41 54.7%
Improper weaning 34 45.3%
Calories intake
Adequate 20 26.7%
Inadequate 55 73.3%
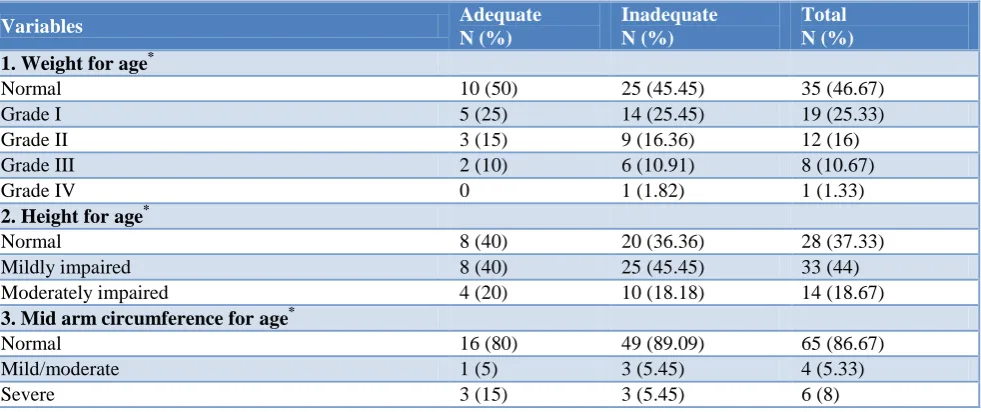
Table 3: Calories intake with anthropometric measurements of study participants.
Variables Adequate
N (%)
Inadequate N (%)
Total N (%) 1. Weight for age*
Normal 10 (50) 25 (45.45) 35 (46.67)
Grade I 5 (25) 14 (25.45) 19 (25.33)
Grade II 3 (15) 9 (16.36) 12 (16)
Grade III 2 (10) 6 (10.91) 8 (10.67)
Grade IV 0 1 (1.82) 1 (1.33)
2. Height for age*
Normal 8 (40) 20 (36.36) 28 (37.33)
Mildly impaired 8 (40) 25 (45.45) 33 (44)
Moderately impaired 4 (20) 10 (18.18) 14 (18.67)
3. Mid arm circumference for age*
Normal 16 (80) 49 (89.09) 65 (86.67)
Mild/moderate 1 (5) 3 (5.45) 4 (5.33)
Severe 3 (15) 3 (5.45) 6 (8)
Table 4: Weight for age vs height for age.
WT vs. HT Normal
N (%)
Mildly impaired N (%)
Moderately impaired N (%)
Total N (%)
Normal 18 (64.29) 16 (48.48) 1 (7.14) 35 (46.67)
Grade I 4 (14.29) 10 (30.3) 5 (35.71) 19 (25.33)
Grade II 5 (17.86) 3 (9.09) 4 (28.57) 12 (16)
Grade III 1 (3.57) 4 (12.12) 3 (21.43) 8 (10.67)
Grade IV 0 0 1 (7.17) 1 (1.33)
Total 28 33 14 75
DISCUSSION
In this study, most of children had a decreased in weight (53.33%) and height (62.67%) for their age and girls deprived than boys.7,8 Yadav et al found 41.3% were under weight and 14% were severely underweight.7 There were an increased number of children taking food from Anganwadi, this was correlated with Rajesh et al.10 Mohamad et al found that 32% was under nourished it had association with maternal literacy and family members.9
Katyal et al found that 48% to 74% malnourished in under five age group.11 Panigrahi et al found that there were 23.3%, 57.4% and 45.4% of children have wasting, stunting and underweight respectively.12 Prevalence of wasting 52% and stunting 62% Which was higher than existing studies, Prevalence of all kind of under nutrition was more among boys than girls.13
The prevalence of under nutrition 66.5% among them grade I 46.2% more common in male (76.9%) than females (56.3%) had association with SES and breast feeding practices.14
Bhuvaneswari et al found that prevalence of moderate stunting and moderate wasting was 52.8% and 47.2%, severe stunting and wasting was in 15.2% and 19.6% children respectively and was no significant age wise or sex wise difference statistically in prevalence of under nutrition.15 Preschool children were consuming diet which was inadequate 73% with respective energy, fat, iron, vitamin A and C. The prevalence of under nutrition was high as was found.16
CONCLUSION
In spite of several health programs offered by the Government of India, the nutritional status of the children usually remains under question. Nowadays, children forced to go to preschool at age 2 years, so they could not able to utilize the complete benefits of Anganwadi. Hence, parents have to be properly health educated on balanced diet with locally available low cost foods has to given.
Limitation
The nutritional assessment based on six domains, in this study we assessed anthropometric measurements and 24 hours diet recall method. It would have been better, assessed all other domains to establish significant results.
ACKNOWLEDGEMENTS
We express our sincere thanks to Ms. Darshini, Ms. Deepika, Mr. Dillip, Ms. Ezhil, Ms. Ezhilarasi, Ms. Fejantha, Ms, Franila, Mr. Ganesh, Mr. Ganesh Kannan, Mr. Gautham, Mr. Gokul, Mr. Immanuel, Ms. Kiran and medical Social Workers Mr. Anbu sagayaraj, Mr. Sathya other faculties and staffs in department of community medicine, KIMS&RC.
Funding: No funding sources Conflict of interest: None declared
Ethical approval: The study was approved by the Institutional Ethics Committee
REFERENCES
1. Park K. Nutrition and Health, Park's Textbook of Preventive and Social Medicine. 24th ed. India: M/s Banarsidas Bhanot; 2017: 646-704.
2. NFHS 3 Reports National Family Health Survey Available at https://rchiips.org/nfhs/nfhs3.shtml. Accessed on 29 January 2017.
3. The research advisors, 2006. Available at
https://www.research-advisors.com/tools/SampleSize.htm Accessed on 01 February 2017.
4. Revised IAP Growth Charts 2015. Available at http://iapindia.org/revisediapgrowthcharts2015.php. Accessed on 29 January 2017.
5. APLS weight estimation - don’t do it (well atmost never). St. Emlyn’s. Available at http://stemlynsblog.org/apls estimation. Accessed on 19 January 2018.
6. WHO child growth standards and the identification of severe acute malnutrition in infants and children, World Health Organization and UNICEF 2009.
Available at
89241598163_eng.pdf. Accessed on 29 January 2017.
7. Yadav SS, Yadav ST, Mishra P, Mittal A, Kumar R, Singh J. Exploring the multidimensional nature of anthropometric indicators for under 5 children in India. IJPH. 2016;60(1):68-72.
8. Tigga PL, Sen J, Mondal N. Association of socio economic and socio demographic variables with wasting among preschool children of North Bengal, India. Ethiop J Health Science. 2015;1:63-72. 9. Mahmood S, Nadeem S, Saif T, Mannan M, Arshad
U. Nutritional status and associated factors in under five children of Rawilpindi. J Ayub Med Coll Abbottabad. 2016;1:6 –71.
10. Rajesh K, Chudasama, Umed VP, Pramod BV, Mayur V, Matib R. Evaluation of anganwadi centres performance under integrated child development services programme in Gujarat, India during 2012-2013. JMGIMS. 2015;20(1):60-1.
11. Katyal R, Singh SP, Joshi HS, Joshi G, Singh A. An assessment of the validity of nutritional indices among under five in the catchment areas of rural health and training centers of a teaching institute in Bareilly. J Family Med Prim Care. 2016;5(2):383–6.
12. Panigrahi A, Das SC. Under nutrition and its correlates among children of 3-9 years of age residing in slum areas of Bhubaneswar India. Sci World J. 2014;2014:1-9.
13. Mittal A, Singh J, Ahluwalia SK. Effect of maternal factors of nutritional status of 1 to 5 years old children in urban slum population. Indian J Community Med. 2007;32(4):264-7.
14. Sivanandham RA, Salome SD, Francic R, Sampavi S, Prasad R. Nutritional status of children aged 3-6 years in a rural area of Tamilnadu. JCDR. 2014;8(10):1-4.
15. Bhupeshwari P, Dulari JG. Nutritional status of rural children aged 1 to 5 years of Gujarat. JEMDS. 2014;3(14):3644-51.
16. Thressia J. An exploratory study to assess the knowledge of mother’s nutritional needs of children. Int J Development Res. 2015;5(10):5770-4.