227 | P a g e
OPTIMIZATION OF PROCESS PARAMETERS OF ELECTROCHEMICAL
DISCHARGE MACHINING USING SDS POWDER
VIPIN CHOPADE
Assistant Professor, AISSMS’s Institute of Information Technology, Kennedy Road, Near R.T.O., Shivaji Nagar, Pune-01
DHANANJAY PISE
Assistant Professor, AISSMS’s Institute of Information Technology, Kennedy Road, Near R.T.O., Shivaji Nagar, Pune-01
MAHESH NIGADE
Assistant Professor, AISSMS’s Institute of Information Technology, Kennedy Road, Near R.T.O., Shivaji Nagar, Pune-01
YOGESH PATIL
Associate Professor, AISSMS’s Institute of Information Technology, Kennedy Road, Near R.T.O., Shivaji Nagar, Pune-01
ABSTRACT:
Electrochemical discharge machining (ECDM) is an emerging non-traditional processing technique that involves high-temperature melting and accelerated chemical etching under the high electrical energy discharged and has potential to machine electrically non-conductive materials such as glass, quartz, composite, ceramics. In ECDM, gas film and sparks are generated on a tool when voltage is applied between the tool and a counter electrode. Work-piece materials are removed mainly by the heat of the sparks. The spark generation is affected by both the voltage and electrolyte conditions. In this present work, The effect of process variables such as electrolyte concentration (EC), duty factor (DF), voltage (V), on response parameters such as Material Removal Rate (MRR), Tool Wear Rate (TWR), Diametric overcut (DOC) have been investigated using Sodium Dodecyl Sulfate (SDS) powder mixed (PMECDM) on soda-lime glass in electrochemical discharge machining (ECDM) using tungsten carbide electrode.
KEYWORDS: Electrochemical Discharge Machining, Material Removal Rate, Soda-Lime Glass, Sodium Dodecyl Powder, Tool Wear Rate
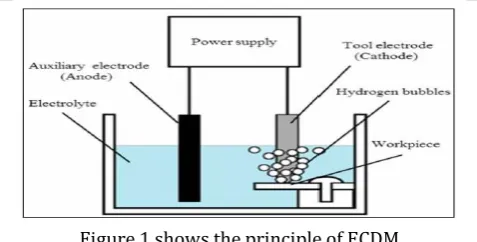
I.INTRODUCTION:
Nonconventional machining processes can be defined as the use of chemical, mechanical, thermal, electrical or combinations of these energies processes to machine a work-piece and remove material without contact between work-piece and tool material. Electrochemical discharge machining (ECDM) is a non-traditional machining method that has been firstly introduced for glass micro drilling by kurafuji and Suda [1]. This process are mainly used for micro-machining of hard and brittle non-conductive materials such as glass (mainly Pyrex, plexi and optical), ceramic, refractory
bricks, quartz and composite materials. This has attracted extensive research interests because of additional advantage of machining electrically non-conductive materials.[2]
228 | P a g e Figure 1 shows the principle of ECDM
The electrochemical reaction for soda-lime glass workpiece ECDM is,
SiO2+2NaOH= Na2O –SiO2 +H2O
The sodium ion (Na+) and the hydroxide ion (OH-) in the electrolyte are adsorbed on the glass surface; the -Si-O-Si- bond is broken and changed into the -Si-O-Na- bond.
Figure 2 Chemical Reaction of Soda-Lime Glass Workpiece
The performance of the process depends on many parameters like tool-electrode material, electrode size and shape, wet ability characteristic of tool-electrode, feed-rate, work-piece material, applied voltage, current, duty cycle, pulse duration, electrolyte, its concentration and temperature, gap between tool-electrode and workpiece, distance between cathode and anode, anode material, etc.
II.LITERATURE SURVEY:
B. Mallick, M.N. Ali, B. R. Sarkar, B. Doloi, B. [1] (2014) - They carried out experimentation and presented parametric analysis, that ECDM can be used with great potential to machine electrically non-conducting harder brittle materials such as glass and can also be employed for micro-channel cutting applications. They draw the following conclusions ECDM system. Baoyang Jiang, Shuhuai Lan, Jun Ni, Zhaoyang Zhang [2] (2014) – studied the process modeling of ECDM with respect to spark generation and material removal. Tapered tool electrodes were employed as tool electrode whereas energy distribution curve and finite element method was used to study the outputs for spark generation and material removal rate. They concluded as tapered tool improved the consistency of spark generation and suppressed the generation of minor discharges prediction of material removal is reasonable in terms of diameter and maximum
depth of machined holes. Y.S. Laio, L.C. Wu, W.Y. Peng [3] (2013) - They studied the effects of Sodium Dodecyl Sulphate (SDS) surfactant added electrolyte on machining quartz in electrochemical discharge machining (ECDM). Experimental results show that, as current density is increased, there is more bubble release around the electrode. The sparks become brighter and take place in a larger area and more stable pulse current is obtained. As a result, a less taper and a better quality but a little over size hole can be drilled with a higher engraving speed. Based on the observation of sparking process together with the experimental results, a new bubble forming mechanism during ECDM when SDS added electrolyte used is inferred. B. Bhattacharyya and J. Munda [11] (2004) – in this paper, the advantages of ECDM over other machining process as absence of burr, bright surface finish and ability to machine complex shapes regardless of its hardness is expressed. They also found that, the material for tool should be chemically inert and should have good electrical conductivity. Need to use freash electrolyte everytime is essential because precipitate of electrolyte may damage the tool and will affect MRR. Flow of electrolyte has effect on machining accuracy.
III. EXPERIMENTAL SETUP:
For this experimentation, we have selected Soda-lime glass as a work piece material. Tungsten Carbide with cylindrical geometry is used as a cathode tool. All experiments has been carried out on ECDM machine. For work-piece and tool preparation we used diamond cutter and cylindrical grinder. In pre-processing the work pieces and tools were weighing on the Citizon AX 220 digital weighing machine. It is having a least count of 0.1 mg. After machining had done, again we measured weights of tools and work-pieces on same machine for calculation of material removal rate and tool wear rate values. For diametric overcut, diameter of tool is measured by Digital Vernier Calliper and diameter of hole of work-pieces is measured on Machine vision measuring system unit.
Table 1 Chemical Composition of soda-lime glass [1]
Elements SiO
2
Na2O CaO MgO Al2O3 K2O SO3
Weight % 72 13 10.5 2.4 0.6 0.4 0.3
Table 2 Physical Properties of soda-lime glass[1]
Youngs Modulus (psi) 9.8 ×10⁶
Coeff. Of Expansion 89 × 10-7 cm/cm/ oC Poisson Ratio 0.22
229 | P a g e Sodium Dodecyl Sulphate also known as sodium
laurel sulphate and it is a surfactant have long chain alkyl (like fatty acid, etc.) is lipophilic group.
PHYSICAL AND CHEMICAL PROPERTIES OF SDS POWDER:
Chemical formula of SDS - CH3 (CH2)11OSO3Na Molecular weight - 288.38 g/mol
Odour -Slight fatty odour Molar mass – 288.37 g/mol Solubility -10g/100g water Melting point – 206⁰C Density – 1.01 g/ cm3 pH - 6.0-7.5
In electrochemical discharge machining, electrolyte is very reactive with metal. So we designed the machining chamber made of Acrylic material and bonded with chloroform which is chemically not reactive with NaOH and transparent enough to see level of electrolyte when poured in it. Special slider fixture made of SS (which is non-corrosive with NaOH electrolyte) material designed in chamber with allen bolt to fix work-piece in it. The chamber dimensions are (100 × 100 ×80) mm having 8 mm thickness. The figure shows the acrylic chamber.
Figure 3: Acrylic chamber
IV.EXPERMIENTAL CONDITIONS:
Following machining parameters are kept constant selected on performance characteristics,
Sr. No. Machining Condition Specification 1 Work-piece material Soda-lime Glass 2 Tool electrode material Tungsten Carbide 3 Auxiliary tool material Nickel
4 Machining time 20 min
5 Level of electrolyte 1 mm (above w/p) 6 Distance between anode to
cathode
45 mm
7 Tool feed rate 1.67 µm/sec 8 Area ratio anode to cathode 50:1 9 Gap between cathode tool
and workpiece
25 μm
10 Temperature Ambient 27 ͦ C
With reference to literature survey, the following parameters were considered as variable input parameters,
1. Voltage (V): The D.C voltage is applied between cathode and anode from D. C. power supply system. 2. Duty factor (%): The ratio of the pulse on time to the pulse on and pulse off time (total pulse time) is called as duty factor.
3. Electrolyte Concentration (wt %): It is expressed in % by wt, which indicates the weight of the NaOH dissolved per 100 ml demineralised water to prepare the aqueous electrolyte.
4. Sodium dodecyl sulphate powder Concentration
(weight %): It is expressed in % by weight, which
indicates the weight of the SDS powder dissolved per 100 ml water. Electrolyte solution is prepared first and then it is allowed to cool down. SDS powder is added into that electrolytic solution. Size of the graphite powder particles is 12-15 µm (1200 mesh size).
The decision variables were,
1. MRR (mg/min): Material removal rate is calculated by taking weight work-piece before and after the machining and dividing it by machining time. Or “the ratio of the volume of material removed from the work-piece with respect to the machining time”
2. Tool wear rate (mg/min) – Tool wear rate is
calculated by taking weight tool before and after the machining and dividing it by machining time. Or “the ratios of the volume of material wear from the tool surface with respect to the machining time”
3. Diametric over cut (mm) - It is the difference
between machined hole diameter and tool diameter. It is measured on vision machine system.
DOC (mm) = Diameter of Hole – Diameter of Tool
As discussed above, the different input parameters were selected form the literature survey. The variation in the input parameters is done to carry out the experimentation and plackett burman method of design of experiment is selected to run the experiments.
230 | P a g e
Std Or de r
Ru n Or de r
PtTy pe
Bloc ks
V o lt
Du ty Fa ct or
Elec.Conc
4 1 1 1 75 75 35
5 2 1 1 75 85 25
10 3 1 1 75 75 25
1 4 1 1 75 75 35
11 5 1 1 65 85 25
6 6 1 1 75 85 35
3 7 1 1 65 85 35
12 8 1 1 65 75 25
2 9 1 1 75 85 25
7 10 1 1 65 85 35
9 11 1 1 65 75 25
8 12 1 1 65 75 35
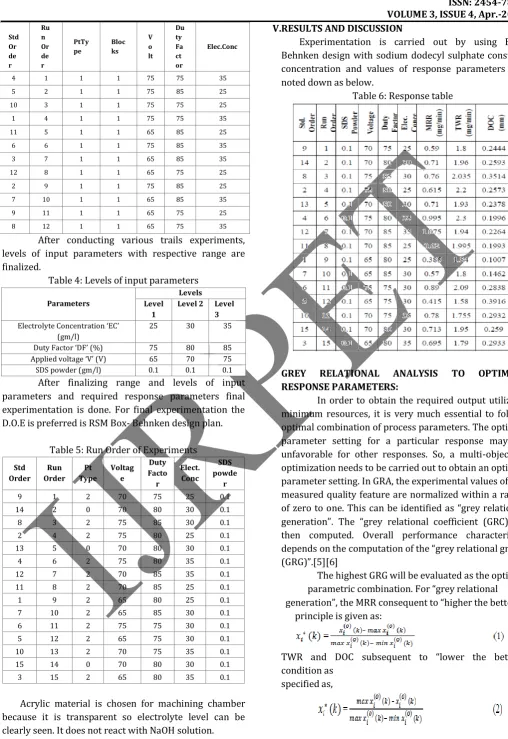
After conducting various trails experiments, levels of input parameters with respective range are finalized.
Table 4: Levels of input parameters
Parameters
Levels Level
1
Level 2 Level 3
Electrolyte Concentration ‘EC’ (gm/l)
25 30 35
Duty Factor ‘DF’ (%) 75 80 85 Applied voltage ‘V’ (V) 65 70 75 SDS powder (gm/l) 0.1 0.1 0.1
After finalizing range and levels of input parameters and required response parameters final experimentation is done. For final experimentation the D.O.E is preferred is RSM Box- Behnken design plan.
Table 5: Run Order of Experiments
Std Order
Run Order
Pt Type
Voltag e
Duty Facto r
Elect. Conc
SDS powde
r
9 1 2 70 75 25 0.1 14 2 0 70 80 30 0.1 8 3 2 75 85 30 0.1 2 4 2 75 80 25 0.1 13 5 0 70 80 30 0.1 4 6 2 75 80 35 0.1 12 7 2 70 85 35 0.1 11 8 2 70 85 25 0.1 1 9 2 65 80 25 0.1 7 10 2 65 85 30 0.1 6 11 2 75 75 30 0.1 5 12 2 65 75 30 0.1 10 13 2 70 75 35 0.1 15 14 0 70 80 30 0.1 3 15 2 65 80 35 0.1
Acrylic material is chosen for machining chamber because it is transparent so electrolyte level can be clearly seen. It does not react with NaOH solution.
V.RESULTS AND DISCUSSION
Experimentation is carried out by using Box- Behnken design with sodium dodecyl sulphate constant concentration and values of response parameters are noted down as below.
Table 6: Response table
GREY RELATIONAL ANALYSIS TO OPTIMIZE RESPONSE PARAMETERS:
In order to obtain the required output utilizing minimum resources, it is very much essential to follow optimal combination of process parameters. The optimal parameter setting for a particular response may be unfavorable for other responses. So, a multi-objective optimization needs to be carried out to obtain an optimal parameter setting. In GRA, the experimental values of the measured quality feature are normalized within a range of zero to one. This can be identified as “grey relational generation”. The “grey relational coefficient (GRC)” is then computed. Overall performance characteristic depends on the computation of the “grey relational grade (GRG)”.[5][6]
The highest GRG will be evaluated as the optimal parametric combination. For “grey relational generation”, the MRR consequent to “higher the better”
principle is given as:
TWR and DOC subsequent to “lower the better” condition as
specified as,
231 | P a g e Where xi (l) is obtained “grey relational generation”, min
yi (l) is the least value of yi (l) for the lth response and max yi (l) is the highest value for the lth response where l = 1,2,3,4 for the various output responses considered in a sequence. The data after normalization for “grey relational generation” GRC is computed to establish a correlation between the finest data and the definite normalized data. The GRC is calculated as:
With n being the number of output responses. The higher is the value of GRG, the closer is the subsequent arrangement of parameters to the optimum solution.
Table 7: S/N ratio of response parameter
R u n M R R S/N T W R
S/N DO
C S/N
1 0.59 -4.583 1.8 -5.1055 0.2444 12.238 2 0.71 -2.9748 1.96 -5.8451 0.2593 11.724 3 0.76 -2.3837 2.035 -6.1713 0.3514 9.08397 4 0.615 -4.2225 2.2 -6.8485 0.2573 11.7912 5 0.71 -2.9748 1.93 -5.7112 0.2378 12.4758 6 0.995 -0.0435 2.3 -7.2346 0.1996 13.9968 7 1.075 0.62817 1.94 -5.756 0.2264 12.9025 8 0.62 -4.1522 1.995 -5.9989 0.1993 14.0099 9 0.385 -8.2908 1.84 -5.2964 0.1007 19.9394 10 0.57 -4.8825 1.8 -5.1055 0.1462 16.7011 11 0.89 -1.0122 2.09 -6.4029 0.2838 10.9398 12 0.415 -7.639 1.58 -3.9731 0.3916 8.14315 13 0.78 -2.1581 1.755 -4.8855 0.2932 10.6567 14 0.713 -2.9382 1.95 -5.8007 0.259 11.734 15 0.695 -3.1603 1.79 -5.0571 0.2933 10.6538
From the S/N ratios of each response parameters, normalized values are obtained by using equation (1), [1- normalized value] gives deviation sequence value. By assuming =0 , =1 and =0.5 and referring equation (3) Grey relational coefficient is obtained for every run of experiment. Average of all GRC of same experiment run is calculated by using equation (4), that value is GRG of that particular experimental run. The values for GRC and GRG for each run with the rank order are furnished in table. Higher value of GRG leads to the optimum or close to the optimum combination of input parameters.
Table 8: GRG calculations
Normalised S/N ratios
Deviation sequence GRCoeff G
R G M R R T W R D O C M R R T W R D O C M R R T W R D O C 0.41 6 0.34 7 0.65 3 0.58 4 0.65 3 0.34 7 0.461 1 0.433 7 0.590 2 0.495 0 0.59 6 0.57 4 0.69 6 0.40 4 0.42 6 0.30 4 0.553 1 0.539 9 0.622 2 0.571 8 0.66 2 0.67 4 0.92 0 0.33 8 0.32 6 0.08 0 0.596 9 0.605 3 0.862 4 0.688 2 0.45 6 0.88 2 0.69 1 0.54 4 0.11 8 0.30 9 0.479 0 0.808 6 0.617 9 0.635 1 0.59 6 0.53 3 0.63 3 0.40 4 0.46 7 0.36 7 0.553 1 0.517 0 0.576 5 0.548 9 0.92 5 1.00 0 0.50 4 0.07 5 0.00 0 0.49 6 0.869 1 1.000 0 0.501 9 0.790 3 1.00 0 0.54 7 0.59 7 0.00 0 0.45 3 0.40 3 1.000 0 0.524 5 0.553 4 0.692 6 0.46 4 0.62 1 0.50 3 0.53 6 0.37 9 0.49 7 0.482 6 0.568 9 0.501 3 0.517 6 0.00 0 0.40 6 0.00 0 1.00 0 0.59 4 1.00 0 0.333 3 0.456 9 0.333 3 0.374 5 0.38 2 0.34 7 0.27 5 0.61 8 0.65 3 0.72 5 0.447 3 0.433 7 0.408 0 0.429 7 0.81 6 0.74 5 0.76 3 0.18 4 0.25 5 0.23 7 0.731 1 0.662 3 0.678 4 0.690 6 0.07 3 0.00 0 1.00 0 0.92 7 1.00 0 0.00 0 0.350 4 0.333 3 1.000 0 0.561 2 0.68 8 0.28 0 0.78 7 0.31 2 0.72 0 0.21 3 0.615 5 0.409 8 0.701 2 0.575 5 0.60 0 0.56 0 0.69 6 0.40 0 0.44 0 0.30 4 0.555 6 0.532 1 0.621 6 0.569 8 0.57 5 0.33 2 0.78 7 0.42 5 0.66 8 0.21 3 0.540 7 0.428 2 0.701 4 0.556 8
Figure 4: Grey relation grade for multiple responses
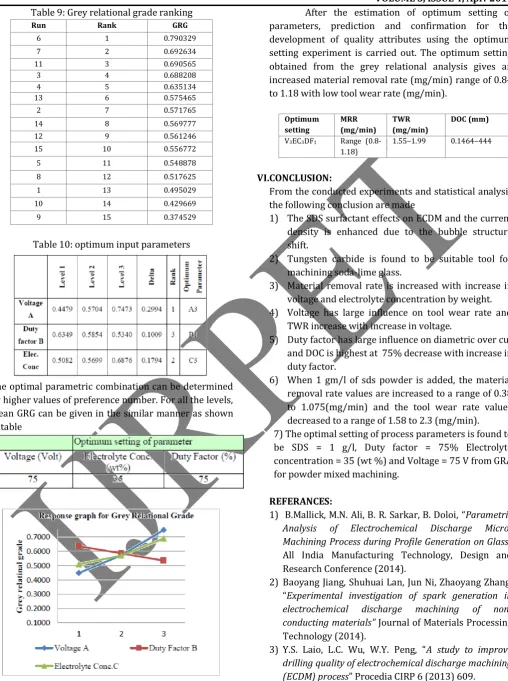
232 | P a g e Table 9: Grey relational grade ranking
Run Rank GRG
6 1 0.790329 7 2 0.692634 11 3 0.690565 3 4 0.688208 4 5 0.635134 13 6 0.575465 2 7 0.571765 14 8 0.569777 12 9 0.561246 15 10 0.556772 5 11 0.548878 8 12 0.517625 1 13 0.495029 10 14 0.429669 9 15 0.374529
Table 10: optimum input parameters
The optimal parametric combination can be determined by higher values of preference number. For all the levels, mean GRG can be given in the similar manner as shown in table
Figure 5: Response graph grey relation grade
After the estimation of optimum setting of parameters, prediction and confirmation for the development of quality attributes using the optimum setting experiment is carried out. The optimum setting obtained from the grey relational analysis gives an increased material removal rate (mg/min) range of 0.84 to 1.18 with low tool wear rate (mg/min).
Optimum setting
MRR (mg/min)
TWR (mg/min)
DOC (mm)
V3EC3DF1 Range
(0.8-1.18)
1.55–1.99 0.1464–444
VI.CONCLUSION:
From the conducted experiments and statistical analysis the following conclusion are made
1) The SDS surfactant effects on ECDM and the current density is enhanced due to the bubble structure shift.
2) Tungsten carbide is found to be suitable tool for machining soda-lime glass.
3) Material removal rate is increased with increase in voltage and electrolyte concentration by weight. 4) Voltage has large influence on tool wear rate and
TWR increase with increase in voltage.
5) Duty factor has large influence on diametric over cut and DOC is highest at 75% decrease with increase in duty factor.
6) When 1 gm/l of sds powder is added, the material removal rate values are increased to a range of 0.38 to 1.075(mg/min) and the tool wear rate values decreased to a range of 1.58 to 2.3 (mg/min). 7) The optimal setting of process parameters is found to be SDS = 1 g/l, Duty factor = 75% Electrolyte concentration = 35 (wt %) and Voltage = 75 V from GRA for powder mixed machining.
REFERANCES:
1) B.Mallick, M.N. Ali, B. R. Sarkar, B. Doloi, “Parametric
Analysis of Electrochemical Discharge Micro-Machining Process during Profile Generation on Glass”
All India Manufacturing Technology, Design and Research Conference (2014).
2) Baoyang Jiang, Shuhuai Lan, Jun Ni, Zhaoyang Zhang, “Experimental investigation of spark generation in
electrochemical discharge machining of non-conducting materials" Journal of Materials Processing
Technology (2014).
3) Y.S. Laio, L.C. Wu, W.Y. Peng, “A study to improve
drilling quality of electrochemical discharge machining (ECDM) process” Procedia CIRP 6 (2013) 609.
4) B. Bhattacharyya, J.Munda, “Advancement in
233 | P a g e Journal of Machine Tools & Manufacture 44 (2012)
1577–1589.
5) Mohit Tiwari, Kuwar Mausam, Kamal Sherma,
“Investigate the Optimal Combination of Process Parameters for EDM by using a Grey Relational Analysis”, International conference on Advances in
Manufacturing and Materials Engineering (AMME 2014), pp. 1736-1744.
6) S.J.Raykar, A.M.Mane, D.M. Addona, “Multi-objective
optimization of high speed turning of Al 7075 using grey relational analysis”, 9th CIRP Conference on
Intelligent Computation in Manufacturing Engineering, (2015), pp. 293-298.
7) G. Montegomery, “Design and Analysis of Experiments,” L. Ratts, Ed. John Wiley & Sons, Inc., (2013).
![Table 3: Input parameters for experiments[7]](https://thumb-us.123doks.com/thumbv2/123dok_us/1997978.1659414/3.595.32.555.70.772/table-input-parameters-for-experiments.webp)