Acquisition Performance Analysis of BOC Signal
Considering the Code Search Step Size
Zaixiu Yang
Beijing University of Aeronautics and Astronautics, Beijing, China Email: [email protected]
Zhigang Huang and Shengqun Geng
Beijing University of Aeronautics and Astronautics, Beijing, China Email: {baahzg, gengshengqun}@163.com
Abstract—The Binary Offset Carrier (BOC) proposed for
next generation of Global Navigation Satellite Systems (GNSS) will enhance navigation performance and spectrum compatibility. However, the acquisition process is made more complex, due to the ambiguities in the autocorrelation function. This paper analyzes the performance of two methods allowing to acquire a BOC signal unambiguously: the Binary Phase Shift Keying like (BPSK-like) technique and the Sub Carrier Phase Cancellation (SCPC) technique. In order to measure the acquisition performance, statistical analysis model of these methods using the non-coherent combining scheme is developed. The code search step size effects for these techniques are analyzed and compared with the direct acquisition technique. The effects of the code search step size on acquisition performance for different cases are assessed in terms of probability of detection and probability of false alarm.
Index Terms—acquisition performance; BPSK-like; SCPC;
code search step size
I. INTRODUCTION
The Binary Offset Carrier (BOC) signal has been selected for next generation of Global Navigation Satellite Systems (GNSS). A Sin/CosBOC(m n, ) signal is created by a sine/cosine square subcarrier modulation, where the signal is multiplied by a sine/cosine rectangular subcarrier at subcarrier frequency. The parameters are equal to m= fsc/ fref and n= fc/ fref , where fsc is
subcarrier frequency, fc is the Pseudorandom Noise
(PRN) code rate and fref = 1.023MHz is the reference
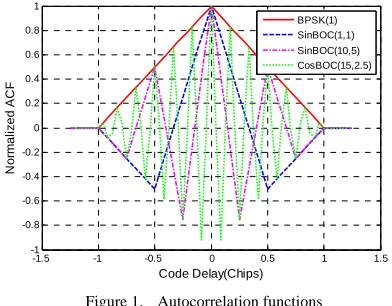
frequency [1]. The autocorrelation function (ACF) of BOC signal has multiple positive and negative peaks, which induces a complexity in the acquisition phase and a risk of biased measures while tracking [2].
Several techniques can be used to eliminate the ambiguity of the ACF envelop. This paper assesses the performance of two methods allowing to acquire a BOC signal unambiguously: the Binary Phase Shift Keying like
(BPSK-like) technique [3], [4], [5], [6] and the Sub Carrier Phase Cancellation (SCPC) technique [6], [7]. The BPSK-like technique only consists in considering the received BOC(m n, ) signal as the sum of two BPSK(n) signals. The BPSK-like methods approached in the literature can be divided into two categories: Fishman & al. method and Martin & al. method [8]. The main lobes of the signal and of reference BOC-modulated PRN code are selected and then correlated in the former method. However, the latter is less complex, where both the main lobes and secondary lobes between the main lobes of the signal are kept and the reference code is based on the BPSK-modulated PRN code. Therefore, only one filter is needed in Martin & al. method. Moreover, the use of two filters in the Fishman & al. method induces unacceptable error due to filtering effect on the signal, as explained in [6]. In this paper, the BPSK-like method just stands for the Martin & al. method.
The Sub Carrier Phase Cancellation (SCPC) technique also can be used to get rid of the ambiguous ACF envelop, in which the local PRN codes modulated by in-phases subcarrier and quadrature subcarrier correlate with the received signal respectively. The acquisition performance of the SCPC method will be discussed and compared with the BPSK-like method.
The traditional analysis of BOC signal acquisition performance focuses on the Receiver Operating Characteristic (ROC) curves, without considering the effect of the code search step size. However, the code search step size has direct influence on signal acquisition process. The objective of this paper is to analyze the effect of the code search step size on autocorrelation value and acquisition performance.
This paper is organized as follows. First the received Intermediate Frequency (IF) signal model will be introduced. Second theoretical analysis of the BPSK-like method and the SCPC method is presented here. This process is based on a two hypothesis test statistic:
• H0: absence of input signal
• H1: presence of input signal
The statistical characteristics of the acquisition output variable using non-coherent combining scheme will be This work was supported by the Open Fund of Key Laboratory of
-1.5 -1 -0.5 0 0.5 1 1.5 -1
-0.8 -0.6 -0.4 -0.2 0 0.2 0.4 0.6 0.8 1
Code Delay(Chips)
No
rm
a
liz
e
d
A
CF
BPSK(1) SinBOC(1,1) SinBOC(10,5) CosBOC(15,2.5)
Figure 1. Autocorrelation functions
exp( 2jπf tsc) exp(−j2πf tsc) Fc
F Fc−sc Fc+Fsc
1
B
R
4
B
R 3
B
R 2
B
R
Figure 2. Principle of the BPSK-like method
obtained. Next the effect of code search step size on the autocorrelation value is analyzed for BOC signals. The effects of the code search step size on acquisition performance for different cases are assessed in terms of probability of detection (
P
d ) and probability of false alarm (P
fa).II. STATISTICAL ANALYSIS OF ACQUISITION
PERFORMANCE
A. Signal Model
As depicted in the introduction, the BOC baseband signal can be written as
( ) ( ) ( )
s n =c n sc n (1)
where c n( )is the PRN code; sc n( )is subcarrier of the BOC signal. BOC waveforms have autocorrelation functions (ACFs) containing multiple peaks, as presented in Fig. 1.
The down-converted radio signal after Analog to Digital Converter (ADC) can be represented as [9]
( ) ( ) ( )
( ) ( ) ( )
cos(2 ( ) ) ( )
IF IF IF
in
IF d s in IF
r n s n n
A d n c n sc n
f f nT n
δ
τ τ
π ϕ δ
= +
= − −
× + + +
(2)
where Ain is the amplitude of the signal; d n( ) is
navigation data; fIF and fd denote the Intermediate
Frequency (IF) and the Doppler shift respectively; τ is the time delay; Ts =1 fsis the sampling period; ϕin is the
initial phase of the received signal and δIF( )n is additive white Gaussian noise with zero mean and the variance
2
IF
σ . A convenient choice is to sample the IF signal with a sampling frequency fs =2BIF, where BIF is the
front-end bandwidth. In this case, it is easily shown that the noise variance becomes [10]
2 2
0 0
{ ( )} / 2
IF E IF n N fs N BIF
σ = δ = = (3)
where N0/ 2 is the power spectral density of δIF( )t . B. The BPSK-like Method
As mentioned above, the BPSK-like method uses only one centered filter with a bandwidth including the two principal lobes of the spectrum and the secondary lobes between the two principal lobes. Two correlation channels are generated: right channel where the filtered signal situated at fIF + fsc and correlated with a BPSK signal and left channel where the filtered signal situated at fIF − fsc and correlated with a BPSK signal. The principle of this method is illustrated in Fig. 2. The correlation outputs of the two channels are combined [6].
At the output of the correlator, we get the correlation value between the incoming signal and the local generated one, which can be represented as [6], [10]
' '
1
1 '
0
( ) cos(2 ( ) )
1
( ) exp( 2 )
N
IF IF d s in
B
n sc s
r n f f nT
R
N c n j f nT
π ϕ
τ π
−
=
⎡ + + ⎤
= ⎢ ⎥
× −
⎢ ⎥
⎣ ⎦
∑
. (4)After calculation, it can be written as
1 ( ) ( )
B IH IH
R =y n +δ n (5)
,
( ) ( ) ( ) sin ( ) cos( ) 2
in
IH B H d c
A
y n = d n R ∆τ cπ∆f T ∆ϕ (6)
where Tc is the coherent integration time; N=Tc/Ts
represents the number of samples in coherent integration;
'
τ τ τ
∆ = − , '
d d d
f f f
∆ = − and '
in in
ϕ ϕ ϕ
∆ = − .RB H, (∆τ)
represents the correlation function between the received BOC signal and the local PRN code modulated byexp( 2j πf tsc ). Similarly, other correlation results can be expressed as [6], [10]
2 ( ) ( )
B QH QH
R =y n +δ n (7)
3 ( ) ( )
B IL IL
R = y n +δ n (8)
4 ( ) ( )
B QL QL
R =y n +δ n (9)
with
,
( ) ( ) ( ) sin ( ) sin( )
2
in
QH B H d c
A
y n = d n R ∆τ cπ∆f T ∆ϕ (10)
,
( ) ( ) ( ) sin ( ) cos( )
2
in
IL B L d c
A
y n = d n R ∆τ cπ∆f T ∆ϕ (11)
,
( ) ( ) ( ) sin ( ) sin( )
2
in
QL B L d c
A
y n = d n R ∆τ cπ∆f T ∆ϕ (12)
where RB L, (∆τ) represents the correlation function
between the received BOC signal and the local PRN code modulated by exp(−j2π f tsc ) [6].
Correlation channels
cos quadratureCode x sub-carrier
generator I&D
I&D I&D I&D
Channel Combining I
Q Received
signal
Code x in-phase sub-carrier
generator
3
S
R
2
S
R 4
S
R 1
S
R
sin
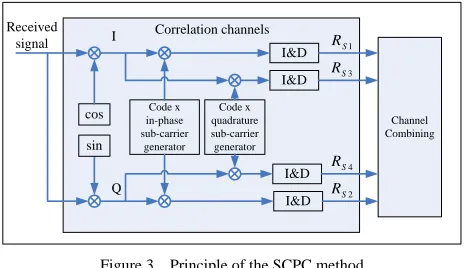
Figure 3. Principle of the SCPC method
-1.50 -1 -0.5 0 0.5 1 1.5
0.2 0.4 0.6 0.8 1
Code Delay(Chips)
No
rm
a
liz
e
d
ACF
SinBOC(1,1) SinBOC(10,5) CosBOC(15,2.5)
Figure 4. Reconstructed ACFs using the BPSK-like method
-1.50 -1 -0.5 0 0.5 1 1.5
0.1 0.2 0.3 0.4 0.5 0.6 0.7 0.8 0.9
Code Delay(Chips)
N
or
m
al
iz
ed A
C
F
SinBOC(1,1) SinBOC(10,5) CosBOC(15,2.5)
Figure 5. Reconstructed ACFs using the SCPC method are independent Gaussian noises with this variance [10]
1
2 ' '
0
2
' 0
1
{ [ ( ) cos(2 ( ) )
1
( ) exp( 2 )]}
2 2
N
IF IF d s in
n
IF IF
sc s
Var n f f nT
N
N B
c n j f nT
N N
σ δ π ϕ
σ
τ π
−
=
= + +
× − ≈ =
∑
(13)
that is
2 2 2 2 2
IH QH IL QL
δ δ δ δ
σ =σ =σ =σ =σ . (14)
C. The SCPC Method
The Sub Carrier Phase Cancellation (SCPC) technique also can be used to make a non-ambiguous acquisition of BOC signal [6], [7]. This method combines correlations of the incoming signal with both sine and cosine subcarrier replicas to create an approximation of a single Phase Shift Keying like (PSK-like) peak. The principle of the SCPC method is presented in Fig. 3.
With this method, two correlation channels are generated. Similarly to the BPSK-like method, four correlation values can be expressed here [6], [10]
1 ( ) ( )
S II II
R =y n +δ n (15)
2 ( ) ( )
S QI QI
R =y n +δ n (16)
3 ( ) ( )
S IQ IQ
R =y n +δ n (17)
4 ( ) ( )
S QQ QQ
R =y n +δ n (18)
with
,
,
,
,
( ) ( ) ( ) sin ( ) cos( )
2
( ) ( ) ( ) sin ( ) sin( )
2
( ) ( ) ( ) sin ( ) cos( )
2
( ) ( ) ( ) sin ( ) sin( )
2
in
II S I d c
in
QI S I d c
in
IQ S Q d c
in
QQ S Q d c
A
y n d n R c f T
A
y n d n R c f T
A
y n d n R c f T
A
y n d n R c f T
τ π ϕ
τ π ϕ
τ π ϕ
τ π ϕ
= ∆ ∆ ∆
= ∆ ∆ ∆
= ∆ ∆ ∆
= ∆ ∆ ∆
(19)
where RS I, (∆τ) and RS Q, (∆τ) represent respectively the
cross-correlation function of the received BOC signal with the local in-phase BOC code, and the cross-correlation function of the received BOC signal with the local quadrature BOC code [6]. ThenδII( )n ,δQI( )n ,
( )
IQ n
δ andδQQ( )n are independent Gaussian noises with variances
2 2 2 2 2
II QI IQ QQ
δ δ δ δ
σ =σ =σ =σ =σ . (20)
D. Non-coherent Combining
Non-coherent channel combining for increasing the acquisition performance consists in simply summing instances of the output of the correlation channels [10]. The reconstructed ACFs of BOC signals using non-coherent combining scheme are shown in Fig. 4 and Fig.
5, using the ideal filter of bandwidth: 2(fsc+ fc). Noted that the maximum correlation values are all smaller than 1. This is due to the limited bandwidth and the cross-correlation loss introduced by these techniques.
The final decision variable is obtained as [9]
2 2 2 2
1 2 3 4
1
[ ]
K
NCH X X X X
k
S R R R R
=
=
∑
+ + + (21)where RXi represents RBi or RSi(i=1, 2, 3, 4).
In the H0 state, where the signal is absent,
( 1, 2, 3, 4)
Xi
R i= is a Gaussian random variable with zero mean (
0
| 0
Xi
R H
µ = ) and variance [6], [10]
0
2
2 2
|
2 Xi
IF
R H
N
σ
σ =σ = . (22)
Therefore, SNCHis a
2
0 0.2 0.4 0.6 0.8 1 1.2 1.4 1.6 1.8 2 0
0.2 0.4 0.6 0.8 1
Code Search Step Size(Chips)
N
o
rm
a
li
z
e
d
A
b
s
o
lu
te
C
o
rre
la
ti
o
n
V
a
lu
e
Best Case
SinBOC(1,1): Worst Case SinBOC(10,5): Worst Case CosBOC(15,2.5): Worst Case
Figure 6. Effect of the code search step size on correlation values for the direct acquisition method
0 0.2 0.4 0.6 0.8 1 1.2 1.4 1.6 1.8 2 0
0.2 0.4 0.6 0.8 1
Code Search Step(Chips)
N
or
m
al
iz
ed A
b
s
ol
ut
e
C
o
rr
el
at
io
n V
a
lue
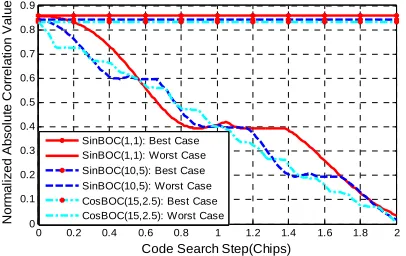
SinBOC(1,1): Best Case SinBOC(1,1): Worst Case SinBOC(10,5): Best Case SinBOC(10,5): Worst Case CosBOC(15,2.5): Best Case CosBOC(15,2.5): Worst Case
Figure 7. Effect of the code search step size on correlation values for the BPSK-like method
0 0.2 0.4 0.6 0.8 1 1.2 1.4 1.6 1.8 2 0
0.1 0.2 0.3 0.4 0.5 0.6 0.7 0.8 0.9
Code Search Step(Chips)
N
o
rm
a
liz
e
d
A
b
s
o
lu
te
C
o
rr
e
la
tio
n
V
a
lu
e
SinBOC(1,1): Best Case SinBOC(1,1): Worst Case SinBOC(10,5): Best Case SinBOC(10,5): Worst Case CosBOC(15,2.5): Best Case CosBOC(15,2.5): Worst Case
Figure 8. Effect of the code search step size on correlation values for the SCPC method
freedom. The probability of false alarm is then defined
2
0 2 2
0 1
( | ) exp( )
!
2 2
NCH t
k K
t t
fa V S
k
V V
P f s H ds
k
σ σ
∞
=
⎛ ⎞
= = − ⎜ ⎟
⎝ ⎠
∑
∫
. (23)Under H1 hypothesis, where the desired signal is
present, RXi(i=1, 2, 3, 4) is a Gaussian random variable with properties [10]
1
2 2
| Xi
R H
σ =σ (24)
1
| ( ) sin ( ) cos( ), 1, 3 2
Xi
in
R H i d c
A
R c f T i
µ = ∆τ π∆ ∆ϕ = (25)
1
| ( ) sin ( ) sin( ), 2, 4 2
Xi
in
R H i d c
A
R c f T i
µ = ∆τ π∆ ∆ϕ = (26)
where Ri(∆τ)(i=1, 2, 3, 4) represents RS I, (∆τ) or , ( )
S Q
R ∆τ with the SCPC method, and represents
, ( )
B H
R ∆τ or RB L, (∆τ) with the BPSK-like method.
Then, SNCH is a non-central
2
χ distribution with 4K degrees of freedom. The non-centrality parameter λ of the distribution is defined as
1
4 2
| 1
2
2 2 2
, ,
2
2 2 2
, ,
[ ( ) ( )]sin ( ),
4
[ ( ) ( )]sin ( ),
4
Xi R H i
in
B H B L d c
in
S I S Q d c
K
KA
R R c f T BPSK like
KA
R R c f T SCPC
λ µ
τ τ π
τ τ π
=
= =
⎧
∆ + ∆ ∆ −
⎪⎪ ⎨
⎪ ∆ + ∆ ∆
⎪⎩
∑
.(27)
The probability of detection is defined as [10]
1 2
( | ) ,
NCH t
t
d V S K
V
P f s H ds Q λ
σ σ
∞ ⎛ ⎞
= = ⎜⎜ ⎟⎟
⎝ ⎠
∫
(28)where QK( )⋅ is a Marcum Q-function.
III. EFFECT OF CODE SEARCH STEP SIZE
A. Effect of Code Search Step Size on Autocorrelation Values
The traditional analysis of BOC signal acquisition performance focuses on the Receiver Operating Characteristic (ROC) curves, without considering the effect of the code search step size. However, the code search step size has direct influence on signal acquisition process, which can be assessed by the autocorrelation value firstly. The effect on autocorrelation value for different scenarios will be analyzed in this paper. The best case value is the highest maximum correlation that can be obtained for any given code delay. This value always corresponds to the peak of the autocorrelation function. The worst case value is the lowest maximum correlation obtained by stepping through the autocorrelation function with steps of a given size. The best case and the worst case are chosen to obtain an insight into the sharpness of the main peak and the effect of the side peaks [11].
In Fig. 6, the effect of the code search step size on autocorrelation values for the direct acquisition method is
depicted, using infinite bandwidth. The best case values for SinBOC(1,1), SinBOC(10,5) and CosBOC(15,2.5) are all 1 but the worst case values are different. For the CosBOC(15,2.5) case, not only is the degradation more steep, but also there are local minimum points produced by the regularly spaced autocorrelation nulls between side peaks, as shown in Fig. 1. A typical code search step size of 0.5 experiences a loss of up to 27 dB compared to the best case and up to 12 dB loss compared to SinBOC(1,1) correlation waveform with the same search step.
25 30 35 40 0
0.2 0.4 0.6 0.8 1 1.2 1.4 1.6 1.8 2
C/N0(dB-Hz)
C
o
de S
ear
c
h S
tep
S
iz
e(
C
hi
ps
)
0.1 0.2 0.3 0.4 0.5 0.6 0.7 0.8 0.9 1
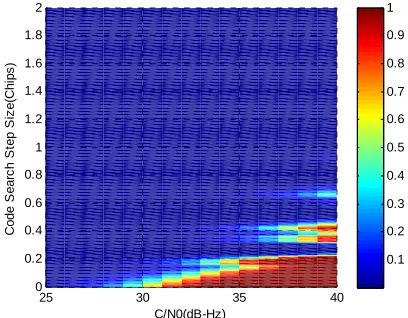
Figure 12. Worst case probability of detection for SinBOC(10,5) using the direct acquisition method
25 26 27 28 29 30 31 32 33 34 35 36 37 38 39 40 0
0.2 0.4 0.6 0.8 1
C/N0(dB-Hz)
Pr
ob
a
b
il
it
y
of
D
e
te
c
ti
o
n(
Pd
)
SCPC:Theory SCPC:MC BPSK-like:Theory BPSK-like:MC Direct:Theory
K=20
K=5
Figure 9. Best case probability of detection for SinBOC(1,1)
25 26 27 28 29 30 31 32 33 34 35 36 37 38 39 40 0
0.2 0.4 0.6 0.8 1
C/N0(dB-Hz)
P
robab
il
it
y of
D
et
e
c
ti
on(
Pd
)
SCPC:Theory SCPC:MC BPSK-like:Theory BPSK-like:MC Direct:Theory
K=20 K=5
Figure 10. Best case probability of detection for SinBOC(10,5)
25 26 27 28 29 30 31 32 33 34 35 36 37 38 39 40
0 0.2 0.4 0.6 0.8 1
C/N0(dB-Hz)
P
robabi
li
ty
of
D
et
ec
ti
on(
Pd
)
SCPC:Theory SCPC:MC BPSK-like:Theory BPSK-like:MC Direct:Theory
K=5 K=20
Figure 11. Best case probability of detection for CosBOC(15,2.5) method and the SCPC method degrade slowly and
smoothly with increasing search step size. As a result of the limited bandwidth and the cross-correlation loss, the best case correlation values for both methods are smaller than 1.
B. Probability of Detection for the Best Case
In this section, the probability of detection for the best case is evaluated for the acquisition methods described so far. The traditional analysis of BOC signal acquisition performance mainly focuses on the probability of detection for the best case. In all simulations, we used a constant Pfa of
3
10− . A PRN code length 1023 and
K
non-coherent integrations have been used, and the coherent integration time is equal to 1ms.The Fig. 9 represents the best case probability of detection (Pd) for SinBOC(1,1). It is necessary to point
out that the acquisition performance of the BPSK-like method seems to be much higher than the performance of the SCPC method. A difference of 0.8dB-Hz on the Carrier Power to Noise Density Ratio (C N/ 0) can be
observed at equal value of Pd. The performance obtained
with Monte Carlo simulations (indicated with “MC”) and the theoretical ones (indicated with “Theory”) coincides, thus validating the theoretical analysis. The detection probability of SinBOC(10,5) and CosBOC(15,2.5) with the BPSK-like method and the SCPC method has been shown respectively in Fig. 10 and Fig. 11. It should be noticed that these techniques for CosBOC(15,2.5) have similar performance shown in Fig. 11. The different performance with BOC(m n, ) signals can be attributed to the same limited filter bandwidth ( 2(fsc+ fc)) for both techniques to a great extent. As regard to the reconstructed correlation functions (presented in Fig. 4 and Fig. 5), this result was expected.
For the same probability of detection, the direct acquisition method results in an improvement in C/N0 of about 2dB compared with unambiguous acquisition methods in the best case scenario. As regard to the ACFs (presented in Fig. 1) and the reconstructed correlation functions (presented in Fig. 4 and Fig. 5), this result was expected. Moreover, it is worth mentioning that among all these BOC signals the direct acquisition method has the same best case probability of detection. This is duo to the same best case correlation value for these signals
C. Probability of Detection for the Worst Case
The probability of detection for the worst case will be assessed for the acquisition methods discussed so far. The probability of detection for the worst case has relation to the worst case correlation value. In our analysis and simulations, we considered a constant
K
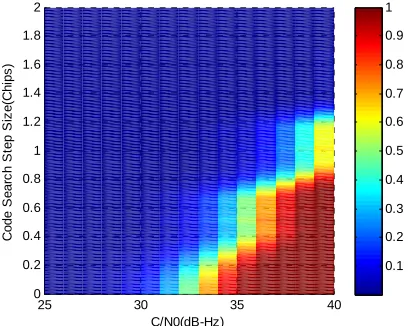
of 20 hereafter.The worst case probability of detection for SinBOC(10,5) using different acquisition techniques is shown in Fig.12, Fig. 13 and Fig. 14. In order to highlight the effect of the code search step size, it is illustrated with three-dimensional top view figures. It should be noticed that the probability of detection for SinBOC(10,5) using
25 30 35 40 0
0.2 0.4 0.6 0.8 1 1.2 1.4 1.6 1.8 2
C/N0(dB-Hz)
C
o
d
e
Se
a
rc
h
Ste
p
Si
z
e
(C
h
ip
s
)
0.1 0.2 0.3 0.4 0.5 0.6 0.7 0.8 0.9 1
Figure 13. Worst case probability of detection for SinBOC(10,5) using the BPSK-like method
25 30 35 40
0 0.2 0.4 0.6 0.8 1 1.2 1.4 1.6 1.8 2
C/N0(dB-Hz)
C
ode
S
e
arc
h S
tep
S
iz
e(
C
hi
ps
)
0.1 0.2 0.3 0.4 0.5 0.6 0.7 0.8 0.9 1
Figure 17. Worst case probability of detection for CosBOC(15,2.5) using the SCPC method
25 30 35 40
0 0.2 0.4 0.6 0.8 1 1.2 1.4 1.6 1.8 2
C/N0(dB-Hz)
C
o
de
S
e
ar
c
h S
tep
S
iz
e
(C
h
ip
s
)
0.1 0.2 0.3 0.4 0.5 0.6 0.7 0.8 0.9 1
Figure 15. Worst case probability of detection for CosBOC(15,2.5) using the direct acquisition method
25 30 35 40
0 0.2 0.4 0.6 0.8 1 1.2 1.4 1.6 1.8 2
C/N0(dB-Hz)
C
ode S
ear
c
h S
tep
S
iz
e(
C
hi
ps
)
0.1 0.2 0.3 0.4 0.5 0.6 0.7 0.8 0.9 1
Figure 16. Worst case probability of detection for CosBOC(15,2.5) using the BPSK-like method
25 30 35 40
0 0.2 0.4 0.6 0.8 1 1.2 1.4 1.6 1.8 2
C/N0(dB-Hz)
C
o
d
e
Se
a
rc
h
St
e
p
Si
z
e
(C
h
ip
s
)
0.1 0.2 0.3 0.4 0.5 0.6 0.7 0.8 0.9 1
Figure 14. Worst case probability of detection for SinBOC(10,5) using the SCPC method
is a low probability of detection region for the code search step size around 0.25 chips. The probability of detection using the BPSK-like method and the SCPC method, in general, is higher than the probability of detection using the direct acquisition method. Moreover, both techniques allow larger code search step size (up to 1 chip) than the direct acquisition technique. The worst
case probability of detection for CosBOC(15,2.5) is presented in Fig.15, Fig. 16 and Fig. 17. For the direct acquisition method, the worst case probability of detection for CosBOC(15,2.5) frequently fluctuates and gradually diminishes with increasing code search step size. Compared with the direct acquisition approach, the BPSK-like approach and the SCPC method both result in improvement in the probability of detection for CosBOC(15,2.5).
D. Probability of Detection for the Average Case
As discussed above, the best case and the worst case correspond to the maximum and minimum correlation values of a given search step size. In fact, we will not always encounter these cases. The truth value will have a uniform distribution in
[
R
worst,
R
best]
, whereR
worstandbest
R
denote the worst case correlation value and the best case correlation value of a given search step size respectively. By using the theorem of the total probability of continuous random variables [12], the average probability of detection (P
d ) can be expressed as1
( )
best
worst
R
d d
best worst R
P
P x dx
R
R
=
25 30 35 40 0
0.2 0.4 0.6 0.8 1 1.2 1.4 1.6 1.8 2
C/N0(dB-Hz)
C
ode S
ear
c
h
S
tep
S
iz
e(
C
h
ips
)
0.1 0.2 0.3 0.4 0.5 0.6 0.7 0.8 0.9 1
Figure 18. Average probability of detection for CosBOC(15,2.5) using the direct acquisition method
25 30 35 40
0 0.2 0.4 0.6 0.8 1 1.2 1.4 1.6 1.8 2
C/N0(dB-Hz)
C
o
de
S
e
arc
h
S
te
p
S
iz
e
(Chi
p
s
)
0.1 0.2 0.3 0.4 0.5 0.6 0.7 0.8 0.9 1
Figure 20. Average probability of detection for CosBOC(15,2.5) using the SCPC method
25 30 35 40
0 0.2 0.4 0.6 0.8 1 1.2 1.4 1.6 1.8 2
C/N0(dB-Hz)
C
od
e S
ear
c
h
S
tep
S
iz
e(
C
hi
ps
)
0.1 0.2 0.3 0.4 0.5 0.6 0.7 0.8 0.9 1
Figure 19. Average probability of detection for CosBOC(15,2.5) using the BPSK-like method
25 30 35 40
0 0.2 0.4 0.6 0.8 1 1.2 1.4 1.6 1.8 2
C/N0(dB-Hz)
C
od
e S
earc
h S
tep
S
iz
e(
C
hi
ps
)
-15 -10 -5 0 5
Figure 21. Ratio of the average probability of detection for the BPSK-like method and for the direct acquisition method
25 30 35 40
0 0.2 0.4 0.6 0.8 1 1.2 1.4 1.6 1.8 2
C/N0(dB-Hz)
C
o
de
S
e
ar
c
h
S
te
p S
iz
e(
C
hi
p
s
)
-15 -10 -5 0 5
Figure 22. Ratio of the average probability of detection for the SCPC method and for the direct acquisition method
where
P
d is the probability of detection of a given correlation value, as in (28).Without loss of generality, just the average probability of detection for the CosBOC(15,2.5) is analyzed in this section, as shown in Fig. 18, Fig. 19, and Fig. 20. Compared with the best case and the worst case, the average probability of detection is in between. Fig. 21 and Fig. 22 illustrate the ratio of the average probability of detection for unambiguous acquisition techniques (BPSK-like and SCPC) and for the direct acquisition technique in decibel (dB). As clearly shown in Fig. 21 and Fig. 22, unambiguous acquisition techniques result in an improvement in the average probability of detection for CosBOC(15,2.5) at moderate and high C/N0 values, when the code search step size is larger than 0.3 chips. For a typical code search step size of 0.5 chips, the average probability of detection for unambiguous acquisition methods outperforms the direct acquisition method by about 4dB. Finally it is worth mentioning that the BPSK-like method and the SCPC method seem to have similar average probability of detection.
IV.CONCLUSIONS
In this paper, the acquisition performance analysis of BOC signal considering the code search step size has
ACKNOWLEDGMENT
This work was supported by the Open Fund of Key Laboratory of Precision Navigation and Technology (No.2009PNTT11), National Time Service Center, CAS.
REFERENCES
[1] J. W. Betz, “The offset carrier modulation for GPS
modernization,” Proceedings of ION National Technical Meeting, Institute of Navigation, January 1999, pp. 639– 648.
[2] J. W. Betz, “Design and performance of code tracking for
the GPS M code signal,” Proceedings of ION GPS 2000, Institute of Navigation, September 2000, pp. 2140–2150.
[3] P. Fishman and J. W. Betz, “Predicting performance of
direct acquisition for the M-code signal,” Proceedings of ION National Technical Meeting, Institute of Navigation, January 2000, pp. 574–582.
[4] J. W. Betz and P. Capozza, “System for direct acquisition
of received signals,” US Patent Application Publication 2004/0071200 A1, Apr 2004.
[5] N. Martin, V. Leblond, G. Guillotel and V. Heiries,
“BOC(x,y) signal acquisition techniques and performances,” Proceedings of ION GPS/GNSS 2003, Institute of Navigation, September 2003, pp. 188–198.
[6] V. Heiries, D. Roviras, L. Ries and V. Calmettes,
“Analysis of non ambiguous BOC signal acquisition performance,” Proceedings of ION GNSS 17th International Technical Meeting of the Satellite Division, Institute of Navigation, September 2004, pp. 2611–2622.
[7] P. W. Ward, “A design technique to remove the correlation
ambiguity in Binary Offset Carrier (BOC) spread spectrum signals,” Proceedings of ION 59th Annual Meeting/CIGTF 22nd Guidance Test Symposium, Institute of Navigation, June 2003, pp. 886–896.
[8] A. Burian, E. S. Lohan, and M. Renfors, “BPSK-like
methods for hybrid-search acquisition of Galileo signals,” Proceedings of the IEEE International Conference on Communications (ICC '06), vol. 11, June 2006, pp. 5211– 5216.
[9] T. H. Ta, F. Dovis, R. Lesca, and D. Margaria,
“Comparison of joint data/pilot high-sensitivity acquisition
strategies for indoor Galileo E1 signal,” Proceedings of ENC-GNSS 2008, April 2008, paper 51.
[10]D. Borio, “A statistical theory for GNSS signal
acquisition,” Ph. D. dissertation, Politecnico di Torino, March 2008, pp. 20–61.
[11]N. C. Shivaramaiah and A. G. Dempster, “An analysis of
Galileo E5 signal acquisition strategies,” Proceedings of ENC-GNSS 2008, April 2008, paper 144.
[12]D. P. Bertsekas and J. N. Tsitsiklis, Introduction to
Probability, 2nd ed., Nashua, NH: Athena Scientific, 2008, pp. 28–30.
ZaiXiu Yang was born in Hebei, China, in 1981. He received the Master degree in communication and information system, in 2007 from Harbin Engineering University, Harbin, China. He is currently a doctoral student in the School of Electronic and Information Engineering at Beijing University of Aeronautics and Astronautics, Beijing, China. His research interests include satellite navigation receiver design, base band signal processing and software receiver development.
Zhigang Huang was born in Hebei, China, in 1962. He
received the Ph.D. degree in communication and information system, in 2002 from Beijing University of Aeronautics and Astronautics, Beijing, China. He is now a professor in the School of Electronic and Information Engineering at Beijing University of Aeronautics and Astronautics, Beijing, China. His research areas include radio navigation and satellite navigation.
Shengqun Geng was born in Henan, China, in 1973. He