*Corresponding Author:
Tekade B.W.,
Department of Pharmaceutics,
TVES’s Honorable Loksevak Madhukarrao Chaudhari College of Pharmacy, Faizpur, (India)
Email: [email protected]
Research Article
Development and
Invitro
Evaluation of Azithromycin Microspheres by
Solvent Evaporation Technique
Bharat W. Tekade*, Umesh T.Jadhao, Vinod M.Thakre, Kundan P. Chaudhari, Preeti R. Meshram, M. P. Patil
Department of Pharmaceutics, TVES’s Honorable Loksevak Madhukarrao Chaudhari College of Pharmacy, Faizpur, India.
1. INTRODUCTION
Microencapsulation is a process whereby relatively thin coating of polymers are applied to sm all particles of solid or droplets of liquid and dispersions. The microencapsulation processes produce small particles ranging in size from 1 to 1000 µm. microcapsules are made of one or multiple core substances (solid or liquid) that are surrounded by a distinct capsule wall, whereas micromatrices are polymeric matrices in which the encapsulated substances are homogeneously dispersed1,2. Azithromycin is a macrolide antibiotic that has been used for more than a decade to treat urinary tract, bronchial tract, lungs and sinuses infections. The unique pharmacokinetics of Azithromycin-rapid absorption and extensive distribution in tissue allows for short 3-day (500 mg/day for 3 days) or 5-day (500 mg on day 1 followed by 250 mg on day 2-5) course of therapy. Preclinical studies have shown that Azithromycin efficacy related to AUC/MIC ratio that improved efficacy could result if the therapeutic courses were given all at once as single dose. Azithromycin when incorporated into sustained release microspheres, release the drug slowly. And the drug is released into the lower gastrointestinal tract, reducing gastrointestinal side-effects, and allowing for a higher dose to be administered. The unique pharmacological properties and extremely long half-life of Azithromycin make this drug well suited to single-dose administration. Azithromycin dihydrate is insoluble in water and also bitter taste by making in microsphere formulation taste masking can be done, so fast onset of action achieved and potential for avoidance of hepatic first pass metabolism of susceptible drug and causes increase in the bioavailability.
Azithromycin has low bioavailability also having large dose which may cause GI side effect hence, by making in sustained release form it will released in lower GI tract and minimizes side effect. Aim of this study was an attempt taken for preparation of sustained released microspheres using ethyl cellulose, which will reduce the dosing frequency3.
2. MATERIALS AND METHODS
Azithromycin and Ethyl cellulose (50 cps) was obtained as gift sample by Zim Laboratories Ltd, Nagpur (Maharashtra) India. All other materials and solvents used were of analytical grade.
2.1 Formulation of Microspheres
The formulations were prepared by using different solvents (ethyl acetate dichloromethane, chloroform) and different drug: polymer ratio (1:1, 1:1.5, 1:2) in each solvent. In the O/W emulsion solvent evaporation method, the polymer (ethyl cellulose) was dissolved in internal organic phase or solvent. Accurately weighed quantity 1g of Azithromycin was dispersed or dissolved in the polymer solution. This resulting mixture was poured slowly with stirring into 100 ml of a 0.015% w/v aqueous solution of polyvinyl alcohol. The emulsion was then stirred continuously at 700 rpm for 1 hr to evaporate the solvent. The microspheres were recovered by vacuum filtration, washed with 200 ml of deionized water and dried at room temperature4, 5.
S. No. Formulation
code
Drug : Polymer Ratio
Internal Organic Phase
1 A1 1:1
Chloroform
2 A2 1:1.5
3 A3 1:2
4 B1 1:1
Dichloromethane
5 B2 1:1.5
6 B3 1:2
7 C1 1:1
Ethyl Acetate
8 C2 1:1.5
9 C3 1:2
2.2 Evaluation of Microspheres
2.2.1 Angle of Repose
Angle of repose is defined as the maximum angle possible between the surface of pile of powder and horizontal plane. The angle of repose for the microspheres of each formulation was determined by the funnel method6. The microspheres were allowed to flow out of Abstract
The present investigation was concerned with formulation and evaluation of microspheres for Azithromycin using Ethyl cellulose as a release retarded material by solvent evaporation technique. Nine different batches of Microspheres were prepared using three different solvents at three different Drug: polymer ratios (1:1, 1:1.5, 1:2) The microspheres were characterized for drug content, percentage yield, particle size analysis and surface morphology. The results of all the physiochemical tests of all formulations were found to be favorable. The in-vitro % drug release was found to be in range of 59.13 to 80.13 %. At the end of 12 hrs. Optimized formulation C3 was evaluated for FTIR, XRD and SEM. XRD and FTIR studies showed that the nature of pure drug Azithromycin remains unaffected till the completion of process of microspheres formation. SEM photographs showed that the Floating microspheres were spherical in nature with smooth surface and uniform distribution of the drug within the microsphere.The in vitro data were fitted to different Kinetic order. The formulated tablets exhibited Fickian to anomalous transport drug release kinetics approaching Zero–order as the value of release rate exponent (n) varied between 0.524 to 0.784.
ISSN (Online) 2249-6084 (Print) 2250-1029
International Journal of Pharmaceutical and
Phytopharmacological Research (eIJPPR)
[Impact Factor – 0.7826]
Journal Homepage: www.eijppr.com
Article info
Article History: Received 22 August 2013 Accepted 29 August 2013
Keywords:
the funnel orifice on a plane paper kept on the horizontal surface. It forms a pile of microspheres on the paper. The angle of repose was calculated by substituting the values of the base radius ‘R’ and pile height ‘H’ in the following equation
Tan = H /R
Where, H = Pile Height. R = Radius of Pile.
2.2.2 Bulk Density
Bulk density of all batches of microspheres was determined by pouring gently 2 g of sample through a glass funnel into a 10 ml graduated cylinder. The volume occupied by the sample was recorded. Bulk density was calculated as per given formula:
Weight of sample Bulk density = ---
Volume occupied by the sample
2.2.3 Tapped Density
The tapped density was determined by pouring 2 g of microspheres through a glass funnel into a 10 ml graduated cylinder. The cylinder was tapped from height of 2 inches until a constant volume was obtained. Volume occupied by the sample after tapping was recorded .The values for tapped density was calculated as per given formula:
Weight of sample Tapped density (g/ml) = ---
Volume occupied by the sample
2.2.4 Compressibility Index
The compressibility indices of the formulation blends were determined using Carr’s compressibility index formula.
Tapped density – Bulk density Carr’s Index = --- X 100 Taped density
2.2.5 Hausners Ratio
It provides an indication of the degree of densification which could result from vibration of feed hopper. Lower the Hausner ratio better is the flowability. It was calculated as per given formula.
Tapped density Hausner ratio = --- Bulk density
2.2.6 Determination of Particle Size
The particle size was determined using stage micrometer. The diameters of about 300 microspheres were measured and the average particle size was determined7.
2.2.7 Estimation of Drug Loading
For determination of drug content, microspheres equivalent to 100 mg were weighed and dissolved in 100ml of acetone. After suitable dilutions were with phosphate buffer (pH 6.0), the resulting solution was analysed spectrophotometrically at 244 nm8,9.
Actual drug content Encapsulation efficiency (%) = --- × 100 Theoretical drug content
Weight of drug
Drug loading (%) = --- × 100 Weight of microspheres
Weight of microspheres
% Yield = --- × 100 Total expected weight of drug and polymer
2.2.8 In-vitro Dissolution Study
Accurately weighed microspheres equivalent to 200 mg of Azithromycin were taken in muslin cloth and it was kept in baskets. Dissolution study was carried out in phosphate buffer pH 6.0 at 50 rpm at temp 37 ± 0.5°c. During dissolution study 10 ml of aliquot was withdrawn at a time intervals of 1 to 12 hr and same was replaced with equal volume of fresh medium. The withdrawn samples were filtered through Whatmann filter paper and
absorbances were measured at 244 nm. Drug concentration in the samples was determined from the calibration curve10.
2.3 Characterization of Microspheres
2.3.1 Differential Scanning Calorimetry
The DSC measurem ents were performed on a differential scanning colorimeter with thermal analyzer. All accurately weighed samples (about 10 mg of Azithromycin, ethyl cellulose, physical mixtures, and formulation) were placed in sealed aluminium pans, before heating under nitrogen flow (10 ml/min) at a scanning rate of 20 °c per min from 100 to 300 °c an empty aluminum pan was used as reference12,13.
2.3.2 X-Ray Diffractometry
The powder X-ray diffraction pattern of Azithromycin and polymer were obtained using Phillips X-ray diffractometer with a Ni-filtered CuKα-radiation at a scanning speed of 10 ° /min at 2θ.The graph was plotted in 2 theta angle versus intensity count14.
2.3.3 Surface Morphology
The microspheres were coated with Platinum by ion sputtering using Autofine coater. The microspheres were kept on the sample holder and the scanning electron micrographs were taken15.
2.3.4 Stability studies
The optimized formulation was subjected to study the effect of temperature. The study was carried out by storing the microspheres in glass bottle 400 C± 20 C and 75%±5% RH for 30 days. These samples were collected on 7th, 14th, 21st, 28th day and analyzed for changes drug content and in-vitro dissolution studies18.
2.3.5 Kinetic Treatment to Dissolution Data
The dissolution data for all formulations was fitted to various drug release kinetic models like Zero order, First order, Higuchi Matrix and Korsemeyer Peppas, Hixon-Crowel model. Rate constants (K), correlation coefficients (R) obtained for various models. And Release exponent (n) values obtained in Korsemeyer Peppas model was studied16, 17, 19.
3. RESULTS AND DISCUSSION
IR spectra for Azithromycin, ethyl cellulose and physical mixture of Azithromycin and ethyl cellulose are given in fig.1-3. Major functional groups of Azithromycin (CH3-N Stretching) at 1377, (CH2 Scissoring) at 1454,(C=O stretching) at 1720,(COOH) at 2891, (C-H Stretching of methyl and methylene) 2912,(O-(C-H Stretching Vibration) at 3560 can be seen in spectra of individual drugs as well as in spectra of physical mixture. So there is no interaction between Azithromycin and ethyl cellulose.
Figure-1: IR spectrum of Azithromycin
Figure-3: Azithromycin + Ethyl cellulose
All the formulations show angle of repose value in the range of 15.22 - 20.42. The values for bulk density were found in the range of 0.333 to 0.455. Tapped density was found to range from 0.380 to 0.536. Compressibility index were found in the range of 11.76 to 15.11 respectively. Hausner’s ratio was ranging from 1.13 to 1.17, i.e., all the preparation showed that they had good flow properties.
Table 2: Physical parameters of Azithromycin Microsphere
Formulation code Angle of Repose (θ) Bulk Density
(g/ml)
Tapped Density (g/ml)
Carr’s Compressibility
Index (%) Hausner’s Ratio
A1 16.19±0.754 0.429±0.039 0.504±0.064 14.88±0.024 1.17±0.0675
A2 15.22±0.534 0.405±0.024 0.462±0.036 12.33±0.032 1.14±0.064
A3 15.51±0.633 0.391±0.024 0.445±0.014 12.13±0.075 1.13±0.023
B1 17.19±0.644 0.423±0.035 0.490±0.064 13.67±0.075 1.15±0.046
B2 18.36±0.352 0.333±0.063 0.380±0.047 12.36±0.035 1.14±0.067
B3 19.41±0.656 0.455±0.062 0.536±0.024 15.11±0.013 1.17±0.045
C1 19.72±0.353 0.352±0.044 0.414±0.042 14.97±0.064 1.17±0.025
C2 20.38±0.755 0.431±0.023 0.507±0.045 14.99±0.034 1.17±0.052
C3 20.42±0.353 0.450±0.035 0.510±0.074 11.76±0.042 1.13±0.025
As the polymer concentration increases, viscosity also increases which influences the interaction between disperse phase and dispersion medium that affects the size distribution of particle. Result indicated that increase in the amount of polymer concentration increases relative viscosity which results into increased mean particle size. The average particle size of microcapsules is found to be within 112.546 to 171.342 µm.Results were given in figure 4.
Figure-4: Graphical presentation of average particle size
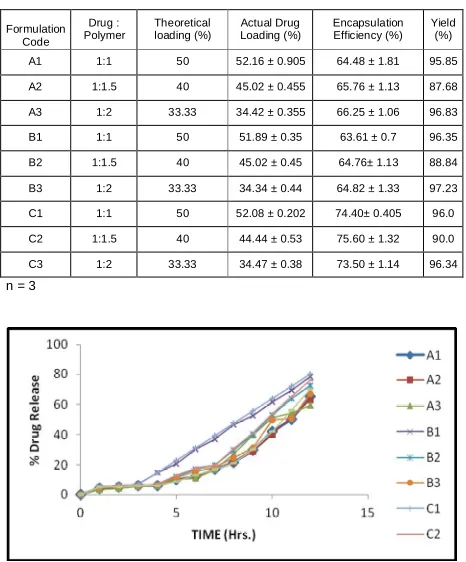
The percent encapsulation efficiency of ethyl cellulose microsphere shown in table 3. The drug: polymer ratio showed significant effect on the encapsulation efficiency of microsphere. The increase in concentration of polymer showed the increase in drug encapsulation efficiency. The microsphere formulated using ethyl acetate as internal organic phase or solvent showed better encapsulation efficiency than other formulations. The % encapsulation efficiency is found to be in the range of 63.61 ± 0.7to 75.60 ± 1.32 %.
From the in vitro drug release study it can be seen that the C1 batch showed sustained cumulative % drug release 80.13% in 12 hrs. Although formulation A3 showed cumulative % drug release of 59.13 % in 12 hrs and formulation B3 showed cumulative % drug release of in 67.18 % in 12 hrs, their release was insufficient. As the polymer concentration increased the drug release was decreased. The batches of microsphere formulated using ethyl acetate as solvent showed higher release rate than other solvents. The batches of microsphere formulated with drug: polymer ratio 1:1 showed higher release rate than other ratios. Results were Given in figure 5.
Table 3: Data for Percentage yield, percentage loading and encapsulation efficiency of microspheres
Formulation Code
Drug : Polymer
Theoretical loading (%)
Actual Drug Loading (%)
Encapsulation Efficiency (%)
Yield (%)
A1 1:1 50 52.16 ± 0.905 64.48 ± 1.81 95.85
A2 1:1.5 40 45.02 ± 0.455 65.76 ± 1.13 87.68
A3 1:2 33.33 34.42 ± 0.355 66.25 ± 1.06 96.83
B1 1:1 50 51.89 ± 0.35 63.61 ± 0.7 96.35
B2 1:1.5 40 45.02 ± 0.45 64.76± 1.13 88.84
B3 1:2 33.33 34.34 ± 0.44 64.82 ± 1.33 97.23
C1 1:1 50 52.08 ± 0.202 74.40± 0.405 96.0
C2 1:1.5 40 44.44 ± 0.53 75.60 ± 1.32 90.0
C3 1:2 33.33 34.47 ± 0.38 73.50 ± 1.14 96.34
n = 3
Figure-5: % Cumulative drug release of microspheres
diffusion exponent (n) varying from 0.524 to 0.784. From the n values of all formulations it can be concluded that as the concentration and viscosity of polymer was increased the value of diffusion exponent also increases. This was because as the concentration of polymer increases, the rate of dissolution of disentangled chains decreases and diffusion path length of
aqueous channel increases. This leads to increase in diffusion exponent value and results in shifting of the mechanism of drug release from fickian diffusion to anomalous transport thus overlapping of different types of phenom ena, potentially including drug diffusion and polymer swelling.
Table 4: Drug release kinetic parameters of microspheres.
Batch Code
Zero Order First Order Matrix Korsemeyer Peppas Hixon- Crowel
(K) (R2) (K) (R2) (K) (R2) (K) (R2) (n) (K) (R2)
A1 8.447 0.914 -0.166 0.994 24.71 0.994 22.68 0.995 0.539 -0.042 0.990 A2 7.257 0.950 -0.120 0.993 21.09 0.988 17.06 0.996 0.600 -0.033 0.992 A3 6.432 0.966 -0.975 0.992 18.62 0.980 14.14 0.996 0.629 -0.028 0.994 B1 7.708 0.981 -0.139 0.977 22.19 0.968 14.77 0.994 0.692 -0.037 0.992 B2 6.526 0.984 -0.109 0.993 18.76 0.965 11.48 0.997 0.734 -0.028 0.996 B3 5.725 0.984 -0.081 0.989 16.43 0.959 9.042 0.996 0.785 -0.024 0.996 C1 9.244 0.891 -0.206 0.985 27.14 0.996 25.75 0.998 0.524 -0.050 0.993 C2 8.511 0.931 -0.166 0.991 24.84 0.993 19.69 0.998 0.615 -0.043 0.995 C3 7.633 0.968 -0.133 0.994 22.08 0.978 15.51 0.997 0.668 -0.036 0.994
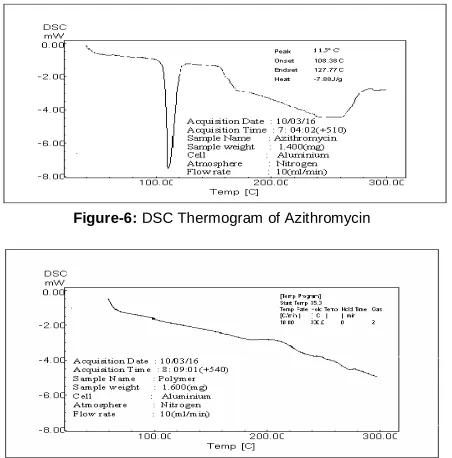
For the structural, crystal and physical state characterization, DSC studies of Azithromycin, Ethyl cellulose, their physical mixture and microspheres were carried out. The DSC thermograms are given Figure 6, 7, 8.And 9 show the DSC curves of Azithromycin, ethyl cellulose, physical mixture and microspheres (C1) respectively. DSC curve of Azithromycin shows a single endothermic peak at 121 °c, due to melting of the drug. Optimized formulation C1 which contains Azithromycin and ethyl cellulose, the thermogram indicates characteristic peaks for melting of Azithromycin at 121 °c. This indicates absence of drug - polymer interactions. This observation further supports the IR spectroscopy results.
Figure-6: DSC Thermogram of Azithromycin
Figure-7: DSC Thermogram of Ethyl Cellulose
Figure-8: DSC Thermogram of Physical mixture of Azithromycin+Ethyl Cellulose
Figure-9: DSC Thermogram of Microspheres (C1)
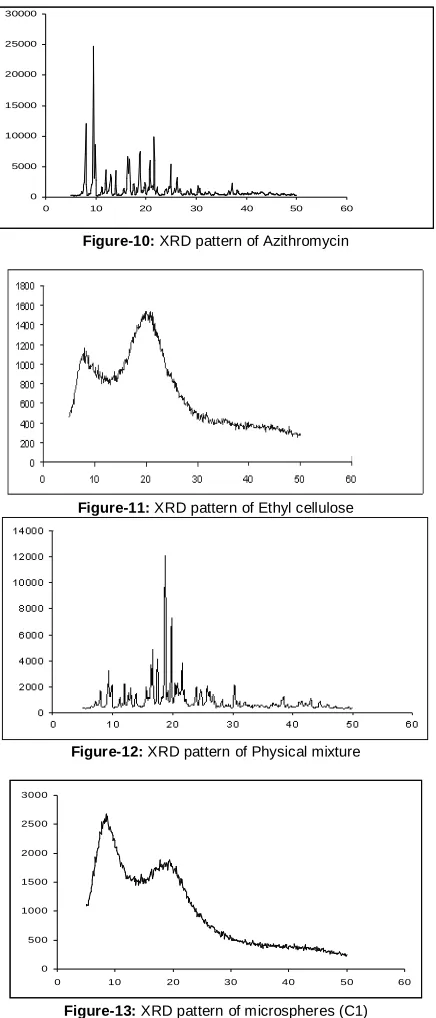
Figure 10, 11, 12, 13 represents the XRD diffraction pattern of Azithromycin, Ethyl cellulose, their physical mixture and microspheres (C1). The XRD scan of Azithromycin showed intense peaks of crystallinity. Diffractogram of azithromycin showed high
0 5000 10000 15000 20000 25000 30000
0 10 20 30 40 50 60
Figure-10: XRD pattern of Azithromycin
Figure-11: XRD pattern of Ethyl cellulose
Figure-12: XRD pattern of Physical mixture
0 500 1000 1500 2000 2500 3000
0 10 20 30 40 50 60
Figure-13: XRD pattern of microspheres (C1)
Figure No: 14, 15 shows the SEM photographs of various images of prepared formulation. SEM photographs showed that the microspheres were spherical in nature and had a smooth surface. SEM photographs revealed the absence of crystals of drug on the surface of microspheres and uniform distribution of the drug within the microspheres.
Accelerated stability studies (AST) was carried for optimized batch (C1) by exposing it to 40 0 C + 20 C, 75% + 5% RH for one month and analyzed the samples at the interval of 7,14,21,30 days and the samples was analyzed for drug content and in-vitro dissolution study. The stability studies show that there were no significant changes in observed drug content and percent cumulative drug release18.
Figure-14: External surface of microsphere
Figure-15: Whole image of microsphere
Table 5: Stability studies parameters
Parameters
Days
7 14 21 30
Drug content (%)
74.41 ± 1.32
73.95 ± 1.30
74.52 ± 1.31
74.14 ± 1.34 In- vitro dissolution
study
80.11 ± 0.24
79.34 ± 0.23
79.55 ± 0.21
80.55 ± 0.22
5. CONCLUSION
From the investigation carried out and results obtained, it was observed that the % of drug released from microspheres was sustained. As the GI side effects of Azithromycin are related to its high dose which can be minimized by formulating as microspheres. It would also helps to improve bioavailability because of absorption window and microencapsulation helps to mask the bitter taste of drug. Hence from this investigation, we can propose that the objective of the study was achieved.
REFERENCES
1) Barar F.S.K., In; Essential of Pharm acotherapeutics, 4th edition. New Delhi, S Chand and Company, 2007; p. 534. 2) Behera B.C., Sahoo S.K., Dhal S., Barik B.B., Gupta B. K., Chracterization of Glipizide-Loaded Poly methacrylate Microspheres Prepared by an Emulsion Solvent Evaporation Method. Trop. J. Pharm. Research 2008, 7(1):879-885.
3) Chien Y.W., Novel Drug Delivery System, 2nd edition. New York, Marcel Dekker Inc, 1992; 50:pp.161-172. 4) Deore B.V., Mahajan H.S., Deore U.V., Development and
characterization of sustained release microspheres by emulsion solvent diffusion method. Int. J. Pharm. 2009, 3:634-642.
6) Methews B. R., Regulatory aspects of stability testing in Europe, Drug Dev.Ind.Pharm., 1999, 25: 831-856. 7) Lachman, L., Libermann, H. and Kanig, J., The Theory
and Practice of Industrial Pharmacy, 3rd edn. Varghese Publication, Bombay, 1991, pp. 183-184.
8) Khandelwal, K.R., Practical Pharmacognosy Techniques and Experiments. 11th edition, Nirali Prakashan, Pune, 2004, p. 42.
9) USP NF 30, United States Pharmacopoeial Convention, Rockville, MD, 2007, p. 2350.
10) Mishara, S. K., Pathak, K., Formulation and evaluation of oil entrapped gastroretentive floating gel beads of loratadine. Acta Pharm. 2008, 58, 187-197.
11) Park, K., Yeo, Y., Microencapsulation technology. In: Swarbrick, J., Boylon, J. C,. (Eds.), Encyclopedia of Pharmaceutical Technology. 3rd edn. vol. 4. Marcel Dekker Inc. New York, 2007, pp. 2315- 2327.
12) Sawant H.H., Mhatre V. K., Tekade B.W., Thakare V.M., Patil V.R., Formulation, evaluation and characterization of aceclofenac modified release microcapsules. Int. J. Pharm. Pharm. Sci., 2011, 3, 4, 221-228.
13) Schimdt, P., Secondary electron microscopy in pharmaceutical technology. In: Swarbrick J., Boylon J.C. (Eds.), Encyclopedia of Pharmaceutical Technology. 3rd edition, vol. 5. Marcel Dekker Inc. New York, 2007,pp. 3217- 325.
14) Duerst, M., Spectroscopic methods of analysis: infrared spectroscopy. In: Swarbrick J., Boylon J.C. (Eds.), Encyclopedia of Pharmaceutical Technology. 3rd edition, vol. 5. Marcel Dekker Inc. New York, 2007, p. 3405- 3418.
15) Skoog, D. A., Holler,F. J., Niem an, T.A., Principles of Instrumental Analysis. 5 th edition. Sounder’s College Publishing, 2004, pp. 798- 808.
16) Mali S, Nighute A, Deshmukh V, Gonjari I, Bhise S, Microcrystals: For Improvement Of Solubility And Dissolution Rate Of Lamotrigine, Int.J.Ph.Sci., May-Aug 2010, 2(2), 515-521.
17) Schimdt P. Secondary electron microscopy in pharmaceutical technology. In: Swarbrick J, Boylon J.C. (Eds.). Encyclopedia of Pharmaceutical Technology, 3rd edition. NewYork, Marcel Dekker Inc, 2007; 5:3217- 325. 18) Higuchi Mechanism of sustained action medicament, Theoretical analysis of rate release of solid drugs dispersed in solid matrices, J. Pharmsci. 1963, 52:1145-1149.
19) Korsmeyer R.W., Gunny R, Peppas N.A., Mechanism of solute release from porous hydrophilic polymers, Int. J. Pharmaceutics, 1983, 15: 25-35.