Impact of Technology on Employees in Banking Sector - A Case
Study of State Bank of India Chittakula Branch, Karwar
– Dr. Ramesh.Onkareppa.Olekar*
Introduction
The banking industry in India is undergoing a major transformation due to changes in economic conditions and deregulation. These multiple changes happening one after the other has a ripple effect on a bank trying to graduate from completely regulated sellers market to completely deregulated customers market. State bank of India Chittakula branch, Karwar, is actively involved since 1973 in non-profit activity called community service banking. All the branches and administrative offices throughout the country sponsor and participate in large number of welfare activities and social causes. Business is more than banking because it touches the lives of the people anywhere in many ways. At present corporate environment technology, its impact on employees is very vital information to know; now the organization is affected by the same. Every successful organization should posse's ability to meet and manage changes in technology, products, markets, and internal organs. This study shows how state bank manages the concept of impact of technology on its employees.
Objectives of the Study
1. To analyze the impact of technology has brought about change in work / job, job duties and the way work is carried out/ the working conditions of the organization.
2. To assess the impact of technology on employees.
3. To identify the reasons for resistance in accepting new technology.
4. To know what are the measures taken to overcome the problem.
Scope of the Study
This study has been taken up to give some suggestion after finding out the present scenarios in the state bank of India. This will definitely throw light upon the impact of technology on employees of the state bank in Chittakula Branch of Karwar taluk of Uttar Kannada district. This success of every organization and consistency in long run at present times mainly depends on technology involved and the quality of human resources. Modern technology includes knowledge skill, experience which is presently and potentially available to an organization for the achievement of its goal. In every organization technology is recognized as the most vital and valuable resources, where as all other resources depreciate in the value.
Methodology
For accomplishing the objectives of the study both primary and secondary data was collected. For collecting primary data survey method is adopted. The survey was carried out by personally visiting to State Bank of India. Detailed and comprehensive questionnaires were prepared after having conducted polite study. The primary data are collected through discussion and interview with persons directly and indirectly related to Bank. These persons were General Manager, Branch manager, assistants, C.S.E etc. Secondary data necessary for this investigation were collected from; Internet published material, office records, broacher's etc. The sampling techniques used for the research work is Random Sampling method. 10 Sample employees have been taken from the universe as per researcher's convenience.
Data Analysis and Interpretation
The data is basically analyzed using tabulation and percentage method. The data has been presented in the form of tables and diagrams with suitable descriptions. Some statistical tools like ANOVA are used in possible and appropriate situation.
ANOVA-Analysis of Variance
In the present study, ANOVA is used to determine the impact of technology on bank employees. ANOVA is a statistical tool used in the context of sampling analyses to know the significance difference between two or more means. Basically, in ANOVA 'F' test is used. Here computation of mean is not performed instead only variance is computed. Later by using this variance, the significance difference between the means is checked. 'F' statistic is defined as "The estimate of variance between the sample and estimate of variance within the sample"
Estimate of Variance between the Sample F =
Estimate of Variance within the Sample
Data Analysis and Intepretation
Table1: Employees Sample Profile
Age Group No of
Employees
Percentage
Below 30 3 30
31-40 5 50
41-50 2 20
Above 50 0 00
From the above analysis it can be observed that majority of the respondent i.e. 50% of the respondents belongs to the age group 31-40, 30% of the respondent are of age group below 30 & 20%of the respondent belong to the age group 41-50.and there are no respondent for age group above 50 years.
Table 2: Employees Gender Profile
Gender Male Female
No of Em[ployees 8 80
Percentage 2 20
Total 10 100
From the above analysis it can be observed that majority of the respondent i.e. 80% of the respondent are male and only 20% of the respondent are female.
Table 3: Employees Experience Profile
Years of Experience
No of
Respondents Percentage
1-4 year 5 50
5-9 years 2 20
10-14 years 1 10
Above 15years 2 20
Total 10 100
From the above analysis it can be observed that majority of the respondent i.e. 50% of the respondent have 1-4 years experience, 20% of the respondent have 5-9 years experience, and 10% of the respondent have 10-14 years experience and only 20% of the respondent are of above 15 years work experience.
Table 4: Employees Opinion Regarding Working With Technology
Opinion No of
Respondants
Percentage
Bad 0 0
Good 1 10
Satisfactory 6 60
Excellent 3 30
Total 10 100
Table 5: Impact Of Technology On Accuracy Of Employees
Accuracy Level
No of
Respondents Percentage
No 0 0
Less 0 0
Avg 6 60
More 4 40
Total 10 100
From the above analysis it can be observed that majority of the respondent i.e. 60% of the respondent find average accuracy in working with system and 40% of the respondent find more accuracy in working with the system.
Table 6: The Level of Suppport From The Organisation to Cope With The Change In Technology
Organizational Support
No. of Respondent
Percentage
Bad 0 0
Good 1 10
Satisfactory 6 60
Excellent 3 30
Total 10 100
From the above analysis it can be observed that majority of the respondent i.e. 60% of the respondents feels that there is satisfactory support from the organization to cope with the change in technology 30% of the respondent feels that there is excellent support from the organization to cope with the change in technology and only 10% of the respondent feels that there is good support from the organization to cope with the change in technology.
Table 7: Empoyees Resistance to Change
Resistance to Change
No. of
Respondent Percentage
No 0 0
Less 5 50
Average 5 50
More 0 0
Total 10 100
Table 8: Employees Pace of Coping with The Change
Cope with Change
No. of Respondent
Percentage
Slow 0 0
Medium 5 50
Average 1 10
Fast 4 40
TOTAL 10 100
From the above analysis it can be observed that majority of the respondent i.e. 50% of the respondent coped with the change in technology at a medium rate, 40% of the respondent coped up with the change in technology at a rapid rate and only 10% of the respondent coped up with the change in technology at an average rate.
Table 9: Employees Level of Satisfaction about the Training Program for Use of New Technology
Level of Satisfaction
No. of
Respondent Percentage
Nil 0 0
Low 0 0
Average 7 70
High 3 30
Total 10 100
From the above analysis it can be observed that majority of the respondent i.e. 70% of the respondent are averagely satisfied with the training programs given by the organization to cope up with the change in technology and 30% of the respondent are highly satisfied with the training program given by the organization to cope up with the change in technology.
Table 10: Perception of Risk Associated In Working with System
Amount of Risk
No. of
Respondent Percentage
Not at all 0 0
Little 0 0
Medium 6 60
More 4 40
Total 10 100
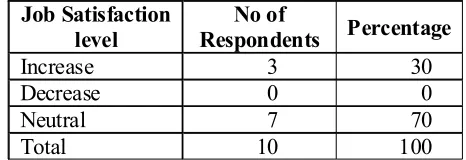
Table 11: Extent of Impact of Technology on Job Satisfaction Level
Job Satisfaction level
No of
Respondents Percentage
Increase 3 30
Decrease 0 0
Neutral 7 70
Total 10 100
From the above analysis it can be observed that it can be observed that majority of the respondent i.e. 70% of the respondent feels that their job satisfaction level has decreased due to the technology and 30% of the respondent feels that their job satisfaction level has increased due to technology.
Table 12: Overall Employees Satisfaction Level with The Technology in the Bank
Level of Satisfaction
No. of
Respondent Percentage
Very satisfied 7 70
Satisfied 3 30
Dissatisfied 0 0
Total 10 100
A question was posed to the employees regarding their level of satisfaction with the technology in the bank and from the answer we can conclude that 70% of the respondents were very much satisfied with the job and only 30% of the respondents were satisfied with the bank.
1. Association between age group and resistance to change
Resistance to Change
Age Group
No Little Average More Total
Below 30 0 0 3 0 3
31-40 0 4 1 0 5
41-50 0 1 1 0 2
Above 50 0 0 0 0 0
Total 0 5 5 0 10
ANOVA: Analysis of Variance
Null Hypothesis
H1=µ1=µ2=µ3=µ4
There is no significance difference because of resistance to change.
H2=µ1=µ2=µ3=µ4
Alternative Hypothesis
1 1 2 3 4
H μ μ μ μ
There is a significance difference because of resistance to change
2 1 2 3 4
H μ μ μ μ
There is a significance difference because of age.
Test Statistics
1. For age
2. Resistance to change of technology.
1
Mean treatment sum of squares (MTSS) F
Mean Error Sum of squares (MESS)
1
Variance Between ages F
Variance within the sample
2
Variance Between resistance to change F
Variance with the sample
Computation
1) Correction factor = CF =No. of values in sampleGrand Total Square
CF = G2/N= 20/16=1.25
2) Total sum of squares (TSS)
= Double summation of X – Correction factor
=9+16+1+1+1–1.25
= 28–1.2
=26.75
3) a) Treatment sum of squares (TrSS) (Due to Age)
= Total – CF
= 9/4+25/4+4/4–1.25
=9+25+4/4–1.25
=38/4–1.25
=9.5–1.25
b) Treatment sum of squares (TrSS) (due to resistance to change)
= Total – CF
= 25/4+25/4–1.25
= 50/4–1.25
= 12.5–1.25
= 11.25
4) Error sum of squares (ESS)
= TSS – TrSS(age) – TrSS(resistance to change)
= 26.75–8.25–11.25
= 7.25
Anova Table
Sources of Variation
Sum of Squares
Degree of Freedom
Mean Sum
of Squares F Statistics
F Table Value
Between the sample resistance to
change
11.25 K=4–1=3 11.25/3=3.75 3.75/.80=4.69 Df=3,9 α = 0.05 = 3.86 Between the
sample-age
8.25 K=4–1=3 8.25/3=2.75 2.75/.80=3.43 Df=3,9 α = 0.05
= 3.86 Within the
sample(ESS)
7.25 K=3*3=9 7.25/9=0.80
Total 26.75 N=N–1 =16–1 =15
Resistance to change
4.69>3.86
Reject the null hypothesis
Between the Sample Age
3.43<3.86
Accept the null hypothesis
There is significance difference because of age group of employees
1. To find the Association between years of experience and cope with change in technology.
Cope with change in technology
Years of Experience
Slow Medium Average Fast Total
1-4Years 0 3 1 1 5
5-9years 0 2 0 0 2
10-14years 0 0 0 1 1
Above 15 0 0 0 2 2
Total 0 5 0 4 10
ANOVA: Analysis of Variance
Null Hypothesis
1 1 2 3 4
H μ μ μ μ
There is no significance difference because of cope with change.
2 1 2 3 4
H μ μ μ μ
There is no significance difference because of years of experience.
Alternative Hypothesis
1 1 2 3 4
H μ μ μ μ
There is a significance difference because of cope with change
2 1 2 3 4
H μ μ μ μ
There is a significance difference because of years of experience
Test Statistics
1. For Years of experience
2. Foe cope with change
1
Mean treatment sum of squares (MTSS) F
Mean Error Sum of squares (MESS)
1
Variance Between years of experience F
Variance within the sample
2
Variance Between cope with change F
Variance within the sample
Computation
1) Correction factor CF = Grand Total Square
No. of values in sample
CF = G2/N= 20/16=1.25
2) Total sum of squares (TSS)
= Double summation of X – Correction factor
= 9+4+1+1+1+4–1.25
= 20–1.25
= 18.75
3) a) Treatment sum of square (TrSS) (Cope with change)
= Total– CF
= 25/4+1/4+16/4–1.25
= 25+1+16/4–1.25
= 42/4–1.25
= 10.25–1.25
= 9.25
b) Treatment sum of square (TrSS) ( years of experience)
= Total –CF
= 25/4+4/4+1/4+4/4–1.25
= 25+4+1+4/4-1.25
= 34/4–1.25
= 8.5–1.25
= 7.25
4) Error sum of squares (ESS)
= TSS-TrSS (cope with change) – TrSS(years of experience)
= 18.75–7.25–9.25
Anova Table
Sources ofvariation
Sum of squares
Degree of freedom
Mean sum of squares
F Statistics
F Table Value
Between the sample years of experience
7.25 K=4–1=3 7.25/3=2.41 2.41/0.25= 9.64
Df=3,9 α = 0.05 = 3.86 Between the
sample-cope with change
9.25 K=4–1=3 9.25/3=3.08 3.08/0.25= 12.32
Df=3,9 α = 0.05 = 3.86
Within the sample(ESS)
2.25 K=3*3=9 2.25/9=0.25
Total
18.75 N=N–1 =16–1 =15
Years of experience
9.64>3.86
Reject the null hypothesis
There is a significance difference because of years of experience
Cope with change
12.32>3.86
Reject the null hypothesis
There is a significance difference because of cope up with change.
3. To find the association between organizational support and cope with technology’
Cope with change in technology
Organizational Support
Slow Medium Average Fast Total
Bad 0 0 0 0 0
Good 0 1 0 0 1
Satisfactory 0 4 1 1 6
Excellent 0 0 0 3 3
Total 0 5 1 4 10
ANOVA: Analysis of Variance
Null Hypothesis
H1=µ1=µ2=µ3=µ4
There is no significance difference because of cope with change.
H2=µ1=µ2=µ3=µ4
Alternative Hypothesis
1 1 2 3 4
H μ μ μ μ
There is a significance difference because of cope with change
2 1 2 3 4
H μ μ μ μ
There is a significance difference because of Organizational support
Test Statistic
1. For Organizational support
2. Foe cope with change
1
Mean treatment sum of squares (MTSS) F
Mean Error Sum of squares (MESS)
1
Variance Between Organizational support F
Variance within the sample
2
Variance Between cope with change F
Variance with the sample
Computation
1) Correction factor = CF = Grand Total Square No. of values in sample CF = G2/N= 20/16=1.25
2) Total sum of squares (TSS)
= Double summation of X – Correction factor
= 1+16+1+1+9–10.25
= 28–1.25
= 26.75
3) a) Treatment sum of squares (TrSS) (Cope with change)
= Total –CF
= 25/1+1/4+16/4–1.25
= 25+1+6/4–1.25
= 42/4–1.25
= 10.50–1.25
b) Treatment sum of squares (TrSS) ( Organizational support )
= Total–CF
= 1/4+36/4+9/4–1.25
= 1+36+9/4–1.25
= 46/4–1.25
= 11.25–1.25
= 10.25
5) Error Sum of square (ESS)
= TSS–TrSS ( Cope with change)- TrSS ( Organizational support)
= 26.75–9.25-10.25
= 7.25
Anova Table
Sources of Variation
Sum of Squares
Degree of Freedom
Mean Sum of squares
F Statistics
F Table Value
Between the sample Organizational support
10.25 K=4–1=3 10.25/3=3.41 3.41/0.08 =4.26
Df=3,9 α = 0.05 = 3.86
Between the sample-cope with change
9.25 K=4–1=3 9.25/3=3.08 3.08/0.08 =3.85
Df=3,9 α = 0.05
= 3.86
Within the sample(ESS)
7.25 K=3*3=9 7.25/9=0.08
Total
26.75 N=N–1 =16–1 =15
Organizational Support
4.26>3.86
Reject the null hypothesis
Cope with change
3.85<3.86
Accept the null hypothesis
There is no significance difference because of cope with change.
Findings
1. Bank realize that technology has become a strategic resource for achieving competitive advantage and sustainable business growth
2. Technology tools and solution like data warehousing and data mining will enable banks to get customer insight, which would have been impossible a few years ago.
3. Through this study it was found that employees are ready to work or accept the challenges with advanced technology.
4. It was found that more than 60% of the sample respondents feel satisfactory regarding working with technology and 30% of the sample respondent feels excellent regarding working with technology and only 10% of sample respondent’s opinion regarding working with technology is good.
5. It was found that around 60% of the sample respondents accuracy level about the impact of technology is average level and 40% of the sample respondents impact of technology on accuracy of employees is more
6. More than 60% of the sample respondent feels satisfactory about the level of support from the organization to cope with the change in technology and 30% of the sample respondents feels about the level of support from the organization to cope with change in technology is excellent and only 10% of the sample respondents feels good from the organization support to cope with the change in technology.
7. 50% of the sample respondent expressed less resistance to change in technology and 50% of the sample respondent expressed average resistance to change in technology.
8. Around 50% of the sample respondents coped up with the change in technology at a medium rate, 40% of the sample respondents coped up with the change in technology at a rapid rate and only10% of the sample respondents coped up with the change in technology at an average rate.
10. More than 60% of the sample respondent feels there is medium risk associated in working with system and 40% of the sample respondents feel there is more risk associated in working with system.
11. 70% of the sample respondents feel that their job satisfaction level has decreased due to the technology and 30% of the sample respondents feel that their job satisfaction level has increased due to technology.
12. More than 70% of the sample respondents were very much satisfied with the job/working with the technology and only 30% were satisfied with the bank to work with technology.
Suggestions
1. The respondent’s opinion was to go for training for adopting the changes in technology. They stated that such training regarding technology will assist them to move about easily with the use of the same.
2. Some of the respondents are partially satisfied by the training provided by the bank. So the training program regarding technology has to be planned to satisfy the mutual interest. As a result the productivity as well as the efficiency in the performance of the employees increases.
3. Training topics regarding technological aspects should be continuously updated with latest changes and developments.
4. The bank must carry out constant review about the employees post training aspects such as acceptance, adaptation and convenience in carrying out work with newly implemented technology or with the change in technology.
5. Technology is the key driver in the banking industry, which creates new business models and process, and also revolutionizes distribution channel.
6. Adoption of technology also enhance the quality of risk management system I banks. Recognizing the benefits of modernizing their technology infrastructure banks is taking the right initiatives.
7. A further challenges which bank face in this regard is to ensure that they will drive maximum advantages from their investments in technology and avoid wasteful expenditure which might arise on account of uncoordinated and piecemeal adoption of technology,
Conclusion
It can be concluded that technology is the key driver in the banking industry, which creates new business models and processes and also revolutionizes distribution channels. Banks which have made inadequate investment in technology have consequently faced on erosion of their market share. The beneficiaries are those banks which have invested in technology. Adoption of technology also enhances the quality of risk management system in banks. Recognizing the benefits of modernizing their technology infrastructure banks is taking the right initiatives. While doing so, banks have four options to choose from,
•
They can build a new system themselves•
They can buy best of the modules•
They can buy a comprehensive solution•
They can outsource.In this context, banks need to clearly defined their core competencies to be sure that they are investing in areas that will distinguish them from other market players, and give them a competitive advantage, A further challenge which bank face in this regard is to ensure that they will drive maximum advantage from their investment in technology an avoid wasteful expenditure which might rise on account of uncoordinated and piecemeal adoption of technology.
References
Books
1. K.Ashwathappa, HR and Personnel Management-Second thoroughly revised edition-Tata Mc Graw Hill publishing limited New Delhi- published in the year 2002.
2. K.N.C.Nair by Head- Federal Bank, Technology, ‘A Strategic source’ published in Chartered Financial Analyst, October 2005, Indian Banking Special.
3. Management Information System for Information Age by IT/Mc Graw Hill.
Journals/Reports
Annual Reports of State bank of India
Bank journals
Organizational Charts and Manuals
Websites
www.statebankofindia.com