164
Research Article
ISSN 0975-248X
Application of Some Novel Techniques for Solubility Enhancement of
Mefenamic Acid, A Poorly Water Soluble Drug
Sanjeev Kumar
1, Chander Parkash
2, Pradeep Kumar
3, S. K. Singh
4*1
Guru Gobind Singh College of Pharmacy, Yamunanagar, Haryana, India
2
G.V.M. College of Pharmacy, Sonipat, Haryana, India
3
Chitkara College of Pharmacy, Rajpura, Punjab, India
4
Department of Pharmaceutical Sciences, G. J. U. S. & T., Hisar, Haryana, India
ABSTRACT
Mefenamic acid (MFA), a potent non-steroidal anti-inflammatory drug (NSAID), has a low oral bioavailability due to poor aqueous solubility and insufficient dissolution. In order to improve the same, various techniques were employed viz., evaporative precipitation into aqueous solution (EPAS), spherical agglomeration (SA) and solid dispersion using solvent evaporation and melt mixing. The formulations were characterised by differential scanning calorimetry (DSC) and X-Ray powder diffractometry (XRD) and were investigated for drug content studies, solubility studies, in vitro study and in vivo evaluation of anti-inflammatory activity. The formulations of MFA prepared by spherical agglomeration technique have satisfactory good drug content and the formulations with SLS and HPMC show a significant increase in solubility in case of SA technique. In case of solid dispersion, all carriers show improvement in the dissolution rate of the drug The DSC studies show no change in the polymorphism in most of the formulations The XRD studies of the formulations show no change in their crystalline form. The formulation containing HPMC & SLS as drug carrier show better anti-inflammatory effect with comparison to pure drug confirming the improved bioavailability of this drug.
Keywords: Mefenamic acid, evaporative precipitation into aqueous solution, spherical agglomeration, solid dispersion,
dissolution.
INTRODUCTION
Poor aqueous solubility of drugs is a major limiting factor with many new drugs in their successful launch in market in spite of their potential pharmacokinetic activity. Poor solubility (less than 10 %) of a drug, leads to poor dissolution in the gastro intestinal tract (GIT) hence, incomplete and erratic absorption ultimately limits its clinical utility. Further, poorly soluble drugs are generally administered at much higher doses than the actual dose in order to achieve necessary drug plasma levels leading to increased adverse reaction & cost of therapy and often yields erratic pharmacological response and hence poor patient compliance. About 40 % of drugs being in the pipeline of pharmaceutical companies are poorly soluble, which emphasizes the need of a technique to overcome such
*Corresponding author: Dr. Shailendra Kumar Singh
Associate Professor (Pharmaceutics), Department of Pharmaceutical Sciences, G.J.U.S. &T., Hisar-125 001
Haryana, INDIA
Email: [email protected], [email protected]
problems. [1] Poorly water-soluble drugs are associated with
slow drug dissolution followed by slow absorption leading eventually to inadequate and variable bioavailability. Solubilty, one of the key parameter in BCS, as well as dissolution rate is the most essential fators controlling the rate and extent of drug absorption. A poorly water soluble compound is defined which get soluble less than 1part per 10000 part of water. A poorly water soluble drug, more recently, has been defined in general terms which require more time to dissolve in the gastrointestinal fluid than it take to be absorbed in the gastrointestinal tract. Thus a greater understanding of dissolution and absorbation behaviors of drugs with low aqueous solubility is required to successfully formulate them into bioavailable drug products. [2]
Mefenamic acid, a non steroidal anti-inflammatory drug was selected as model drug as the drug has low aqueous solubility where its GIT absorption is limited by its dissolution in the gastrointestinal fluids exhibiting a low bioavailability after oral administration. [3] A number of approaches are practiced
melt- mixing, freeze-dried, fusion-solvent method, kneading technique, co precipitation), [4] spherical agglomeration, [5]
evaporative precipitation in aqueous solution, [6]
microcrystallisation, [7] supersaturation, [8] pro drug approach, [9] polymorphism, [10] complexation [11], pH adjustment [12],
co-solvents [13-14], use of surfactant [15] and particle size
reduction. [16] These techniques result into polymorphic
changes or changes in crystal structure or hydrophilicity or particle size changes due to formation of molecular dispersion. The formulations were evaluated by the evaluation techniques utilized also focused on studying these changes in drugs along with their solubility, dissolution and other properties. The solubility and in vitro study was evaluated by the spectrophotometer in the dissolution media. The polymorphic form of the formulation is evaluated by the differential scanning calorimetry (DSC) and crystal structure determination by the powder X-ray diffraction studies (XRD) at the different angles. The formulations of mefenamic acid were also evaluated by in vivo study by anti-inflammatory activity on wistar rats. In the present investigation the techniques utilized were Evaporative Precipitation into Aqueous Solution, Spherical agglomeration, Solvent evaporation and Melt-Mixing, mainly due to their ease in formulation and versatility in application. All these techniques can be easily accommodated at industrial level and the techniques can be easily incorporated in formulation operations in pharmaceutical industry.
MATERIALS AND METHODS Materials
Mefenemic acid (MFA) was obtained as gift sample from Martin & Brown Pharmaceutical Company, Hisar, India. Polyvinyl pyrrolidone K30 (PVP), Hydroxypropylmethylcellulose (HPMC) and Poly Ethylene
Glycol (PEG-4000) were purchased from Qualigens Fine Chemicals (Mumbai, India). All other chemicals were of suitable analytical reagent grade.
Methods
Prepration of spherical agglomerates of PEG-4000, HPMC, SLS, PVP
MFA (2.5 g) was dissolved in 40 ml DMF by gentle warming up to 50ºC and then cooled to room temperature. A solution of 0.1% w/v of surfactant/polymer (HPMC, PEG-4000, Sodium Lauryl Sulfate, PVP K-30) in distilled water (30 ml) was then added to drug solution in DMF with stirring (Table 1). The precipitated solid was dissolved by further addition of 30 ml DMF and gentle warming. This solution was added with stirring to 400 ml distilled water contained in the agglomerating vessel. Chloroform (18 ml) was added drop wise with stirring at 900 rpm for 30 min. The precipitate obtained was collected and dried in vacuum and stored in desiccator further studies.
Preparation of solid dispersion by solvent evaporation technique
In this technique the proper volume of two solutions were to be taken. MFA (5 wt %) and polymer PEG/SLS/HPMC/PVP (5 wt %), in ethanol were mixed and the mixtures were stirred for 10 minutes at 900 rpm (Table 1). The final solutions were poured onto Petri dish and the solvent was left to evaporate in open air for 2 days. After complete removal of the solvent the solid dispersions were stored at ambient temperature in desiccator.
Preparation of hydrophilic coated drug particles by evaporative precipitation in aqueous solution (EPAS) method
Preheated (≅70ºC) organic solution of the MFA in Chloroform (1%) is sprayed though a fine nozzle into a preheated (≅70ºC) (1 %) aqueous solution of surfactant/polymer. The rapid evaporation of the organic solvent produces high supersaturation and rapid precipitation of the drug in the form of a colloidal suspension that is stabilized by a variety of low molecular weight surfactant/polymer solution of (SLS, PEG-4000, PVP, and HPMC). The suspensions were then freeze dried (Table 1).
Preparation of solid dispersions by melt mixing method
A physical mixture of MFA and PEG were heated during stirring in a reaction tube immersed in an oil bath to 130°C. When the drug was completely melted and a homogeneous solution was obtained. Solid dispersions with Drug/PEG 20/80, 40/60, 60/40 weight ratios were prepared (Table 1). Next, the tubes were immersed in a water bath to quench the melt. The prepared samples were dried and stored at 25°C in desiccator.
EVALUATION AND CHARACTERIZATION Differential Scanning Calorimetry
DSC studies of the prepared samples were conducted immediately after preparation as well as after storage for 6 months. An instrument (DSC Q10, TA Instruments, U.S.A) equipped with an intraocular 2p cooling accessory was used. Samples of 10 mg to 5 mg were placed in saturated aluminum pans and sealed with a lid. Heating scans by 10ºC /min applied with a purge of 50 ml/min. Fast heating rates are preferred to prevent changes during scanning.
X-Ray Powder Diffractometry
X-ray powder diffraction patterns were recorded on a XPERTO-PRO X-ray diffractometer using Ni filtered, using a voltage of 45 kV, and a 40 mA current. The scanning scheme employed was 1 min- 1 over the 6 to 50 diffraction angle (2θ) range. The relationship used for the calculation of crystallinity was presented by relative degree of crystallinity.
[17]
Relative degree of crystallinity (RDC) =
⎥
⎥
⎦
⎤
⎢
⎢
⎣
⎡
ref sam
I
I
Where, Isam=Peak height of the sample under investigation
Iref =Peak height at the same angle for the reference with the
highest intensity.
Drug Content Studies
The individual formulations equivalent to 10 mg of MFA were weighed accurately and mixed with 100 ml of methanol. After that the solutions is to be 10 times diluted with methanol. The suspension was filtered through 22 µm nylon disc filters and drug content was analyzed at 284 nm using UV Spectrophotometer (Perkin Elmer EZ301, USA).
Solubility Studies
Table 1: Composition of various formulation batches (MFA 01-16) containing 10 mg of Mefenamic acid
S.
No Formulations Techniques Solvent
Polymers/ Surfactant
1 MFA-01 SA DMF HPMC
2 MFA -02 SA DMF PVP
3 MFA -03 SA DMF PEG-4000
4 MFA -04 SA DMF SLS
5 MFA -05 SE Ethanol HPMC 6 MFA -06 SE Ethanol PVP 7 MFA -07 SE Ethanol PEG-4000 8 MFA -08 SE Ethanol SLS 9 MFA -09 EPAS Chloroform HPMC 10 MFA -10 EPAS Chloroform PVP 11 MFA -11 EPAS Chloroform PEG-4000 12 MFA -12 EPAS Chloroform SLS 13 MFA -13 MM NO PEG-4000 14 MFA -14 MM NO PEG-4000 15 MFA -15 MM NO PEG-4000
16 MFA -16 STD NO NO
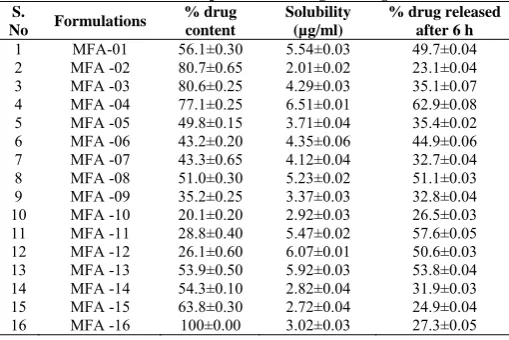
Table 2:Content, solubility and % release of Mefenamic acid from different formulations in comparison with original drug
S.
No Formulations
% drug content
Solubility (µg/ml)
% drug released after 6 h
1 MFA-01 56.1±0.30 5.54±0.03 49.7±0.04 2 MFA -02 80.7±0.65 2.01±0.02 23.1±0.04 3 MFA -03 80.6±0.25 4.29±0.03 35.1±0.07 4 MFA -04 77.1±0.25 6.51±0.01 62.9±0.08 5 MFA -05 49.8±0.15 3.71±0.04 35.4±0.02 6 MFA -06 43.2±0.20 4.35±0.06 44.9±0.06 7 MFA -07 43.3±0.65 4.12±0.04 32.7±0.04 8 MFA -08 51.0±0.30 5.23±0.02 51.1±0.03 9 MFA -09 35.2±0.25 3.37±0.03 32.8±0.04 10 MFA -10 20.1±0.20 2.92±0.03 26.5±0.03 11 MFA -11 28.8±0.40 5.47±0.02 57.6±0.05 12 MFA -12 26.1±0.60 6.07±0.01 50.6±0.03 13 MFA -13 53.9±0.50 5.92±0.03 53.8±0.04 14 MFA -14 54.3±0.10 2.82±0.04 31.9±0.03 15 MFA -15 63.8±0.30 2.72±0.04 24.9±0.04 16 MFA -16 100±0.00 3.02±0.03 27.3±0.05
In Vitro Study
The dissolution study is to be done of the10 mg of MFA and its formulations (equivalent to 12 mg drug). Formulations (10 mg of MFA) were placed in capsule with 200 mg sprayed dried lactose in a rotating basket (USP XXII) and then placed in 900 ml 0.1% SLS solution and stirred at a speed of 50 rpm with temperature maintained at 37 ± 1ºC. Aliquots of 10ml were withdrawn at appropriate time intervals and an equal volume of 0.1 % SLS was replaced in the vessel. MFA in the aliquot was assayed at284 nm using UV Spectrophotometer.
Evaluation of Anti-Inflammatory Activity of Mefenemic Acid
The anti-inflammatory activity of MFA and its formulations were evaluated by carrageenan induced rat paw oedema method. The present method was assessed by inhibition of oedema caused by carrageenan. Experimental protocol was approved by the institutional animal ethics committee (IAEC) and care of animals was taken as per the guidelines of Committee for the Purpose of Control and Supervision of Experiments on Animals (CPCSEA), Ministry of Forest and Environment, Govt. of India.
Experimental Animals: The experiment was carried out on
healthy Wistar rats weighing between 120-200 g of either sex. The rats were divided by randomization into 10 groups. Each group comprised of 6 animals. The animals were fasted with free access to water for 12 h prior to the tests.
Drug and dose: All the standard and test drugs were
suspended with 0.5 % w/v CMC.
(a) Control groups: 0.5 % w/v CMC (10 kl/kg) alone.
(b) Standard group: Standard group of animals received
MFA (12 mg/kg).
(c) Test group: Test group of rats received first dose as equal
to parent drug’s dose.
Oedematogenic agent: 0.1 ml of a 1 % saline freshly
prepared suspension of carrageenan in normal saline solution of (0.9 % w/v) was used as oedematogenic agent to induced swelling or inflammation in paw of rats.
Route of administration : All the drugs or standard or
vehicle were administrated to rats by oral route while 0.1 ml of 0.1 % w/v carrageenan solution was injected subcutaneously (s.c.) under the planter surface (subplanter) of left hind paw.
Procedure: Different groups of animals were treated with
test drugs or standard or vehicle for anti-inflammatory studies. One carageenan was injected subcutaneously to the right hind paw of each rat. The thickness (mm) 0f the paw was measured immediately and at 1, 2, 3 and 4 h intervals after the injection of the carageenan. A digital vernier caliper (Aerospace, china) used of inflammation was calculated for the MFA and their formulations by following formula. Edema (ΛT) and inhibition rate (I) were calculated as followed:
ΛT = Tt –To
% inflammation = ΛT/To *100 % Inhibition = 100 - % inflammation Where, Tt = the left hind paw thickness at time t,
To = the left hind paw thickness before sub-planter injection of carrageenan. [18, 10]
Statistical Analysis
All the results were expressed as Mean ± Standard deviation (SD). Data was analyzed using one-way ANOVA followed by Turkey-Kramer multiple comparisons test. P<0.05 was considered as statically significant.
RESULTS AND DISCUSSION
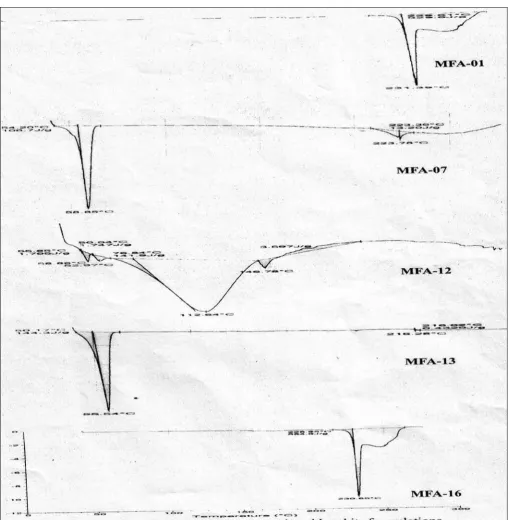
Differential scanning calorimetric (DSC) study
DSC thermograms of pure drug and corresponding drug carrier system are depicted in Fig. 1. The DSC curve of Mefenamic Acid (MFA-16) shows a sharp endothermic peak (Tpeak = 230.5°C) corresponding to its melting, indicating its crystalline nature. However, the characteristic endothermic peak, corresponding to drug melting was broadened and shifted toward lower temperature, with reduced intensity, in formulations 01, 07, MFA-012, and MFA-13. This could be attributed to higher polymer concentration and uniform distribution of drug in the crust of polymer, resulting in complete miscibility of molten drug in polymer. No significant difference in DSC pattern of dispersions and physical mixture suggests that the kneading process could not induce interaction at the molecular level and solid dispersion formed is a physical mixture with highly dispersed drug crystals in polymeric carrier system.
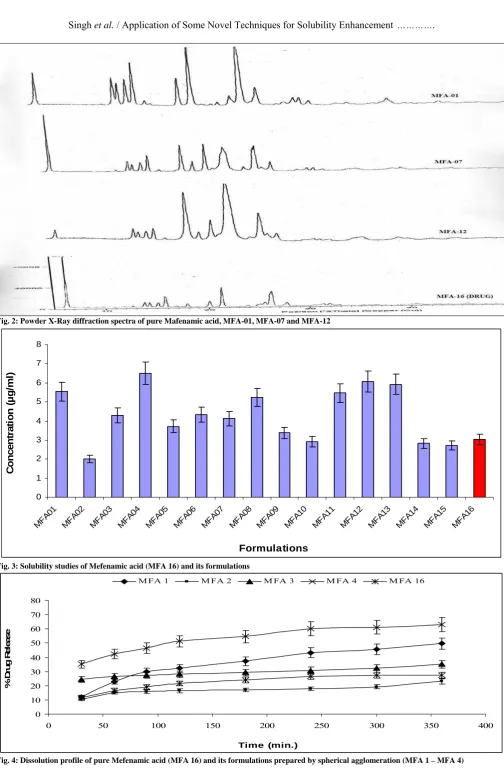
X-ray Diffraction Study
0.9772, 0.6031 and 0.5886, respectively. Moreover, the
relative intensity and 2θ angle of these peaks remains practically unchanged. Table 3: Anti-inflammatory activity of Mefenamic acid and its formulations
Oedema (∆T) (Mm) ± SD % Inhibition
Treatment (mg/Kg)Dose
1 H 2 H 3 H 4 H 1 H 2 H 3 H 4 H
Control - 1.77 ± 0.07 2.03 ± 0.03 3.22 ± 0.04 3.35 ± 0.03 0.00 0.00 0.00 0.00 Vehicle (HPMC) 12 1.71 ± 0.02 2.30 ± 0.02 3.19 ± 0.02 3.22 ± 0.02 0.00 0.00 0.00 0.00 Vehicle (SLS) 12 1.69± 0.06 2.39 ± 0.05 3.21 ± 0.05 3.24 ± 0.06 0.00 0.00 0.00 0.00 MFA-16 12 1.30 ± 0.02* 1.20± 0.02* 1.14± 0.02* 1.32 ± 0.02* 45.38 49.58 52.11 44.54 MFA-01 12 1.28 ± 0.02* 1.20± 0.02* 1.04± 0.02* 1.07 ± 0.03* 41.02 44.71 52.08 50.7 MFA-04 12 1.20± 0.03* 1.15 ± 0.02* 0.92± 0.02* 1.02 ± 0.02* 45.46 47.73 58.19 53.64 MFA-08 12 1.22± 0.02* 1.03± 0.02* 0.91± 0.02* 1.02 ± 0.02* 42.19 51.19 56.88 53.61 MFA-09 12 1.63 ± 0.02* 1.44± 0.02* 1.32± 0.02* 1.36 ± 0.03* 27.24 35.72 41.08 39.29 MFA-12 12 1.59 ± 0.02* 1.41± 0.02* 1.31± 0.02* 1.34 ± 0.03* 28.7 36.78 41.25 39.49 Oedema Is Expressed As Mean Change In Paw Thickness ± SD
N =6 Animals.
* P < 0.001 As Compared To Control. P < 0.01
P < 0.001 As Compared To Mefenamic
Fig. 2: Powder X-Ray diffraction spectra of pure Mafenamic acid, MFA-01, MFA-07 and MFA-12
0 1 2 3 4 5 6 7 8
MF A01
MF A02
MF A03
MF A04
MF A05
MF A06
MF A07
MF A08
MFA 09
MF A10
MF A11
MF A12
MF A13
MF A14
MF A15
MF A16
Formulations
C
o
nc
e
n
tr
a
ti
on (µ
g/
m
l)
Fig. 3: Solubility studies of Mefenamic acid (MFA 16) and its formulations
0 10 20 30 40 50 60 70 80
0 50 100 150 200 250 300 350 400
Time (min.)
%
D
rug
R
el
ease
M FA 1 M FA 2 M FA 3 M FA 4 M FA 16
0 10 20 30 40 50 60
0 50 100 150 200 250 300 350 400
Time (min.)
%
Dr
u
g
Re
le
a
s
e
M FA 5 M FA 6 M FA 7 M FA 8 M FA 16
Fig. 5: Dissolution profile of pure Mefenamic acid (MFA-16) and its formulations prepared by solvent evaporation (MFA-5 – MFA-8)
0 10 20 30 40 50 60 70
0 50 100 150 200 250 300 350 400
Time (min.)
%
D
ru
g
R
el
ease
M FA 9 M FA 10 M FA 11 M FA 12 M FA 16
Fig. 6: Dissolution profile of pure Mefenamic acid (MFA 16) and its formulations prepared by evaporative precipitation into aqueous solution (MFA 09 – MFA 12)
0 10 20 30 40 50 60 70
0 50 100 150 200 250 300 350 400
Time (min.)
%
D
ru
g
R
el
ease
M FA 13 M FA 14 M FA 15 M FA 16
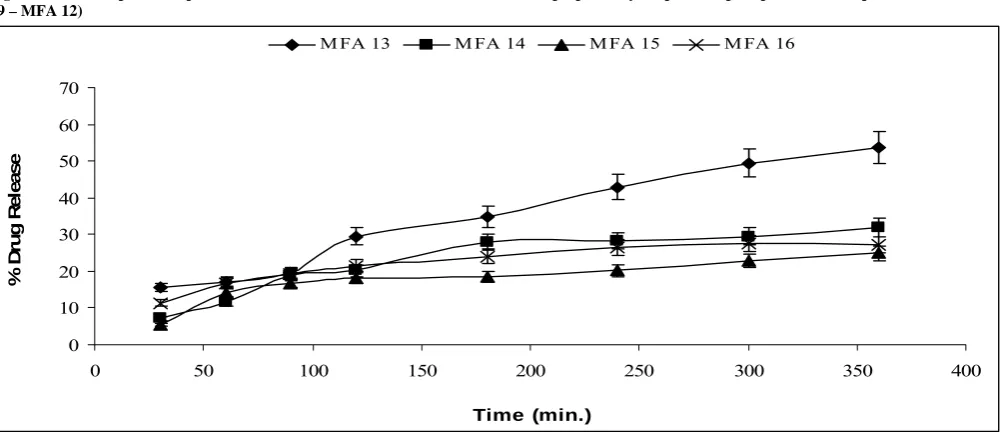
Fig. 7: Dissolution profile of pure Mefenamic acid (MFA 16) and its formulations prepared by melt mixing (MFA 13 – MFA 15)
Drug content study
The drug content of the prepared formulations of MFA was observed to be varying from 80.7 to 20.1 % and it was maximum with formulation (MFA-02) and minimum in
Solubility studies
Aqueous solubility of MFA was observed to be maximum with formulation MFA-04 (6.51±0.01 µg/ml) and the minimum with formulation MFA-02 (2.01±0.02 µg/ml) as shown in Table 2 and Fig. 3. Studies show that spherical agglomeration technique shows the maximum solubility with SLS surfactant and where as with PVP this technique show minimum drug solubility. In the solid dispersion (solvent evaporative) technique the formulations MFA-08 show maximum (5.23µg/ml) and formulations MFA-05 show the slightly more drug solubility as compared to the pure drug. In the Evaporative Precipitation technique in Aqueous Solution the formulation MFA-12 and MFA-11 show the much more solubility (6.07±0.01 and 5.47±0.02 µg/ml respectively). And the formulation MFA-10 shows the minimum solubility as compared to the MFA-16. In the solid dispersion (Melt Mixing) technique the formulations MFA-13 show maximum drug solubility is 5.92±0.03 µg/ml. Over all in the solubility studies show that the spherical agglomeration technique and EPAS is the best method for the increases in the solubility of the mefenamic acid with SLS.
In vitro dissolution studies
In vitro dissolution studies of the prepared formulations were done on USP-I apparatus using baskets. The specifications used for dissolution study of the all the prepared formulations were same and described below. In all the formulation, the drug content was taken as 10 mg per capsule in 900 ml dissolution medium, 37°C containing SLS (0.5 % w/v) and at different time intervals, 10 ml of the solution was withdrawn until 16 h.
In vitro dissolution study of the different formulations of MFA prepared by spherical agglomeration technique, it was observed that the formulation MFA-04, MFA-01 show the increase in the % release of the drug from the formulations. The formulation MFA-02 Show the lesser % release of the drug in the dissolution medium. In Solid Dispersion (Solvent Evaporation) technique, it was observed that the formulation MFA-08, MFA-06 and MFA-05 show the increase in the % release of the drug from the formulations. In EPAS technique, it was observed that the formulations MFA-11, MFA-12show the increase in the % release of the drug from the formulation which are to be kept in the capsule as compared to the std. drug profile. The formulation MFA-10 Show the lesser % release of the drug in the dissolution medium.
In Solid Dispersion technique (Melt Mixing), it was observed that the formulation MFA-13, MFA-12 show the maximum increase in the % release of the drug from the formulation which are to be kept in the capsule as compared to the MFA profile. The formulation MFA-15 show the lesser % release of the drug in the dissolution medium as compared to the MFA release profile as shown in Fig. 4-7 and Table 2.
Effect of different carriers on the dissolution of Mefenamic acid
Spherical agglomeration techniques were developed for improving the solubility of microcrystalline mefenamic acid. The process involved agglomerating microcrystal using agglomerating solvents. Temperature and speed of agitation were optimized to obtain spherical agglomerates in a desired range, which was found to be essential to enhance the solubility. Incorporation of polymer/surfactant (HPMC, SLS) during agglomeration significantly enhanced the dissolution
rate of mefenamic acid. In additional flow and compressibility properties of the drug is improved.
The enhancement of dissolution of drug from drug carrier systems can be ascribed to several factors. The mechanism of dissolution rate improvement from solid dispersion is lack of crystallinity and particle size reduction considered to be important factors for dissolution rate enhancement. Mixing of drug with a hydrophilic carrier results in greater wetting and increase surface available for dissolution by reducing interfacial tension between the hydrophilic drug and dissolution media. It was noted that drug carrier system sink immediately, while pure drug keeps floating on the surface for a longer time interval and similar results were reported by Modi et al. [19]
The dissolution parameters of solid dispersion of MFA with various carriers (HPMC, PVP K-30, PEG-4000, SLS) were carried with same concentration of each carrier. The dissolution rate of pure drug is low even in the surfactant based medium, as 27.3 % of the drug gets dissolved 360 min respectively.
Solid dispersions formulated with all the carriers exhibited significant improvement in the dissolution parameters of drug. The order of dissolution enhancement with various binary systems was found to be (MFA-08>MFA-06>MFA-05>MFA-07) for mefenamic. The increase in the dissolution rate of the solid mixtures might be due to size reduction and increase in the wettabilityof the drug molecules in presence of the surfactants. This kind of technique can be extended for improvement dissolution rate of drug showing poor dissolution profiles and causing erratic bioavailability. [20]
In evaporative precipitation into aqueous solution (EPAS) to form micron to sub-micron sized particles, leading to increased bioavailability relative to larger particles. Soluble stabilizers offer the ability to form submicron particles that have high dissolution rates in aqueous media. The present invention often produces particles having reduced crystallinity as compared to the bulk drug, which enhances dissolution. [21]
Anti-inflammatory activity of mefenamic acid and its formulations
Table 3 shows the anti-inflammatory activity of MFA and its formulations after oral administration. Mefenamic acid and its formulations i.e. MFA-01, MFA-04, MFA-05, MFA-08, MFA-09 and MFA-12 exhibited their maximum anti-inflammatory effect at 3 h. MFA-4 and MFA-08 inhibited maximum edema formation (58.19%) and (56.88%) respectively after 3 h when compared with control animals. MFA-4 and MFA-08 has better activity as compared to MFA. At 3 h both formulations gave a significant inhibition of oedema formation. MFA and its formulations produced significant better activity (p<0.001) when compared with control.
investigational drug there by enhancing the bioavailability of drugs and improving the patient compliance.
ACKNOWLEDGEMENT
The authors express their thanks to the Central Analytical Instrumentation Laboratory, Panjab University, Chandigarh for XRD studies.
REFERENCES
1. Speiser PP. Poorly soluble drugs, a challenge in drug delivery. In: Muller RH, Benita S, Bohm B Eds Emulsions and nanosuspensions for the formulation of poorly soluble drugs. Medpharm Scientific Publishers, Stuttgart, 1998, pp. 15-28.
2. Chaudhari PD, Sharma PK, Badagale MM, Dave KD, Kulkarni PA Barhate NS. Current trends in solid dispersions technology. Pharmainfotech 2006.
3. The Merck Index: An Encyclopedia of Chemicals, Drugs, and Biologicals, 12th ed. Budavari, S.; O’Neal, M.J.;Smith, A.; Heckelman, P.E.; Kinneary, J.F., Eds.; Merck & Co.: Whitehouse Station, NJ, 1996
4. Habib MJ, Pharmaceutical Solid Dispersion Technology, CRC PR Lic, 2000, pp 3- 95.
5. Viswanathan CL, Kulkarni SK, Kolwankar DR. Spherical Agglomeration of Mefenamic Acid and Nabumetone to Improve Micromeritics and Solubility: A Technical Note. AAPS PharmSciTech. 2006, 7(2): Article 48.
6. Sarkari M, Brown J, Chen X, Swinnea S, Williams RO, Johnston KP. Enhancement drug dissolution using evaporative precipitation into aqueous solution. Int. J. Pharm. 2002; 28, 243(1-2):17-31. 7. Rasenack N, Hartenhauer H, Müller BW. Microcrystals for
dissolution rate enhancement of poorly water-soluble drugs, International Journal of Pharmaceutics, 254 (2): 137-145.
8. Moser K, Kriwet K, Kalia YN, Guy RH. Stabilization of supersaturated solutions of a lipophilic drug for dermal delivery, International Journal of Pharmaceutics, 224: 169-176.
9. Daehne WV, Frederiksen E, Gundersen E, Lund F, Morch P, Peterson HJ, Roholt K, Trybring L, Godtfredsen W. Acyloxymethyl esters of ampicillin. J. Med. Chem. 1970; 13: 607-612.
10. Raw AS, Furness MS, Gill DS, Adams RC, Holcombe FO and Yu LX, Regulatory considerations of pharmaceutical solid polymorphism in Abbreviated New Drug Applications (ANDAs). Advanced Drug Delivery Reviews. 2004; 56(3): 397-414
11. Derle DV, Bele M, Kasliwal N. In vitro and in vivo evaluation of mefenamic acid and its complexes with β-Cyclodextrin and HP-β -Cyclodextrin. Asian Journal of Pharmaceutics, 2008; 2: 30-34. 12. Levy G. Effect of dosage form on drug absorption. A frequent
variable in clinical pharmacology. Arch. Int. Pharmacodyn. Ther., 1964; 152: 59-68.
13. Kubo H, Mizobe M. Physicochemical properties of 1-(3, 4- dimethoxyphenyl)-2,3-bis-(methoxycarbonyl)-4-hydroxy-6,7,8-trimethoxynapthalene, a new hypo cholesterolemic agent, and its gastrointestinal absorption in dogs. Yakuzaigaku 1995; 55: 244-249.
14. Nerurkar J, Beach JW, Park MO, Jun HW. Solubility of (±)-ibuprofen and S (+)-ibuprofen in the presence of cosolvents and cyclodextrins. Pharm. Dev. Technol. 2005; 10: 413-421.
15. Wiedmann TS, Kamel L. Examination of the solubilization of drugs by bile salt micelles. J. Pharm. Sci. 2002; 91: 1743-1764
16. Reverchon E, Dellaporta G, Spade A, Antonacci A. Griseofulvin micronization and dissolution rate improvement by super critical assisted atomization. J. Pharm. Pharmacol. 2004; 56: 1379-1387. 17. Naidu NB, Choudary KPR, Murthy KVR, Satyanarana V, Hayman
AR, Becket G. Physicochemical characterization and dissolution properties of meloxicam–cyclodextrin binary systems. J. Pharma. Biomed. Anal., 2004; 35: 75-86.
18. Brown DC, Ramesha SC, Sophie C, Voronin T. Characterization of the analgesic and anti-inflammatory activities of Ketorolac and its enationmers in the rats. Journal of Pharmacology, Experimental Therapy. 1999; 288: 1288-1297.
19. Modi A, Tayade P. Enhancement of Dissolution Profile by Solid Dispersion (Kneading) Technique. AAPS PharmSciTech. 2006, 7 (3): Article 68.
20. Raju YP, Garbhapu A, Prasanna SAL, Rao BS, Ramana MKV. Studies on enhancement of dissolution rate of etoposide. Indian Journal of Pharmaceutical Sciences 2007; 69: 269-273.