Technology (IJRASET)
Comparative Analysis of Gnome Sort and Bubble
Sort in the Worst Case using Performance
Visualization in Personal Computer
Dipankar Das1, Priyanka Das2, Rishab Dey3, Sreya Modak4
1Assistant Professor, 2,3,4Student, Department of BCA, The Heritage Academy, Kolkata, India
Abstract: The present study aims at visualizing the performances of Gnome sort and Bubble sort algorithms in the worst case which are implemented using R in a personal computer (Desktop). In the present study, we have done a comparative analysis of the worst case performances of said algorithms. The scope of the study is limited to data size ten (10) to data size one hundred (100). In this study, using visual inspection, we observe that the performances of both the algorithms very closely follow quadratic curve and the Bubble sort is taking less time to sort same amount of data than the Gnome sort in the worst case. Keywords: Gnome sort, Bubble sort, Performance visualization, Worst case, Quadratic curve
I. INTRODUCTION
We know that sorting is a fundamental task that is performed by most computers [1] and best studied problems in computer science [2]. There are many sorting algorithms developed and implemented so far in the computer science. In the present case, we have made an experimental study on two (2) sorting algorithms namely Bubble sort and Gnome sort in the worst case. We know that Bubble sort is one of the simplest sorting algorithm [3], [4], [5]. According to Dick Grune the simplest sorting algorithm is Gnome sort [6]. This algorithm was first described by Hamid Sarbazi-Azad as Stupid sort in the year 2000 [7]. We know that the time complexity of Bubble sort in the worst case is of O(n2) [13] and Gnome sort in the worst case is also of O(n2) [14].
II. RELATEDWORKS
The comparison of various sorting algorithms including Bubble sort and Gnome sort had been done by Kaur, Singh & Singh (2013) [12], Rao & Ramesh (2012) [9], Mishra & Garg (2008) [10], Pandey (2008) [11]. Hammad (2015) had done the performance comparison between Selection sort, Bubble sort and Gnome sort algorithms which were implemented using ‘c sharp’ language [8].
III.OBJECTIVESOFTHESTUDY
A. To visualize the performance (data size versus average run time in nano-seconds) of Gnome sort in the worst case implemented
using R in a personal computer (Desktop).
B. To visualize the performance (data size versus average run time in nano-seconds) of Bubble sort in the worst case implemented
using R in a personal computer (Desktop).
C. To perform a comparative study of performances of Gnome sort and Bubble sort in the worst case implemented on personal computer (Desktop) using performance visualization.
IV.METHODOLOGY
V. DATAANALYSIS&VISUALIZATION
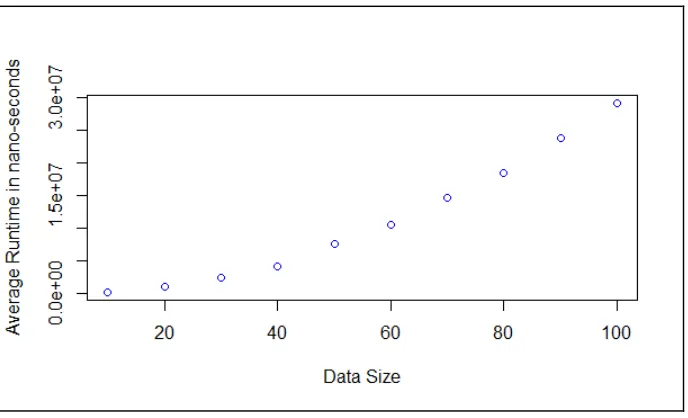
[image:3.612.137.488.116.329.2]The scatter plot of the performance of the Gnome sort in the worst case is shown in the following figure:
Fig. 1 Scatter Plot of Performance of Gnome Sort in Worst Case
Findings: The small red circles in the figure (Fig. 1) represent the performances of Gnome sort in the worst case for data size ten (10) to one hundred (100) with an interval of ten (10). From the above figure we see that the average runtime of the Gnome sort increases with the increase in the data size and the increase is non linear.
The scatter plot of the performance of the Bubble sort in the worst case is shown in the following figure:
Fig. 2 Scatter Plot of Performance of Bubble Sort in Worst Case
Findings: The small blue circles in the figure (Fig. 2) represent the performances of Bubble sort in the worst case for data size ten (10) to one hundred (100) with an interval of ten (10). From the above figure we see that the average runtime of the Bubble sort increases with the increase in the data size and the increase is non linear.
[image:3.612.141.485.416.625.2]Technology (IJRASET)
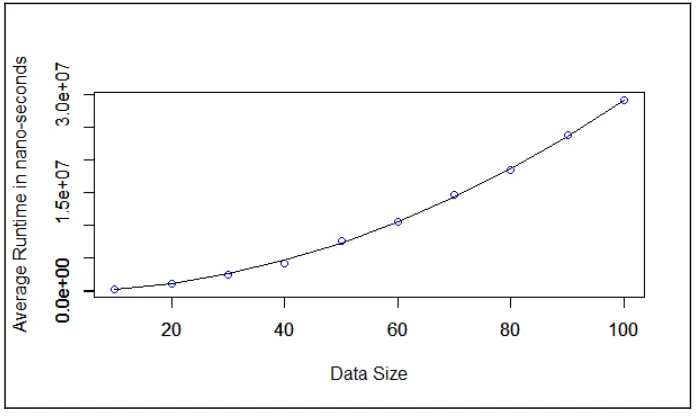
Fig. 3 Scatter Plot of Performance of Gnome Sort in Worst Case along with Quadratic Curve
Findings: The small red circles in the figure (Fig. 3) represent the performances of Gnome sort in the worst case for data size ten (10) to one hundred (100) with an interval of ten (10) and the black colour curve represents the quadratic curve which is obtained by calculating the coordinate points by taking the highest point of the scatter plot as the starting point. From the above figure (Fig. 3) we see that the quadratic curve passes through most of the data points. Therefore, using visual inspection technique, we may come to the conclusion that the worst case performance of Gnome sort approximately follows quadratic trend.
The scatter plot of the performance of the Bubble sort in the worst case along with the quadratic curve is shown in the following figure:
Fig. 4 Scatter Plot of Performance of Bubble Sort in Worst Case along with Quadratic Curve
Findings: The small blue circles in the figure (Fig. 4) represent the performances of Bubble sort in the worst case for data size ten (10) to one hundred (100) with an interval of ten (10) and the black colour curve represents the quadratic curve which is obtained by calculating the coordinate points by taking the highest point of the scatter plot as the starting point. From the above figure (Fig. 4) we observe that the quadratic curve passes through most of the data points. Therefore, through visual inspection, we may come to the conclusion that the worst case performance of Bubble sort approximately follows quadratic trend.
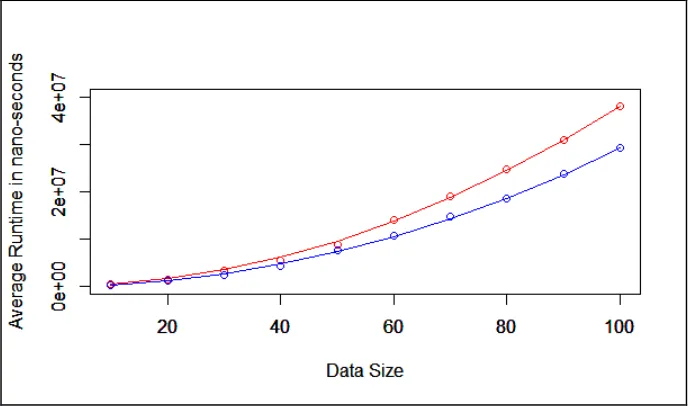
[image:4.612.132.480.398.606.2]Fig. 5 Scatter Plots of Performance of Gnome Sort and Bubble Sort in Worst Case along with Quadratic Curves
Findings: The small red circles in the figure (Fig. 5) represent the worst case performances of Gnome sort and the small blue circles in the figure represent the worst case performances of Bubble sort. The red colour curve represents the quadratic curve for the performance of the Gnome sort and the blue colour curve represents the quadratic curve for the performance of the Bubble sort. From the figure (Fig. 5) we observe that with the increase in the data size the Bubble sort algorithm is taking less time than Gnome sort algorithm in the worst case.
VI.CONCLUSION
The main objective of this study is to visualize the performance of the Gnome sort and Bubble sort algorithms in the worst case which are implemented using R on a personal computer (Desktop) to perform a comparative analysis of the performances of the said algorithms. The study reveals that the performances of both the algorithms in the worst case very closely follow quadratic curves which implies that the worst case complexity (time complexity) of both the algorithms are of O(n2) where n is number of data. We
have also done a comparative analysis of the performances of Gnome sort and Bubble sort in the worst case by visualizing the performances of both the algorithms side by side. The comparison study clearly shows that Bubble sort is taking much less time than Gnome sort as the data size increases. This study is limited to data size ten (10) to one hundred (100) and on a particular hardware and software platform. Hence, our conclusion is limited to this study only. The study involving data size beyond this range using the same platform or using different platforms will be our future scope of study.
REFERENCES
[1] Arora, L. (2014). An Efficient and Optimistic Binary Sort algorithm using Divide and Conquer. International Journal of Advanced Research in Computer Science and Software Engineering, 4(6), 819-826. Retrieved May 2, 2017, from https://www.ijarcsse.com/docs/papers/Volume_4/6_June2014/V4I6-0305.pdf [2] Zhang, H. (n.d.). 22c:31 Algorithms, Ch4: Sorting and Searching [PDF]. Available online at http://homepage.cs.uiowa.edu/~hzhang/c31/notes/ch04Sort.pdf [3] Simple sorting algorithms and their complexity [PDF]. (n.d.). Available online at http://www.cs.nott.ac.uk/~psznza/G5BADS06/lecture14-print.pdf
[4] Barnette, ND., McQuain, WD., & Kennan, MA. (n.d.). Intro Programming in C++ [PDF]. Available online at
http://courses.cs.vt.edu/~cs1044/fall09/Notes/T23.Sorting.pdf
[5] BUBBLE SORTING WITH EXAMPLE IN C/C /JAVA [PDF]. (n.d.). Available online at
http://www.idc-online.com/technical_references/pdfs/information_technology/Bubble_Sort_in_C_Cpp_Java_programming_languages.pdf
[6] Grune, D. (n.d.). Gnome Sort - The Simplest Sort Algorithm. Retrieved March 31, 2017, from https://dickgrune.com/Programs/gnomesort.html
[7] Sarbazi-Azad, H. (2000, October 2). Stupid Sort: A new sorting algorithm. News letter (Computing Science GLASGOW), 599, 4. Retrieved March 31, 2017, from http://sina.sharif.edu/~azad/stupid-sort.PDF
[8] Hammad, J. (2015). A Comparative Study between Various Sorting Algorithms. International Journal of Computer Science and Network Security, 15(3), 11-16. Retrieved March 31, 2017, from http://paper.ijcsns.org/07_book/201503/20150302.pdf
[9] Rao, D. T. V. D., & Ramesh, B. (2012). Experimental Based Selection of Best Sorting Algorithm. International Journal of Modern Engineering Research (IJMER), 2(4), 2908-2912. Retrieved March 31, 2017, from https://pdfs.semanticscholar.org/295e/e11e71ff42e4d74dbc83d320d462d4695e67.pdf
Technology (IJRASET)
http://dspace.thapar.edu:8080/jspui/bitstream/10266/583/3/T583.pdf (Thesis submitted in partial fulfillment of the requirements for the award of degree of Master of Engineering, in Computer Science & Engineering Under the supervision of: Mrs. Shivani Goel, Lecturer, CSED)
[12] Kaur, S., Singh, H., & Singh, P. (2013). COMPARISON BASED IDENTIFICATION OF SORTING ALGORITHM FOR A PROBLEM. International
Journal of Advanced Computational Engineering and Networking, 1(1), 67-75. Retrieved March 31, 2017, from