Optical and Structural Properties Ni Doped CUO
Nanoparticles Using Chemical Precipitation
Method
B. Anand1, A. Muthuvel2 V. Mohana3
1, 2,3
Department of Physics, Government Arts and Science, Chidambaram -608102
Abstract: The undoped and different concentrations of Ni (0.01 and 0.02 wt.%) doped CuO nanoparticles were synthesized by chemical precipitation method. The synthesized particles were characterized by UV–visible, FT-IR, SEM and TEM. The optical properties of the nanoparticles are observed by UV–visible. The vibrational band assignments of nanoparticles are observed through FT-IR technique. The surface morphology and size of the nanoparticles are analyzed through SEM, and TEM analysis. Keywords: UV–visible, FTIR, precipitation method, TEM and CuO nanoparticles
I. INTRODUCTION
Copper oxide is a semiconductor material and has a natural abundance of starting material (Cu). It is non-toxic and easily obtained by the oxidation of Cu. Copper oxide is one of the important metal oxide which has attracted recent research because of its low cost, abundant availably as well as its peculiar properties. It is used in the fields like catalysis, superconductors, ceramics as a kind of important inorganic materials etc., CuO has been used as a basic material in cuprate High-Tc superconductors as the superconductivity in these classes of systems is associated with Cu-O bondings [1]. Among all metal oxide nanoparticles, copper oxide has gained the most interest because of its wide applications, such as in solar cell technology, field mission, magnetic storage media, lithium ion batteries, gas sensing, drug delivery, magnetic resonance imaging, and field emission devices. Varieties of physical and chemical methods have been proposed to synthesize CuO nanoparticles [2]. Methods have developed to synthesize CuO Np’s in the presence of polymers and surfactants as stabilizers, to form a layer of coating on the surface of CuO nanoparticles. Quite a good number of methods can be used to prepare CuO nanoparticles, which include thermal reduction, a capping agent method, sono chemical reduction, vapor deposition method, induced radiation, micro emulsion techniques and laser irradiation [3-9]. The synthesized CuO nanoparticles was characterized by diverse methods including SEM, TEM, UV-vis and FT-IR, spectroscopy.
II. EXPERIMENTAL
A. Materials
To synthesize of CuO the following materials were used such as Copper nitrate (CuO), Nickel nitrate acetone, obtained from nice chemical company. Pvt. Ltd and Cetyltrimethyl ammonium bromide (CTAB) obtained from s–d fine chem. Pvt Ltd were used. All the glass wares used in this experimental work were acid washed. The chemical reagents used were analytical reagent grade without further purification. Ultrapure water was used for all dilution and sample preparation. All the chemicals are above 99% purity.
B. Methods
In an air atmosphere, Ni doped CuO nanoparticles were synthesized using deionized water.
In this experiment, 2.1 g (0.3 M) of Copper nitrate in 50 ml aqueous and Ni with different concentrations (0.01and 0.02 wt. %) were poured into the solution. At room temperature, the mixture was stirred magnetically until a homogeneous solution was obtained. Then, l g of 50 ml NaOH was added drop by drop to the above mixture. A yellow voluminous precipitate appeared after NaOH injection.
C. Characterization techniques
The size and morphology of the nanoparticles were analyzed using Scanning Electron Microscopy (SEM; JEOL-JSM-5610 LV) and Transmission Electron Microscopy (TEM; PHILIPS-CM200; 20–200 kV). Specimens for SEM and TEM are prepared with required quantity of powder sample in ethanol and keeping suspension through ultra sonication dispersion. The optical absorption spectra of the samples were recorded by UV-1650 PC SHIMADZU spectrometer.
III. RESULTS AND DISCUSSION
A. Optical properties
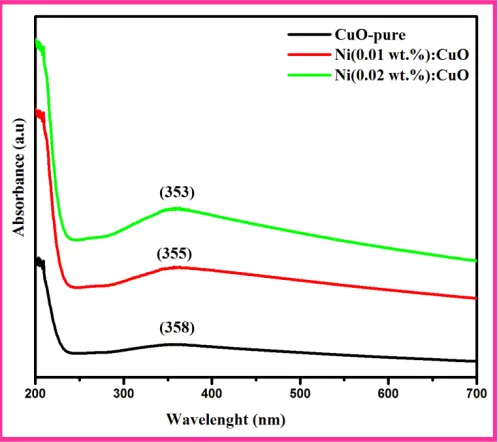
[image:3.612.151.400.298.519.2]1) UV–Visible spectroscopy: The UV-Vis absorption spectra in the powder form of CuO-zeolite nanoparticles at different concentration of Ni (0.01 and 0.02 wt. %) doping were recorded. As depicted in Figure. 1, shows the very small absorbance in the range of 200-700 nm. The absorption is depends on several factors such as oxygen deficiency, band gap, impurity centers and surface roughness [10]. The absorption maximum of the undoped CuO sample is observed at around 358 nm in the UV region. This peak is highly blue shifted compared to the peak value of bulk (380 nm) [11]. The presence of optical band gap in CuO nanoparticles. This kind of optical absorption permits us to determine the crystallinity of material upon the comparison of their band gaps [12]. However, the absorption peaks of 0.01 wt.% of Ni doped samples experiences a red shift compared to 0.02 wt.% sample. This red-shift in the absorption may be due to surface effect and average crystallite size or morphology.
Figure 1. UV-Vis absorption spectra Pure and Ni doped CuO nanoparticles
The optical band gap energy of the nanoparticles was calculated based on the absorption spectrum of the nanoparticles using Equation (1) shown in Table 1
Eg= eV (1)
Where, Eg is the optical band gap, and λ is the absorption maximum. The fundamental absorption which corresponds to the
transmission from valence band to the conduction band is employed to determine the band gap of the material. The direct band gap energy can be estimated from a plot of (αhν) 2.
(αhν)2 = A (hν-Eg)n
Then optical absorbance coefficient (α) of a semiconductor close to the band edge can be expressed by the following equation,
α = A (hν - Eg)n/hν
The absorption coefficient α was calculated from the absorption spectra using the following equation (2).
= . × (2)
[image:4.612.162.422.150.339.2]where, A is the absorbance, ρ is the real density of CuO (set at 7.28 g cm-3 for this calculations), L is the length of the curve, and C is the concentration of the CuO suspension [14] Shown in Figure. 2.
Figure 2. Band gap energy of Ni (wt.%) doped CuO nanoparticles
The estimated energy gap for the undoped CuO is 3.46 eV, it is increased to 3.51eV for increasing Ni doping level up to 0.02 wt.%. Further, decrease in the band gap is observed when concentration level increases from 0.02 wt.% to 0.01wt.%. The existing blue shift in the band gap is due to the substitution of Ni ions into the CuO lattice.
Table1. Compare wavelength and Energy band gap values of pure and Ni doped CuO nanoparticles
Samples Wavelength(nm) Energy band gap (eV)
from absorption band
CuO 358 3.46
Ni(0.01 wt.%): CuO 355 3.49
Ni(0.02 wt.%): CuO 353 3.51
2) FT-IR spectra : The FT-IR spectra of the both samples were shown in Figure. 3, the characteristic peak of O - H stretching
vibration in between ∼3748 and 3441 cm−1
range. The O - H stretching vibration was more deep and narrow due to the present of copper hydroxide phase. Both samples were shown the peaksat around 551, and 425 cm−1, these are the characteristic peaks
for the Cu O stretching vibration. The band at 1378 cm_1 corresponding to C–O–C stretch was also obtained. A band at 2914
cm-1 represents alkynes [15].
[image:4.612.157.437.578.720.2]B. Morphological studies
[image:5.612.98.500.161.339.2]1) Scanning Electron Microscopy (SEM: The surface morphology of the samples has been investigated by scanning electron microscopy. The SEM images of undoped and Ni (0.02 wt.%) doped copper oxide nanoparticles are shown in Figure. 4(a) and (b). The SEM images reflect that the undoped particles consist of non-uniform distribution with some single particles or with some clustered particles. The Ni doped CuO nanoparticles show better distribution particles compared to undoped CuO nanoparticles this conforms the influence of Ni doping in CuO nanoparticles
Figure 4. SEM images of (a)undoped (b) Ni (0.02 wt.%) doped CuO nanoparticles
2) Transmission Electron Microscopy (TEM): It is necessary to know an exact particle size and structures of nano materials by direct measurement, such as (TEM) which can reveal the particle size, shape and orientation of the Ni doped CuO nanoparticles. Figure. 5 shows TEM images of low and high magnification of Ni (0.02 wt.%) doped CuO nanoparticles. From these figures, it is observed that the particles are evidenced with low distinguishable, irregular round shape, but not well resolved.
Figure 5. TEM images Ni (0.02 wt.%) doped CuO nanoparticles
IV. CONCLUSION
The undoped and different concentrations of Ni (0.01 and0.02 wt.%) doped CuO nanoparticles have been successfully synthesized by the chemical precipitation method in an air atmosphere without using any high cost chemicals and instrumentation. The Ni doping modifies the structural and optical properties of undoped CuO. The blue shift of Ni doped CuO with respect to quantum size effect representing a change in band gap along with exciton features. This could be used as a measure of particle size and size distribution. The band gap energy has observed by UV–Visible which is highly greater than that of undoped, bulk, and other
[image:5.612.185.408.435.612.2]surface morphology of the sample was investigated through SEM images. It has same morphologies for undoped and 0.02 wt.% Ni doped CuO nanoparticles. The particle size and morphologies have directly measured by TEM images.
REFERENCE
[1] P. Mallick and S. Sahu, “Structure, Microstructure and Optical Absorption Analysis of CuO Nanoparticles Synthesized by Sol-Gel Route,” Nanoscience and Nanotechnology, vol. 2, no. 3, pp. 71–74, Aug. 2012.
[2] P. Yuvasree, K. Nithya, N. Neelakandeswari, N. Rajasekaran, K. Uthayarani, M. Chitra, and S. S. Kumar, “Phytochemical Preparation, Characterization and Photocatalytic Applications of Ag-TiO2 Nanocatalyst,” Advanced Materials Research, vol. 1086, pp. 1–6, Feb. 2015.
[3] M. Salavati-Niasari and F. Davar, “Synthesis of copper and copper(I) oxide nanoparticles by thermal decomposition of a new precursor,” Materials Letters, vol. 63, no. 3–4, pp. 441–443, Feb. 2009.
[4] P. Raveendran, J. Fu, and S. L. Wallen, “Completely ‘Green’ Synthesis and Stabilization of Metal Nanoparticles,” Journal of the American Chemical Society, vol. 125, no. 46, pp. 13940–13941, Nov. 2003.
[5] A. Nemamcha, J.-L. Rehspringer, and D. Khatmi, “Synthesis of Palladium Nanoparticles by Sonochemical Reduction of Palladium(II) Nitrate in Aqueous Solution,” The Journal of Physical Chemistry B, vol. 110, no. 1, pp. 383–387, Jan. 2006.
[6] A. A. Ponce and K. J. Klabunde, “Chemical and catalytic activity of copper nanoparticles prepared via metal vapor synthesis,” Journal of Molecular Catalysis A: Chemical, vol. 225, no. 1, pp. 1–6, Jan. 2005.
[7] S. S. Joshi, S. F. Patil, V. Iyer, and S. Mahumuni, “Radiation induced synthesis and characterization of copper nanoparticles,” Nanostructured Materials, vol. 10, no. 7, pp. 1135–1144, Jan. 1998.
[8] H. Ohde, F. Hunt, and C. M. Wai, “Synthesis of Silver and Copper Nanoparticles in a Water-in-Supercritical-Carbon Dioxide Microemulsion,” Chemistry of Materials, vol. 13, no. 11, pp. 4130–4135, Nov. 2001.
[9] A. Giusti, E. Giorgetti, S. Laza, P. Marsili, and F. Giammanco, “Multiphoton Fragmentation of PAMAM G5-Capped Gold Nanoparticles Induced by Picosecond Laser Irradiation at 532 nm,” The Journal of Physical Chemistry C, vol. 111, no. 41, pp. 14984–14991, Oct. 2007.
[10] A. Azam, A. S. Ahmed, M. S. Ansari, M. Shafeeq M, and A. H. Naqvi, “Study of electrical properties of nickel doped SnO2 ceramic nanoparticles,” Journal of Alloys and Compounds, vol. 506, no. 1, pp. 237–242, Sep. 2010.
[11] H. R. Naika, K. Lingaraju, K. Manjunath, D. Kumar, G. Nagaraju, D. Suresh, and H. Nagabhushana, “Green synthesis of CuO nanoparticles using Gloriosa superba L. extract and their antibacterial activity,” Journal of Taibah University for Science, vol. 9, no. 1, pp. 7–12, Jan. 2015.
[12] K. S. Prasad, A. Patra, G. Shruthi, and S. Chandan, “Aqueous Extract of Saraca indica Leaves in the Synthesis of Copper Oxide Nanoparticles: Finding a Way towards Going Green,” Journal of Nanotechnology, vol. 2017, pp. 1–6, 2017.
[13] J. Yu, S. Zhuang, X. Xu, W. Zhu, B. Feng, and J. Hu, “Photogenerated electron reservoir in hetero-p–n CuO–ZnO nanocomposite device for visible-light-driven photocatalytic reduction of aqueous Cr(vi),” Journal of Materials Chemistry A, vol. 3, no. 3, pp. 1199–1207, 2015.
[14] V. Ramasamy and G. Vijayalakshmi, “Effect of Zn doping on structural, optical and thermal properties of CeO2 nanoparticles,” Superlattices and Microstructures, vol. 85, pp. 510–521, Sep. 2015.