RESEARCH
Roles of cofactors and chromatin
accessibility in Hox protein target specificity
Ching Yew Beh
1†, Sherif El‑Sharnouby
2†, Aikaterini Chatzipli
2,3, Steven Russell
3,4, Siew Woh Choo
1*and Robert White
2*Abstract
Background: The regulation of specific target genes by transcription factors is central to our understanding of gene network control in developmental and physiological processes yet how target specificity is achieved is still poorly understood. This is well illustrated by the Hox family of transcription factors as their limited in vitro DNA‑binding specificity contrasts with their clear in vivo functional specificity.
Results: We generated genome‑wide binding profiles for three Hox proteins, Ubx, Abd‑A and Abd‑B, following
transient expression in Drosophila Kc167 cells, revealing clear target specificity and a striking influence of chromatin
accessibility. In the absence of the TALE class homeodomain cofactors Exd and Hth, Ubx and Abd‑A bind at a very similar set of target sites in accessible chromatin, whereas Abd‑B binds at an additional specific set of targets. Provi‑ sion of Hox cofactors Exd and Hth considerably modifies the Ubx genome‑wide binding profile enabling Ubx to bind at an additional novel set of targets. Both the Abd‑B specific targets and the cofactor‑dependent Ubx targets are in chromatin that is relatively DNase1 inaccessible prior to the expression of Hox proteins/Hox cofactors.
Conclusions: Our experiments demonstrate a strong role for chromatin accessibility in Hox protein binding and sug‑ gest that Hox protein competition with nucleosomes has a major role in Hox protein target specificity in vivo. Keywords: Hox proteins, Chromatin accessibility, Transcription factor
© 2016 Beh et al. This article is distributed under the terms of the Creative Commons Attribution 4.0 International License (http:// creativecommons.org/licenses/by/4.0/), which permits unrestricted use, distribution, and reproduction in any medium, provided you give appropriate credit to the original author(s) and the source, provide a link to the Creative Commons license, and indicate if changes were made. The Creative Commons Public Domain Dedication waiver (http://creativecommons.org/publicdomain/ zero/1.0/) applies to the data made available in this article, unless otherwise stated.
Background
The control of specific sets of target genes by transcription factors is central to our understanding of the gene net-works regulating development, physiological responses and disease processes. However, many questions remain concerning how transcription factors identify their spe-cific targets in the genome. In particular, many transcrip-tion factors bind to short degenerate sequence motifs, which occur at high frequency in the genome, and it is unclear how their regulatory function is restricted to spe-cific sets of targets. Hox proteins are key developmen-tal regulators that illustrate this issue well. They bind to short AT-rich motifs with individual members of the
Hox family exhibiting very similar in vitro DNA-binding preferences (reviewed in [1]). In contrast, different Hox proteins show clear in vivo functional specificity by regu-lating the development of very different segmental mor-phologies (reviewed in [2]). The discrepancy between the relative lack of in vitro DNA-binding specificity and the clear in vivo developmental specificity is still unresolved. The identification of Hox cofactors, proteins that interact with Hox proteins and enhance their DNA-binding speci-ficity, provides a partial explanation. The Three Amino acid Loop Extension (TALE) homeodomain cofactors, Extradenticle (Exd) and Homothorax (Hth) in Drosophila
and their vertebrate Pbx/Meis homologues, increase the specificity of Hox binding in vitro [3–5] and contribute to in vivo Hox specificity (reviewed in [1]). These Hox cofac-tors have been shown to engage in tripartite Hox/Exd/ Hth (Hox/Pbx/Meis) complexes that enable Hox func-tional specificity in vivo at particular target sites [6–8]. In addition, interaction between Hox proteins and these
Open Access
*Correspondence: lchoo@um.edu.my; rw108@cam.ac.uk
†Ching Yew Beh and Sherif El‑Sharnouby contributed equally to this work 1 Department of Oral Biology and Biomedical Sciences, Faculty
of Dentistry, University of Malaya, 50603 Kuala Lumpur, Malaysia
2 Department of Physiology, Development and Neuroscience, University
cofactors differentially affects the binding preferences of Hox proteins enabling the emergence of “latent specific-ity” of Hox binding in the context of the Hox-cofactor complex [9]. However, in some situations Hox proteins act in the absence of Exd/Hth, for example in the classic transformation of the Drosophila wing blade primordium to haltere by the Hox protein Ultrabithorax (Ubx) [10]. Although the in vivo study of endogenous Hox target gene regulatory elements has provided insight into the roles of cofactors at specific targets, relatively few target sites have been studied and there is no clear general understanding of the role of cofactors in Hox specificity; indeed at some regulatory elements the cofactors appear to be required for specific functional activity, gene activation rather than repression, and not for DNA-binding specificity [11].
In general, although there is a wealth of in vitro data on Hox specificity [12, 13], how these extrapolate to the in vivo situation is currently unclear. Genome-wide stud-ies in Drosophila tissues have investigated Hox protein and cofactor binding and have identified Hox binding sites and target genes [14–16]. These in vivo studies also suggest an important role for chromatin accessibility in determining where in the genome Hox proteins bind, supporting the view that chromatin accessibility gener-ally plays a key role in transcription factor target specific-ity [17]. However, for the detailed analysis of Hox binding specificity, in vivo tissues have the disadvantage of cel-lular heterogeneity with different cells having different chromatin states and cofactor expression. Here we have investigated Hox binding specificity in a Drosophila cell line that is relatively homogeneous, facilitating a rigor-ous comparative analysis of the binding of different Hox proteins in the same genomic background and under the same conditions. Using carefully controlled Hox protein expression in Kc167 cells we show that Hox proteins exhibit clear target specificity in the absence of the Exd and Hth cofactors. These cofactors can nevertheless play a key role in Hox protein binding and we demonstrate their effect on the genome-wide target specificity of Ubx. Our experiments also provide further evidence of the strong role chromatin accessibility plays in Hox binding and suggest that Hox competition with nucleosomes has a major role in Hox target specificity in vivo.
Results
Specific Hox protein binding in Kc167 cells
To compare the binding profiles of different Hox pro-teins, we used transient transfection of Drosophila Kc167 cells with inducible expression constructs producing Hox-GFP fusion proteins and generated genome-wide binding profiles using Chromatin Immunoprecipitation followed by high-throughput sequencing (ChIP-Seq). Kc167 cells do not express Hox proteins endogenously
and also lack functional Exd and Hth cofactors; although Exd is expressed, in the absence of Hth it is cytoplasmic. In order to ensure that the Hox binding profiles gener-ated by our experiments are as comparable as possible: (1) we processed the different samples in parallel using cells taken from the same mother-culture, (2) we sorted the transfected cells 4 h after expression induction using a Fluorescence-Activated Cell Sorter (FACS) to select cells expressing the same level of Hox-GFP fusion protein and (3) we used the same anti-GFP antibody for all ChIP assays (Additional file 1: Figure S1, S2). We confirmed that the Hox-GFP expression level is close to the physi-ological range. Estimates of the number of homeodo-main protein molecules per nucleus range from 20,000 to 50,000 [18–21]. We estimate that the Ubx-GFP express-ing cell population selected by FACS has expression lev-els from 38,000 to 74,000 Ubx-GFP molecules per cell (see “Methods”).
We compared the binding of the three Bithorax com-plex Hox proteins; Ubx, Abdominal-A (Abd-A) and Abdominal-B (Abd-B), with a visual inspection of the binding profiles suggesting highly similar Ubx and Abd-A binding. In contrast, while Abd-B largely binds at the same sites as Ubx and Abd-A, it also clearly binds at a considerable number of additional sites (Fig. 1a). To quantify this we carried out overlap analysis of the bind-ing peaks and found, for example, that 89 % of Ubx peaks overlap with Abd-A peaks (Fig. 1b). In contrast, while 90 % of Abd-A peaks overlap with Abd-B peaks, Abd-B clearly binds at additional sites as only 53 % of Abd-B peaks overlap Abd-A peaks (Fig. 1b). Our observations are further supported by Pearson’s correlations between the binding scores of different Hox proteins (Fig. 1c). We conclude that Hox proteins exhibit clear target specificity when binding to Kc167 cell chromatin.
a
b
c
Ubx
Abd-A
Abd-B
DNase1
chr3L
12,600,000 12,700,000 12,800,000 12,900,000
Ubx Abd-B
DNase1
Ubx Abd-A
DNase1
Abd-A Abd-B
DNase1
Ubx Abd-A Abd-B
76%
89% 87% 43% 90% 53%
95% 94% 75%
Ubx Ubx
Abd-A
Abd-A
Abd-B Abd-B
R=0.97 R=0.84 R=0.88
0 0
0 0
0 0 100
1349
523 622 573
223 334
4307 4208 5473 5083 4598
10213
4607 5322 9498 2421 7260 7560
100
100 100
100 100
200 200
200 200
200 200
300 300
300 300
300 300
400 400
400 400
400 400
500 500
500 500
500 500
[image:3.595.58.540.88.656.2]direct interaction with DNA rather than indirect binding through, for example, protein–protein interactions.
Ubx binds at additional sites in the presence of Exd and Hth
To test the role the Hox cofactors Exd and Hth play in Hox binding, we transfected Kc167 cells with a bicis-tronic construct expressing the Ubx-GFP fusion together with Hth (Fig. 3a) and assayed Ubx binding by ChIP-Seq. As shown in Fig. 3b, although Kc167 cells express Exd, it is exclusively cytoplasmic due to the absence of Hth. The provision of Hth enables the nuclear accumulation of Exd and thus nuclear availability of both cofactors. In comparison with Ubx alone, the expression of Ubx in conjunction with Hth leads to a considerable increase in Ubx binding, with over 4000 high stringency (q-value 1e−10) additional binding peaks (Fig. 3c, d). This clearly
demonstrates that the Exd and Hth cofactors can change the binding specificity of Ubx and enable binding at a large number of new sites.
Hox protein binding and chromatin accessibility
In our previous analysis of genome-wide Ubx and Hth binding in Drosophila embryos and imaginal discs, we suggested that the similarity in the Ubx and Hth binding profiles and the exclusion of Ubx and Hth binding from repressed chromatin indicated a major role for chromatin accessibility in governing the binding of these transcrip-tion factors [14]. Genome-wide chromatin accessibility has been mapped in the Kc167 cell line by DNase1 profiling [24], and comparing the DNase1 profile to the Hox ing profiles reveals a very strong association between bind-ing and accessibility (Fig. 1a). Overlap analysis (Fig. 1b) indicates that virtually all of the Ubx and Abd-A binding is 1...3....5...47....50...60
Ubx wild type
Ubx mutant
Ubx mutant
Ubx wild type
chr3R
10,200,000 10,400,000 10,600,000
Ubx wild type
Ubx mutant
a
b
5 3 51 47 50 54
N-terminal Helix-3
minor groove major groove
Homeodomain
0 0
40 80 40 80
80%
34%
c
2778 1440 353 RRRGRQTYTRYQTLELEKEFHTNHYLTRRRRIEMAHALCLTERQIKIWFQNRRMKLKKEI
RRAGAQTYTRYQTLELEKEFHTNHYLTRRRRIEMAHALCLTERQIKAWFKARRMKLKKEI
Ubx homeodomain
DNA binding
[image:4.595.56.545.86.419.2]in pre-existing DNase1 accessible chromatin; for example 95 % of Ubx peaks overlap DNase1 peaks. For Abd-B bind-ing, there is considerable overlap with accessible chroma-tin, with 75 % of Abd-B peaks overlapping DNase1 peaks. However, in this case we also observe a considerable por-tion of the binding (25 %) that does not overlap DNase1 peaks. This indicates that Abd-B binds to regions whose accessibility is low prior to the expression of Abd-B, sug-gesting that Abd-B is able to compete with nucleosomes.
For Ubx binding in the presence of Hth (Fig. 3e), the situa-tion is similar to Abd-B; there is considerable overlap with accessible chromatin, with 83 % of Ubx + Hth peaks over-lapping DNase1 peaks, and the remaining 17 % of binding occurring in DNase1 inaccessible chromatin.
Binding motif analysis
To understand the DNA sequences underpinning the Hox binding profiles we performed motif enrichment
342 1337
Ubx+Hth DNase1
Ubx Ubx+Hth
49% 92% 83%
pMT-Hth2AGFPUbx
a
b
c
d
e
Hth − Hth + Hth +
Hth
eGFP
Ubx
MT promoter
T2A
AmpR
SV40 pA V5 tag 6x His
Ubx+Hth Ubx
chr3L
21,100,000 21,200,000 21,300,000 21,400,000
3876
4095 6634 8186
Exd
Exd Exd
Ubx-GFP
10 µm
[image:5.595.57.539.88.475.2]analysis using PWMs for members of the Drosophila
Hox family in the MotifDb database. Since the Ubx and Abd-A binding profiles strongly mirror the chromatin accessibility profile, we first examined the DNase1 peaks and found they do not show enrichment for Hox PWMs (Fig. 4a). Initial analysis of Ubx peaks revealed modest enrichment for Hox PWMs. However, the relative level of Ubx versus DNase1 signal varies for different Ubx peaks, so we decided to focus our analysis on the Ubx peaks that show the highest differential between Hox binding and DNase1 accessibility. As shown in Fig. 4a, these peaks show clear enrichment for Hox PWMs. All the Hox PWMs show some enrichment, although the enrichment
scores for the posterior Hox PWMs (Antp, Ubx, Abd-A and Abd-B) are higher than for the anterior Hox PWMs (Lab, Dfd and Scr). Interestingly, Abd-B motifs, rather than Ubx motifs, show the highest enrichment. The PWMs for the Hox cofactors show little if any enrich-ment, in agreement with the fact that these proteins are not functional in Kc167 cells. As described above, the peaks associated with the mutant Ubx protein show no enrichment for Hox PWMs (Fig. 4b). We interpret these data to indicate that, although the Ubx profile closely mirrors chromatin accessibility, Ubx does not bind non-specifically but rather shows clear specificity for Hox PWM motifs within accessible chromatin.
La
b
Df
d
Scr Antp Ubx AbdA AbdB Exd Hth Lab Dfd Scr Antp Ubx AbdA AbdB Exd Hth
Ubx
Ubx Ubx
a
b
c
d
DNase1 Ubx mutant
Ubx Ubx+Hth
Abd-B
La
b
Df
d
Scr Antp Ubx AbdA AbdB Exd Hth Lab Dfd Scr Antp Ubx AbdA AbdB Exd Hth
Lab Dfd Scr Antp Ubx AbdA AbdB Exd Hth Lab Dfd Scr Antp Ubx AbdA AbdB Exd Hth
Lab Dfd Scr Antp Ubx AbdA AbdB Exd Hth Lab Dfd Scr Antp Ubx AbdA AbdB Exd Hth
0 10 20 30
0 10 20 30
0 100 200 300
0 40 80
enrichment score enrichment score
enrichment score enrichment score
Anterior
Hox PosteriorHox factorsco- AnteriorHox PosteriorHox factors
co-Anterior
Hox PosteriorHox factorsco- AnteriorHox PosteriorHox factors
co-Anterior
Hox PosteriorHox factorsco- AnteriorHox PosteriorHox factors
co-Anterior
Hox PosteriorHox factorsco- AnteriorHox PosteriorHox factors
[image:6.595.59.540.272.592.2]This view is supported by the lack of Hox PWMs in DNase1 accessible regions that show no Ubx bind-ing. For example, the Abd-B PWM “AbdB_SOLEXA_ FBgn0000015” is highly enriched in the peaks that show higher Ubx versus DNase1 signal (17th out of the 709 motifs in the MotifDb database, p = 4.8e−34). For the general class of Ubx peaks that overlap DNase1 accessible regions, this Abd-B PWM is still enriched but its rank-ing drops to 61st (p = 3.3e−16). However, in the DNase1 regions with no Ubx binding, this motif is ranked bottom of the list (p = 1). This indicates that we do not detect Ubx binding in accessible chromatin that lacks Hox PWMs.
Comparing Abd-B peaks with Ubx peaks, again exam-ining peaks with the highest differential between Hox binding and DNase1 accessibility, we find that Abd-B peaks show higher enrichment for Hox PWMs (Fig. 4c). The relative enrichments of the different Hox PWMs show a similar pattern to the Ubx peaks, with the PWMs for the more posterior Hox genes showing highest enrichments.
We then examined the effect of adding the Exd and Hth cofactors on Hox PWM enrichments in the Ubx peaks. The presence of these cofactors results in a dramatic increase in the enrichments for Exd and Hth PWMs (Fig. 4d), and the relative enrichments of the Hox PWMs appear to be shifted towards a greater preference for the Abd-B PWM. Overall this indicates that, in conjunction with Exd and Hth, Ubx can bind at a novel set of sites that have Hox, Exd and Hth motifs and that association with cofactors alters Ubx binding preference.
Analysis of Hox DNA‑binding “fingerprints”
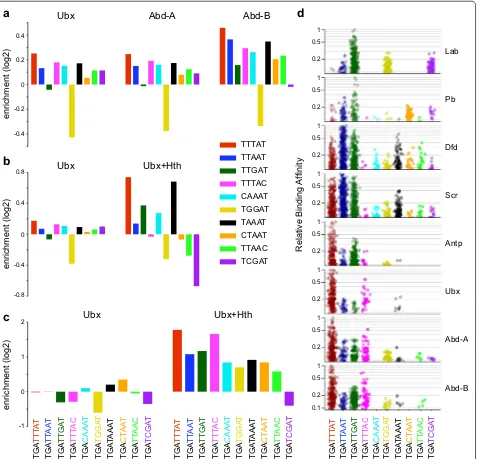
To further examine the sequence specificity of Hox binding, we measured the enrichment of specific k-mer sequences derived from in vitro SELEX-Seq studies; a set of core Hox binding 5-mers and a set of 8-mer sequences associated with Hox-cofactor binding that have been used to generate sequence preference “fingerprints” for different Hox proteins [9]. Examining the set of Hox bind-ing 5-mers, we find that Ubx, Abd-A and Abd-B show a similar profile, with TTTAT (red) being the most highly enriched and TGGAT (yellow) being depleted relative to background sequences. Abd-B shows higher enrich-ments and a profile of enrichment that differs slightly from that of Ubx and Abd-A, but overall it appears that in the absence of Exd and Hth, these three Hox proteins bind very similar sequences in vivo (Fig. 5a). For Ubx in the presence of Exd and Hth, the 5-mer enrichment pro-file is considerably altered compared to Ubx on its own, showing both higher scores and changes in the relative enrichments of particular motifs (Fig. 5b). Some of these changes may be related to the inclusion of Exd and Hth
binding motifs in the peak sequences; notably the dark green k-mer containing the core Exd motif TGAT [13] is more enriched. In addition, the red k-mer, containing the core Hox motif TTAT, is relatively more enriched com-pared to the dark blue k-mer containing the core TAAT motif. This fits with the enhanced enrichment of Abd-B family PWMs (with the Hox core consensus TTAT; [13]) over Ubx family PWMs (with the Hox core consensus TAAT; [13]) noted in the PWMEnrich analysis in Fig. 4d. Overall, this supports a cofactor-dependent modification of Hox binding specificity in vivo that is in line with the “latent specificity” model derived from in vitro data [9].
The SELEX-Seq analysis investigated in vitro Hox bind-ing preferences in the presence of cofactors usbind-ing full-length Exd and a truncated Hth that contains the Exd interaction domain but not the homeodomain [9]. Based on a set of 8-mer sequences, this analysis indicated that different Hox proteins, in association with Exd and Hth, exhibit preferential binding profiles or “fingerprints” which fall into three classes: an anterior class of Lab and Pb, a central class of Dfd and Scr and a posterior class of Antp, Ubx, Abd-A and Abd-B, each class displaying pref-erential binding to a distinct combination of 8-mers. We compared the in vivo 8-mer enrichment profile for Ubx binding in the presence of Exd and Hth with the in vitro SELEX-Seq fingerprints, and found that it strongly resembles the posterior class fingerprint (Fig. 5c, d); with TGATTTAT (red) being most enriched, followed by TGATTTAC (magenta), then TGATTGAT (dark green) and TGATTAAT (dark blue). Two additional features are worth mentioning: first, the in vivo Ubx profile resem-bles the general posterior class fingerprint rather than the Ubx fingerprint specifically (i.e. it does not show the prevalence of TGATAAAT (black) over TGATG-GAT (yellow) that is a feature of the in vitro Ubx finger-print). Second, two 8-mers, TGACAAAT (light blue) and TGACTAAT (orange), are prominent in the in vivo profile but not in the in vitro fingerprint. This is inter-esting since both these sequences contain TGAC, a core Hth binding motif. The in vitro fingerprints were derived from complexes lacking the Hth DNA-binding domain; the enrichment of the TGAC-containing 8-mers suggests that the specific DNA binding of Hth plays a role in the in vivo targeting of the Ubx-cofactor complex.
Hox competition with chromatin
a
b
c
d
-0.2 0 0.2 0.4 -0.4 -0.8 0 0.8 0.4 -0.4 TTTAT TTAAT TTTAC TGGAT TTGAT CAAAT CTAAT TTAAC TCGAT TAAAT 0 1 2 -1 TG A TT TA T TG A TT AA C TG A CT AA T TGA TA AA T TG A TGGA T TG A CAAA T TG A TT TA C TG A TTGA T TG A TT AA T TG A TCGA T TG A TGGA T TG A TT TA T TG A CAAA T TG A TT TA C TG A TTGA T TG A TT AA T TG A TT AA C TG A CT AA T TGA TA AA T TG A TCGA T TG A TT TA T TG A TT AA C TG A CT AA T TGA TA AA T TG A CAAA T TG A TT TA C TG A TTGA T TG A TT AA T TG A TCGA T TG A TGGA T UbxUbx Abd-A Abd-B
Ubx+Hth Ubx Ubx+Hth Relative Binding Af finity enrichment (log2 ) enrichment (log2) enrichment (log2 ) 0.1 0.2 0.5 1 0.2 0.5 1 0.2 0.5 1 0.2 0.5 1 0.2 0.5 1 0.2 0.5 1 0.2 0.5 1 0.2 0.5 1 Lab Pb Dfd Scr Antp Ubx Abd-A Abd-B
[image:8.595.63.541.89.548.2]peaks overlap DNase1 peaks, only 58 % of the Abd-B spe-cific peaks do (Fig. 6a).
The ability of Abd-B to bind DNase1 inaccessible regions is supported by an analysis of the DNase1-Seq counts in the Hox binding peaks. The Abd-B peaks in common with Ubx show high DNase1 accessibility,
whereas the peaks specifically bound by Abd-B show strongly reduced accessibility (Fig. 6c). A similar situation holds for the comparison of Ubx peaks in the absence and presence of Exd and Hth. In the absence of these cofac-tors, the Ubx peaks largely correspond to DNase1 acces-sible regions by overlap analysis (Fig. 1b). The common
0 1 2 3 4 5 6 7 8
DNase1 score
Abd-B/Ubx
common specificAbd-B Ubx+Hth/Ubxcommon Ubx+Hthspecific DNase1
a
b
c
100
DNase1 DNase1
DNase1 115
148 Abd-B/Ubx
common
Ubx+Hth/Ubx common
Abd-B specific
Ubx+Hth specific
YELLOW RED Active chromatin
d
e
f
g
genome DNase1 Ubx Abd-A Abd-B Abd-B/Ubx
common specificAbd-B Ubx+Hth/Ubxcommon Ubx+Hthspecific
percentage of total peak lengt
h
percentage of genome
percentage of total peak lengt
h
percentage of total peak lengt
h
0 20 40 60 80
100 100 100
0 0 0
BLUE
GREEN Repressive chromatin
BLACK
2306 3167 11653
11092
3728 1189 2906 11914 4093 10727
58%
71%
97%
96%
[image:9.595.60.540.187.568.2]peaks, bound by Ubx both in the absence and presence of the cofactors, show almost complete overlap (96 %) with DNase1 peaks (Fig. 6b) and have high DNase1 accessibil-ity when assessed by DNase1-Seq count analysis (Fig. 6c). In contrast, the Ubx peaks that are cofactor-dependent show less overlap (71 %) with DNase1 peaks (Fig. 6b) and have markedly reduced accessibility when assessed by DNase1-Seq count analysis (Fig. 6c).
This relationship between Hox binding and tin accessibility is supported by analysis of the chroma-tin states associated with bound regions. We used the five-state classification derived from chromatin protein analysis in Kc167 cells [25]. As expected, in comparison to the overall prevalence of the different states across the genome, the DNase1 peaks are preferentially in the “active” red and yellow states (Fig. 6d, e). The chromatin state profile of the Ubx and Abd-A peaks closely resem-bles that of the DNase1 peaks, whereas for Abd-B the chromatin state profile is shifted towards the repressed blue and black states (Fig. 6e). The Abd-B peaks can be subdivided into those that overlap with the Ubx/Abd-A peaks and those that are Abd-B specific. The overlapping peaks show a clear “active” chromatin profile, similar to DNase1, whereas the Abd-B specific peaks show a profile strongly shifted towards the “repressed” blue and black states (Fig. 6f). A similar situation holds for the compari-son of cofactor-independent versus cofactor-dependent Ubx peaks. The cofactor-independent peaks (i.e. the peaks that are common between Ubx binding on its own and Ubx binding in the presence of Exd/Hth) show an “active” chromatin profile, whereas the cofactor-depend-ent peaks (i.e. the peaks occurring only in the presence of Exd/Hth) show a chromatin profile markedly shifted towards the “repressed states” (Fig. 6g).
Overall, these data indicate that, although much of the Hox binding is to open chromatin, there are two situa-tions where Hox proteins can bind in less-accessible regions: Abd-B specific binding and cofactor-depend-ent Ubx binding. In the latter situation, the interac-tion between Ubx and the cofactors Exd/Hth provides a rationale for the ability of Ubx to bind in less-accessible chromatin. However what is the basis for Abd-B’s spe-cific ability to access a set of relatively closed chroma-tin regions? One possibility is that Abd-B can uniquely recruit a cofactor present in Kc167 cells; while we do not have strong evidence against the Abd-B cofactor idea, we do not see a clear candidate cofactor binding motif co-enriched with Hox motifs in these regions. Alternatively these regions may contain high affinity binding sites uniquely for Abd-B. We looked at 5-mer enrichments, comparing Abd-B peaks in accessible chromatin (where Abd-B largely binds in common with Ubx and Abd-A) with Abd-B peaks in DNase1-inaccessible regions and
find that, although 5-mer enrichments are generally higher for the latter, the relative enrichments of the dif-ferent k-mers are similar (Fig. 7a).
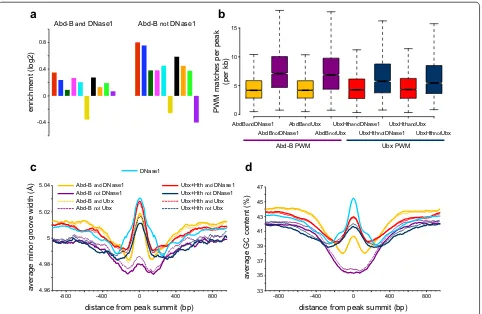
We identified two potentially relevant features of the Abd-B specific peaks associated with closed chromatin. First, as compared to the peaks in accessible chromatin, they have a higher density of matches to the Abd-B PWM (median 6.5 matches/kb for the “Abd-B not DNase1” peaks versus 4.5 matches/kb for the “Abd-B and DNase1” peaks, p = 0.001; Fig. 7b). Second, we find that the DNA shape profile differs between the Abd-B peaks in acces-sible versus inaccesacces-sible chromatin. DNA shape, particu-larly the width of the minor groove, has been proposed to play a major role in the specificity of Hox binding as the N-terminal arm of the homeodomain makes spe-cific electrostatic contacts within the minor groove [22,
23]. We find that the Abd-B peaks in accessible chro-matin have a predicted wider minor groove in a region of about 200 bp centred on the peak summits. As these peaks are associated with chromatin accessibility, we investigated the DNase1 peaks themselves and find that this local increase in minor groove width is a general feature of DNase1 accessible regions. In contrast, the Abd-B peaks in closed chromatin have a narrower minor groove (Fig. 7c). A narrow minor groove has been associ-ated with Hox binding affinity and specificity as it allows for stronger ionic interactions [26, 27]. This difference in DNA shape is also associated with a lower GC content for the Abd-B peaks in closed chromatin (Fig. 7d).
Discussion
We have performed a comparative analysis of Hox pro-tein binding specificity in the context of chromatin in Drosophila tissue culture cells, extending previous in vitro analyses of Hox protein specificity and revealing a strong influence of chromatin accessibility on Hox bind-ing. Our investigation also allowed an in vivo assessment of previously defined in vitro Hox binding preferences and an analysis of the role of the major Hox cofactors, Exd and Hth.
transcription factor binding, the prior chromatin acces-sibility state has been clearly shown to dictate the bind-ing sites for Heat Shock Factor and the glucocorticoid receptor [29, 30]. In contrast, the reprogramming factors Oct4, Sox2 and Klf4 preferentially bind closed chroma-tin [31]. In our studies, using exogenous expression of Hox proteins in a cell line, we also relate the Hox bind-ing profiles to the pre-existbind-ing state of chromatin acces-sibility. We find that Ubx and Abd-A binding is almost exclusively in accessible chromatin, whereas Abd-B can additionally bind to regions whose accessibility is low
prior to the expression of Abd-B. Interestingly, Ubx is also able to bind in less-accessible chromatin in the pres-ence of the Exd and Hth cofactors. These results con-firm expectations that nucleosomes play a major role in restricting Hox protein access to binding sites [14, 32], but also reveal circumstances where Hox proteins can effectively compete with nucleosomes to access sites residing in DNase1 inaccessible chromatin. This indicates that a key issue in understanding Hox binding specificity is how Hox proteins compete with nucleosomes and this is a major question for the understanding of transcription
a
0 0.4 0.8
-0.4
Abd-B and DNase1
enrichment (log2)
Abd-B not DNase1
AbdBandDNase1 AbdBnotDNase1
AbdBandUbx AbdBnotUbx
UbxHthandDNase1 UbxHthnotDNase1
UbxHthandUbx UbxHthnotUbx
PWM matches per peak
(per kb
)
0 5 10 15
Abd-B PWM Ubx PWM
b
c
d
4.96 4.98 5 5.02 5.04
average minor groove width (Å)
0 400
-400
-800 800 33 -800 -400 0 400 800
35 37 39 41 43 45 47 DNase1
Abd-B not DNase1 Abd-B and DNase1
Ubx+Hth not DNase1 Ubx+Hth and DNase1
Abd-B and Ubx
Abd-B not Ubx Ubx+Hth Ubx+Hth notand Ubx Ubx
average GC content (%
)
distance from peak summit (bp) distance from peak summit (bp)
[image:11.595.59.541.88.402.2]factor binding in general. Our observation of two differ-ent situations where Hox proteins can effectively compete provides insight into this process. We have investigated the sequence characteristics of the subset of Abd-B peaks occurring in inaccessible chromatin to probe the basis of Abd-B’s pioneer activity at these sites. One possibility is that these sites contain particularly high affinity Abd-B DNA-binding motifs; however at least when using a set of Hox monomer binding 5-mers we find little evidence for this, since the enrichment profile of these 5-mers is very similar for Abd-B peaks occurring in accessible and inac-cessible chromatin. We did however find an increased density of matches to the Abd-B PWM in peaks occur-ring in inaccessible chromatin, suggesting that a critical factor may be the number of Abd-B molecules able to bind in a particular region. We also observed an inter-esting connection to DNA shape. We show that DNase1 accessible regions are generally associated with a small local increase in DNA minor groove width over a region of about 200 bp centred on the DNase1 peak summits (Fig. 7c). This is potentially important as wider minor grooves decrease the negative electrostatic potential of the DNA and are associated with weaker histone-DNA interactions [27, 33]. While the Abd-B/Ubx common peaks also show a similar local widening of minor groove width, the Abd-B specific sites do not. The Abd-B spe-cific sites tend to have narrower minor grooves, a feature that is associated with increased Hox protein binding affinity due to enhanced electrostatic interaction with the N-terminal arm of the homeodomain [26, 34]. The rela-tive effect of DNA shape on nucleosome stability versus homeodomain binding affinity may set in place a fine competitive balance for binding at these sites. For Ubx, the provision of the Hox cofactors Exd and Hth allows Ubx to bind at sites in DNase1 inaccessible chromatin that are not bound in the absence of the cofactors. This provides strong in vivo evidence supporting the key role these cofactors play in Hox protein binding as suggested by in vitro studies [3–5]. It also suggests that an impor-tant role of cofactors in vivo involves the establishment of Hox binding through competition with nucleosomes at target sites. The cofactor-dependent Ubx peaks are associated with enrichment of Hox, Exd and Hth bind-ing motifs indicatbind-ing the involvement of the bindbind-ing of several proteins. The common theme we see between the two types of binding in DNase1 inaccessible chromatin, Abd-B specific peaks and cofactor-dependent Ubx peaks, is the multiple binding of proteins at these sites. The combined effect of multiple protein binding events may be the basis for effective competition with nucleosomes, consistent with the collaborative competition mechanism proposed by Miller and Widom [35].
One caveat to our interpretation of the Abd-B specific binding and cofactor-dependent Ubx binding in DNase1 inaccessible chromatin is the possibility of indirect effects. For example, Abd-B could activate the expres-sion of a transcription factor responsible for opening the chromatin at novel sites. Although it is difficult to exclude indirect effects, we see no evidence for them. We do not find a clear novel DNA motif at the Abd-B spe-cific sites. Also, the cofactor-dependent Ubx peaks show strong enrichment of Exd and Hth motifs, consistent with a direct effect.
Extensive in vitro analysis of Hox DNA-binding pref-erences has identified that, while they all bind short AT-rich sequences, the individual Hox proteins have subtly different preferred motifs [12, 13]. We find some support for the relevance of these preferences for in vivo bind-ing in that the bindbind-ing peaks of Ubx, Abd-A and Abd-B all show better enrichment scores for PWMs of poste-rior Hox proteins (Ubx, Abd-A and Abd-B) compared to PWMs of anterior Hox proteins (Lab, Dfd and Scr). However, within the posterior class there is no clear cor-relation between the in vitro preferences and the in vivo enrichments since the Abd-B PWMs show the highest enrichment for all three of the posterior Hox proteins we assayed. Overall, we do not see clear evidence for distinct motifs bound by Ubx, Abd-A or Abd-B.
In vitro, DNA-binding specificity of Hox proteins is enhanced by the Exd and Hth cofactors [3–5], and we identify a Hox/Exd consensus binding motif (5′ -TGATT-TAT-3′) as the most enriched motif in de novo motif searches on the cofactor-dependent Ubx peak sequences (Additional file 1: Figure S3). The cofactor-dependent Ubx binding peaks show an 8-mer enrichment finger-print that closely matches the in vitro SELEX-Seq Ubx-Exd fingerprint [9], with clear features that place it in the posterior Hox class. However, the match is to the poste-rior Hox class as a whole rather than specifically to the Ubx fingerprint.
A close connection between chromatin accessibility and Hox function is also indicated by experiments com-paring chromatin accessibility in Hox-regulated tissues. For example, the chromatin accessibility profile of wing and haltere imaginal discs are strikingly similar [43]. Thus although Ubx specifies haltere rather than wing develop-ment, this regulation of appendage morphology occurs with little change to the genomic open chromatin profile, suggesting that Ubx acts predominantly on regulatory elements that are already accessible in the “ground state” wing developmental program.
Our experiments focus on Hox binding rather than overall Hox function and we demonstrate that Hox speci-ficity is represented at the level of binding with the dif-ferential binding of Ubx/Abd-A versus Abd-B. The focus on binding also allows us to show that Hox cofactors do not only affect Hox function but also clearly affect the target specificity of Hox proteins in vivo, enabling Ubx to bind cofactor-dependent targets that it cannot bind on its own.
Conclusions
We have established a flexible platform for the analysis of target specificity of Hox transcription factors in the Dros-ophila Kc167 cell line. This enables us to move beyond in vitro studies of Hox binding specificity to perform genome-wide binding analysis on an in vivo chroma-tin substrate. In this system, we show that Hox proteins exhibit specific binding in the absence of the canonical Hox cofactors Exd and Hth, with Abd-B targeting sites that are not bound by either Ubx or Abd-A. Nevertheless, Exd and Hth can have a strong impact on target specific-ity and their provision enables Ubx to bind at a novel set of targets that it cannot access in their absence. In con-trast to the common Hox binding sites, both the Abd-B specific sites and the cofactor-dependent Ubx sites are in relatively closed chromatin indicating that competi-tion with nucleosomes may play a key role in determin-ing Hox target specificity. The involvement of chromatin in Hox binding has implications for the specificity of the downstream gene expression response to Hox regulation. This may be particularly important for the regulation of different sets of target genes in specific tissue types or particular tumour cells where much of the target gene selection may be based on differences in the chromatin landscape in the different cells.
Methods Cell culture
Kc167 cells (obtained from the Drosophila Genomics Resource Center) were cultured in Schneider’s medium supplemented with 5 % foetal calf serum and antibiotics at 25 °C.
Expression plasmid cloning
The Hox cDNA clones were obtained from the Berke-ley Drosophila Genome Project (BDGP) Gold collection provided by the Drosophila Genomics Resource Center: Ubx (clone RE43738 encoding protein isoform E), Abd-A (clone RE04174 encoding protein isoform common to transcripts A/C/D), Abd-B (clone RE47096 encoding pro-tein isoform common to transcripts A/C/D/E: the Abd-B clone had a single point deletion of an A at position 1289 (position 578 of the CDS), which was reintroduced by site-directed mutagenesis). To generate the GFP-tagged Hox expression vectors, the eGFP CDS (with stop codon removed) was cloned upstream of each Hox CDS and the resulting fusion cloned as an EcoRI-XbaI fragment in the MCS of the pMTA expression vector (Invitrogen V4120-20) under the control of the inducible Drosophila
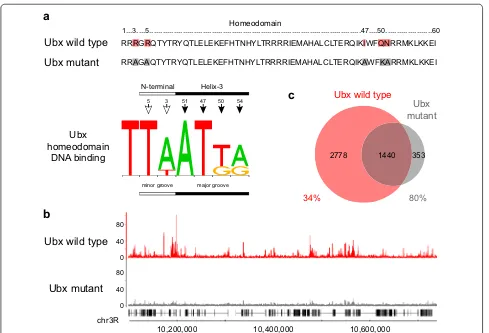
metallothionein promoter. The Hth cDNA clone (pro-tein isoform A) was obtained from Richard Mann. For the co-expression of Ubx and Hth, we used a bicistronic expression vector employing the 2A peptide self-cleavage system. The Hth CDS (with stop codon removed) was cloned upstream of the eGFP-Ubx CDS, separated by the T2A peptide sequence used in pAc5-STABLE2-Neo [44]. The resulting fusion was cloned as an EcoRI-ApaI fragment in the MCS of the pMTA expression vector. To generate Ubx with mutations affecting DNA-binding, the following mutations were introduced in the Ubx homeo-domain sequence: R3A, R5A, I47A, Q50K and N51A. For more detailed information about the Hox constructs used in this study see Additional file 2.
Transfection, induction of gene expression and fixation
Cells harvested in log phase were used to seed two 10 cm dishes per sample (Nunclon™ Delta treated, Nunc 150350) at a density of 2 × 10⁷ cells per dish. We
per-formed two experiments; Ubx, Abd-A and Abd-B sam-ples were seeded using the same harvested cells in
Experiment 1 and Ubx, mutant Ubx and Ubx + Hth
likewise in Experiment 2. Cells were allowed to settle and adhere to the dish surface for about 3 h, and trans-fection was performed using FuGENE® 6 Transfection Reagent (Promega E2691) according to the manufactur-er’s instructions. For each dish, 1.5 ml of 1.5:1 FuGENE®: DNA mix was prepared in a 5 ml polypropylene tube (BD Falcon 352063) by adding 45 µl FuGENE® and 30 µg DNA (150 µl of 0.2 µg µl−1 DNA prepared in TE buffer) to
induction, medium was removed and replaced by 10 ml of 500–1000 µM CuSO4 in Schneider’s medium. Dishes
were incubated at 25 °C for 4 h. Cells were harvested, spun down at 300g for 3 min, and fixed using 1 % formal-dehyde (Sigma-Aldrich F8775) in PBS for 10 min at 23 °C in an Eppendorf Thermomixer at 700 rpm. Fixation was stopped by spinning at 3000g for 1 min, placing the sam-ples immediately on ice, washing once in PBS/125 mM Glycine/0.01 % Triton X-100 and twice in PBS/0.01 % Triton X-100.
FACS
Samples were filtered (30 µm, Partec 04-004-2326) and diluted to an appropriate concentration for FACS sort-ing by addsort-ing PBS/0.01 % Triton X-100 to a final vol-ume of 3 ml. Cells were sorted using a 70 µm nozzle on a MoFlo FACS machine (Beckman Coulter) equipped with a 488 nm argon laser (100 mW). Cells were sorted into PBS/0.01 % Triton X-100. An equal number of cells (~106) were sorted for all samples. Events were triggered
on forward scatter and GFP+ events were sorted using the gating strategy described in Additional file 1: Figure S1. Data were acquired and analysed using Summit soft-ware (Beckman Coulter).
Estimation of Hox protein expression level
Protein expression level was estimated for Ubx-GFP by FACS using AcGFP Flow Cytometer Calibration Beads (Clontech 632594). The excitation/emission spectra and brightness for AcGFP and the eGFP used in the Hox-GFP constructs are almost identical. Cells were transfected, induced and fixed as for ChIP-Seq then analysed by FACS using the same gating strategy as the ChIP-Seq samples. This was used to derive the percentiles of the fluorescence intensity profile corresponding to the sorted cells. Cells from the same transfected and induced culture were also analysed unfixed allowing comparison to the calibration beads. The bead intensities were used to generate a cali-bration curve of number of GFP molecules (Molecular Equivalent of Soluble Fluorophore; MESF) versus fluo-rescence intensity, from which the number of GFP mol-ecules per cell was estimated for the sorted GFP+ cells at the appropriate percentiles (subtracting the number of molecules estimated for the GFP− background).
ChIP on sorted cells
Sorted cells were pelleted in a swing-out rotor at 4000g
for 15 min at 4 °C, transferred to a microfuge tube, pel-leted again and re-suspended in 100 µl Lysis Buffer (50 mM Tris.HCl (pH 8), 10 mM EDTA.Na2, 1 % SDS)
containing protease inhibitors (Sigma-Aldrich P8340) and sonicated for 9 cycles at high setting using a Diagen-ode Bioruptor (1 cycle is 30 s ON and 30 s OFF). For
chromatin preclearing and the ChIP reaction, Protein A-Sepharose beads (adjusted to a 50 % (v/v) concentra-tion in 20 % ethanol, Sigma-Aldrich P9424) were treated as follows: washed in 1 ml Buffer A (10 mM Tris.HCl (pH 7.5), 1 mM EDTA.Na2, 140 mM NaCl, 1 % Triton X-100,
0.1 % SDS, 0.1 % Na-deoxycholate), preblocked for 2 h while mixing in 0.75 mg ml−1 BSA in 1 ml Buffer A, spun
down and re-suspended in Buffer A to give a final bead concentration of 50 % (for preclearing) or 12.5 % (for the ChIP reaction). Chromatin was precleared by adding 25 µl of 50 % preblocked beads to each 100 µl chromatin sample and incubating for 15 min at 4 °C in an Eppen-dorf Thermomixer at 1400 rpm. The beads were then pel-leted and 100 µl of the precleared chromatin supernatant transferred to a fresh microfuge tube. An equal volume of the chromatin supernatant (~1 µl) was retained from each of the Hox samples and combined to represent the input, which was purified alongside the ChIP samples. To each 100 µl precleared chromatin sample, 200 µl RIPA buffer (16.7 mM Tris.HCl (pH 8), 1.2 mM EDTA. Na2, 167 mM NaCl, 1.1 % Triton X-100, 0.01 % SDS)
containing protease inhibitors was added, the result-ing solution mixed thoroughly, and 1 µl of 0.1 mg ml−1
affinity-purified rabbit anti-GFP antibody [45] added. Samples were incubated overnight while mixing at 4 °C. The ChIP reaction was performed by adding 100 µl of 12.5 % preblocked beads to each 300 µl chromatin sample and incubating for 40 min at 4 °C in an Eppendorf Ther-momixer at 1400 rpm (30 s ON and 3 s OFF). The beads were pelleted, rinsed in 1 ml Buffer A, then sequentially washed in 1 ml of each of the following wash buffers for 5 min at 4 °C while mixing: once in Buffer B (20 mM Tris. HCl (pH 8), 2 mM EDTA.Na2, 150 mM NaCl, 1 % Triton
X-100, 0.1 % SDS), four times in Buffer C (20 mM Tris.
HCl (pH 8), 2 mM EDTA.Na2, 500 mM NaCl, 1 %
Tri-ton X-100, 0.1 % SDS), once in Buffer D (10 mM Tris.HCl (pH 8), 1 mM EDTA.Na2, 250 mM LiCl, 1 % NP40, 1 %
Na-deoxycholate), and twice in Buffer E (10 mM Tris. HCl (pH 8), 1 mM EDTA.Na2). The beads were then
re-suspended in 150 µl Elution Buffer (50 mM NaHCO3, 1 %
SDS), vortexed for 15 min at room temperature and pel-leted. A volume of 145 µl of the supernatant containing the eluted chromatin was collected in a fresh microfuge tube then another 150 µl Elution Buffer was added to the beads and the process repeated. The combined volume of supernatant collected was made up to a total volume of 300 µl with Elution Buffer. To the input chromatin, Elution Buffer was added to make up a total volume of 300 µl. RNase A (1 µl for the ChIP samples, 2 µl for the input sample) and 24.3 µl of 4 M NaCl were added to each sample. Samples were incubated at 67 °C for 3 h, Proteinase K (20 mg ml−1, 2 µl for the ChIP samples,
incubated for another 2 h at 67 °C. The volume of each sample was made up to 500 µl by adding 50 mM Tris.HCl (pH 8), 10 mM EDTA.Na2. DNA was purified by phenol–
chloroform extraction and ethanol precipitation using linear acrylamide as carrier and re-suspended in 10 mM Tris.HCl pH 8.5 (10 µl for the ChIP samples, 30 µl for the input sample).
Sequencing of ChIP DNA
Samples were processed and sequenced by Source Bio-Science. The Illumina TruSeq ChIP Sample Preparation Kit was used to generate indexed paired-end sequenc-ing libraries in accordance with the manufacturer’s guide (Rev. A, August 2012) except that no size selection was performed. For the ChIP samples, the entire 10 µl vol-ume of ChIP DNA was used for library preparation and 17 cycles of amplification were performed. For the input sample, 5-10 ng of input DNA was used for library preparation and 12 cycles of amplification were per-formed. Samples were either sequenced on the Illumina MiSeq (Experiment 1; Ubx, Abd-A, Abd-B and input) or HiSeq 2000 (Experiment 2; Ubx, mutant Ubx and Ubx + Hth) platforms to generate 36 bp or 100 bp reads, respectively.
ChIP‑Seq data processing
We performed two biological replicates for each sample, except in the case of Ubx where we performed two repli-cates for Experiment 1 and one replicate for Experiment 2. For all samples, Experiment 1 input chromatin was used as the reference control to assay ChIP enrichment. All analyses are based on the Drosophila melanogaster
genome BDGP release 5. Sequencing reads in the raw fastq files were mapped using Bowtie1 [46] using default paired-end settings, a maximum insert size of 1000 bp for valid paired-end alignments (-X 1000) and reporting only uniquely mapped reads (-m 1). Reads in the output SAM files were processed using Samtools [47] to gen-erate BAM files. Reads from the individual sample rep-licates were then combined, and filtered using Bedtools [48] to remove the over-represented reads found at the exons of Ubx, Abd-A, Abd-B and Hth; artefacts of the expression vectors used in the transfections. MACS2 [49] was used for peak calling using default settings, the input sample specified as the control file (-c), the -f parameter set to process paired-end BAM files (-f BAMPE), a band width of 200 bp (--bw) and a q-value of 1e−2 or 1e−10 (-q). Binding profiles were generated as fragment pileup tracks in bedGraph format with pileup signal normalized per million reads (-B -SPMR). Only peaks in euchroma-tin (chr2L, chr2R, chr3L, chr3R, chr4, chrX and chrM) were used for downstream analyses. The Kc DNase1
reads [24] were mapped using default single-end set-tings and MACS2 peak calling performed using default settings without a control file (-f BAM --bw 200 -q 1e−2 -B --SPMR). Binding and chromatin accessibility profiles were visually examined using the Integrated Genome Browser (http://bioviz.org/igb/index.html).
Overlap and differential peak analysis
Overlap peak analysis was performed using Bedtools [48] intersect; common peaks were defined as having a minimum of 5 % reciprocal overlap (-f 0.05 -r -u) and specific non-overlapping peaks were reported using the -v option (-f 0.05 -r -v). Overlap analysis was used to gen-erate the common and specific peak sets used in Fig. 5c (for Ubx + Hth), Fig. 6a–c, f, g, and Fig. 7a–d. Overlap analysis was also used in Fig. 6e–g to determine, per given peak set, the percentage of total peak length over-lapping each of the five chromatin colour states described by Filion et al. [25]; unknowns (shown in white) represent peaks that map to regions in the genome non-annotated with a chromatin state colour. Differential peak analysis was performed using the bdgdiff module in MACS2 [49] to generate the following peak sets: the differential Hox versus DNase1 peak sets in Fig. 4a–c, the common and differential Ubx + Hth versus Ubx peak sets in Fig. 4d, and the differential Ubx + Hth versus Ubx peak set in Fig. 5b (for Ubx + Hth).
Motif analysis
HOMER [50] and MEME-ChIP [51] were used to per-form motif discovery on the cofactor-dependent Ubx peak sequences (Additional file 1: Figure S3). The PWMEnrich R package [52] was used for Hox and cofac-tor PWM enrichment analysis; motif enrichment scores [log10(1/p-value)] were grouped according to
transcrip-tion factor and plotted as one dimensional dot plots together with median using R. The Biostrings R pack-age [53] was used to count the number of occurrences of selected k-mers derived from the SELEX-Seq study [9] in the sequences underlying given peak sets; the fre-quency per kb of each k-mer was counted and reported as log2(frequency in peak sequences/background
fre-quency) using 2 kb sequences upstream of TSSs from
DNA shape analysis
Minor groove widths were predicted using the DNA-shape online tool [55] using 2 kb sequences centred on the peak summits. For each base position, the aver-age width was calculated, then the resulting profile was smoothed using a 100 bp sliding window and a step of 10 bp using the ‘rollapply’ function from the zoo R package.
GC composition analysis
Average GC content was calculated using a Perl script from the Berkeley Drosophila Transcription Network Project (base_composition_across_peaks.pl written by Stewart MacArthur) using 2 kb sequences centred on the peak summits, a window size of 100 bp and a step of 10 bp.
Immunolabelling
Cells transfected with the pMT-Hth2AGFPUbx bicis-tronic expression vector were induced for 4 h as described above, and fixed using 4 % formaldehyde (Sigma-Aldrich F8775) in PBS for 10 min at 23 °C in an Eppendorf Thermomixer at 700 rpm. Transfected (GFP+) and non-transfected (GFP−) cells were sorted as described above. Sorted cells were seeded onto 1 × 0.8 cm coverslips in the wells of a 12-well plate each containing 1 ml PBS. Cells were allowed to adhere for 30 min. The PBS was then replaced by 1 ml PTX (PBS/0.5 % Triton X-100) and cells were incubated at room temperature for 30 min. Coverslips were then transferred to microfuge tubes containing mouse anti-Exd B11M monoclonal antibody (1 ml, 1:5 in PTX; [56]) and incubated at 4 °C overnight. Coverslips were then washed three times in PTX then incubated with goat anti-mouse Alexa 568 secondary antibody (1 ml, 1:500, Invitrogen) and 1 µg ml−1 DAPI in PTX at room
temper-ature for 2 h. Coverslips were then washed three times in PTX and mounted in Citifluor AF1 Glycerol/PBS solu-tion (Agar Scientific) for immunofluorescence micros-copy (Nikon Eclipse TE2000-E confocal).
Data availability
The ChIP-Seq data are available from GEO under acces-sion number GSE69796. Table S1 in Additional file 1
provides summary statistics of read mapping and data processing.
Additional files
Additional file 1. FACS gating strategy and additional figures Additional file 2. Details of the Hox‑GFP constructs
Abbreviations
TALE: three amino acid loop extension; GFP: green fluorescent protein; ChIP‑ Seq: chromatin immunoprecipitation with massively parallel sequencing; FACS: fluorescence‑activated cell sorter; SELEX‑Seq: systematic evolution of ligands by exponential enrichment with massively parallel sequencing; PWM: position weight matrix; bp: base pair; kb: kilobase; MCS: multiple cloning site; SDS: sodium dodecyl sulphate; BSA: bovine serum albumin; rpm: revolutions per minute.
Authors’ contributions
SE, SR, SWC and RW conceived and supervised experiments. CYB, SE and AC performed the experiments. CYB, SWC and RW analysed data. CYB, SE, AC, SR, SWC and RW wrote the paper. All authors read and approved the final manuscript.
Author details
1 Department of Oral Biology and Biomedical Sciences, Faculty of Dentistry,
University of Malaya, 50603 Kuala Lumpur, Malaysia. 2 Department of Physi‑
ology, Development and Neuroscience, University of Cambridge, Down‑ ing Street, Cambridge CB2 3DY, UK. 3 Department of Genetics, University
of Cambridge, Downing Street, Cambridge CB2 3EH, UK. 4 Cambridge Systems
Biology Centre, University of Cambridge, Tennis Court Road, Cambridge CB2 1QR, UK.
Acknowledgements
We are grateful to Rosa Barrio Olano and James Sutherland for plasmids and Richard Mann for the Hth cDNA. This work was supported by University of Malaya High Impact Research Grant UM‑HIR UM.C/625/HIR/MOHE/CHAN‑08 from the Ministry of Higher Education Malaysia. We thank members of the Genome Informatics Research Group in the University of Malaya for their bioinformatics support throughout this study.
Competing interests
The authors declare that they have no competing interests.
Received: 11 August 2015 Accepted: 8 December 2015
References
1. Mann RS, Lelli KM, Joshi R. Hox specificity: unique roles for cofactors and collaborators. Curr Top Dev Biol. 2009;88:63–101.
2. Rezsohazy R, Saurin AJ, Maurel‑Zaffran C, Graba Y. Cellular and molecular insights into Hox protein action. Development. 2015;142(7):1212–27.
3. Chan S‑K, Jaffe L, Capovilla M, Botas J, Mann RS. The DNA binding specificity of Ultrabithorax is modulated by cooperative interactions with extradenticle, another homeoprotein. Cell. 1994;78(4):603–15.
4. Chang CP, Shen WF, Rozenfeld S, Lawrence HJ, Largman C, Cleary ML. Pbx proteins display hexapeptide‑dependent cooperative DNA binding with a subset of Hox proteins. Genes Dev. 1995;9(6):663–74.
5. van Dijk MA, Murre C. Extradenticle raises the DNA binding specificity of homeotic selector gene products. Cell. 1994;78(4):617–24.
6. Jacobs Y, Schnabel CA, Cleary ML. Trimeric association of Hox and TALE homeodomain proteins mediates Hoxb2 hindbrain enhancer activity. Mol Cell Biol. 1999;19(7):5134–42.
7. Ryoo HD, Mann RS. The control of trunk Hox specificity and activity by Extradenticle. Genes Dev. 1999;13(13):1704–16.
8. Shen WF, Rozenfeld S, Kwong A, Kom ves LG, Lawrence HJ, Largman C. HOXA9 forms triple complexes with PBX2 and MEIS1 in myeloid cells. Mol Cell Biol. 1999;19(4):3051–61.
9. Slattery M, Riley T, Liu P, Abe N, Gomez‑Alcala P, Dror I, et al. Cofactor bind‑ ing evokes latent differences in DNA binding specificity between Hox proteins. Cell. 2011;147(6):1270–82.
11. Pinsonneault J, Florence B, Vaessin H, McGinnis W. A model for extraden‑ ticle function as a switch that changes HOX proteins from repressors to activators. EMBO J. 1997;16(8):2032–42.
12. Berger MF, Badis G, Gehrke AR, Talukder S, Philippakis AA, Peña‑Castillo L, et al. Variation in homeodomain DNA binding revealed by high‑resolu‑ tion analysis of sequence preferences. Cell. 2008;133(7):1266–76. 13. Noyes MB, Christensen RG, Wakabayashi A, Stormo GD, Brodsky MH,
Wolfe SA. Analysis of homeodomain specificities allows the family‑wide prediction of preferred recognition sites. Cell. 2008;133(7):1277–89. 14. Choo SW, White R, Russell S. Genome‑wide analysis of the binding of
the Hox protein Ultrabithorax and the Hox cofactor Homothorax in Drosophila. PLoS One. 2011;6(4):e14778.
15. Slattery M, Ma L, Négre N, White KP, Mann RS. Genome‑wide tissue‑ specific occupancy of the Hox protein Ultrabithorax and Hox cofactor Homothorax in Drosophila. PLoS One. 2011;6(4):e14686.
16. Sorge S, Ha N, Polychronidou M, Friedrich J, Bezdan D, Kaspar P, et al. The cis‑regulatory code of Hox function in Drosophila. EMBO J. 2012;31(15):3323–33.
17. Li X‑Y, Thomas S, Sabo P, Eisen M, Stamatoyannopoulos J, Biggin M. The role of chromatin accessibility in directing the widespread, overlap‑ ping patterns of Drosophila transcription factor binding. Genome Biol. 2011;12(4):R34.
18. Biggin Mark D: Animal transcription networks as highly connected, quan‑ titative continua. Dev Cell 2011; 21:611–626.
19. Krause HM, Klemenz R, Gehring WJ. Expression, modification, and localization of the fushi tarazu protein in Drosophila embryos. Genes Dev. 1988;2:1021–36.
20. Little SC, Tkačik G, Kneeland TB, Wieschaus EF, Gregor T. The formation of the Bicoid morphogen gradient requires protein movement from anteriorly localized mRNA. PLoS Biol. 2011;9:e1000596.
21. Walter J, Dever CA, Biggin MD. Two homeo domain proteins bind with similar specificity to a wide range of DNA sites in Drosophila embryos. Genes Dev. 1994;8:1678–92.
22. Ades SE, Sauer RT. Specificity of minor‑groove and major‑groove interactions in a homeodomain‑DNA complex. Biochemistry. 1995;34(44):14601–8. doi:10.1021/bi00044a040.
23. Gehring WJ, Qian YQ, Billeter M, Furukubo‑Tokunaga K, Schier AF, Resendez‑Perez D, et al. Homeodomain‑DNA recognition. Cell. 1994;78(2):211–23.
24. Thomas S, Li X‑Y, Sabo P, Sandstrom R, Thurman R, Canfield T, et al. Dynamic reprogramming of chromatin accessibility during Drosophila embryo development. Genome Biol. 2011;12(5):R43.
25. Filion Guillaume J, van Bemmel Joke G, Braunschweig U, Talhout W, Kind J, Ward Lucas D, et al. Systematic protein location mapping reveals five principal chromatin types in Drosophila cells. Cell. 2010;145(1):160. 26. Abe N, Dror I, Yang L, Slattery M, Zhou T, Bussemaker Harmen J, et al.
Deconvolving the recognition of DNA shape from sequence. Cell. 2015;161(2):307–18.
27. Rohs R, West SM, Sosinsky A, Liu P, Mann RS, Honig B. The role of DNA shape in protein‑DNA recognition. Nature. 2009;461(7268):1248–53. 28. Workman JL, Kingston RE. Alteration of nucleosome structure as a mech‑
anism of transcriptional regulation. Annu Rev Biochem. 1998;67:545–79. 29. Guertin MJ, Lis JT. Chromatin landscape dictates HSF binding to target
DNA elements. PLoS Genetics. 2010;6(9).
30. John S, Sabo PJ, Thurman RE, Sung M‑H, Biddie SC, Johnson TA, et al. Chromatin accessibility pre‑determines glucocorticoid receptor binding patterns. Nat Genet. 2011;43(3):264–8.
31. Soufi A, Donahue G, Zaret KS. Facilitators and impediments of the pluri‑ potency reprogramming factors’ initial engagement with the genome. Cell. 2012;151(5):994–1004.
32. Carr A, Biggin MD. A comparison of in vivo and in vitro DNA‑binding specificities suggests a new model for homeoprotein DNA binding in Drosophila embryos. EMBO J. 1999;18(6):1598–608.
33. Rohs R, Jin X, West SM, Joshi R, Honig B, Mann RS. Origins of specificity in protein‑DNA recognition. Annu Rev Biochem. 2010;79(1):233–69.
34. Joshi R, Passner JM, Rohs R, Jain R, Sosinsky A, Crickmore MA, et al. Func‑ tional specificity of a Hox protein mediated by the recognition of minor groove structure. Cell. 2007;131(3):530–43.
35. Miller JA, Widom J. Collaborative competition mechanism for gene activation in vivo. Mol Cell Biol. 2003;23(5):1623–32.
36. Kuziora MA. Abdominal‑B protein isoforms exhibit distinct cuticular transformations and regulatory activities when ectopically expressed in Drosophila embryos. Mech Dev. 1993;42(3):125–37.
37. Lamka ML, Boulet AM, Sakonju S. Ectopic expression of UBX and ABD‑B proteins during Drosophila embryogenesis: competition, not a functional hierarchy, explains phenotypic suppression. Development. 1992;116(4):841–54.
38. Mann RS, Hogness DS. Functional dissection of Ultrabithorax proteins in Drosophila melanogaster. Cell. 1990;60:597–610.
39. Sanchez‑Herrero E, Guerrero I, Sampedro J, Gonzalez‑Reyes A. Develop‑ mental consequences of unrestricted expression of the abd‑A gene of Drosophila. Mech Dev. 1994;46(3):153–67.
40. Casares F, Calleja M, Sanchez‑Herrero E. Functional similarity in append‑ age specification by the Ultrabithorax and abdominal‑A Drosophila HOX genes. EMBO J. 1996;15(15):3934–42.
41. Gonzalez‑Reyes A, Morata G. The developmental effect of overexpressing a Ubx product in Drosophila embryos is dependent on its interactions with other homeotic products. Cell. 1990;61(3):515–22.
42. Struhl G, White RA. Regulation of the Ultrabithorax gene of Drosophila by other Bithorax complex genes. Cell. 1985;43:507–19.
43. McKay Daniel J, Lieb Jason D. A common set of DNA regulatory elements shapes Drosophila appendages. Dev Cell. 2013;27:306–18.
44. Gonzalez M, Martin‑Ruiz I, Jimenez S, Pirone L, Barrio R, Sutherland JD. Generation of stable Drosophila cell lines using multicistronic vectors. Sci Rep. 2011;1.
45. Benton R, Palacios IM, Johnston DS. Drosophila 14‑3‑3/PAR‑5 is an essential mediator of PAR‑1 function in axis formation. Dev Cell. 2002;3(5):659–71.
46. Langmead B, Trapnell C, Pop M, Salzberg S. Ultrafast and memory‑ efficient alignment of short DNA sequences to the human genome. Genome Biol. 2009;10(3):R25.
47. Li H, Handsaker B, Wysoker A, Fennell T, Ruan J, Homer N, et al. The Sequence Alignment/Map format and SAMtools. Bioinformatics. 2009;25(16):2078–9.
48. Quinlan AR, Hall IM. BEDTools: a flexible suite of utilities for comparing genomic features. Bioinformatics. 2010;26(6):841–2.
49. Zhang Y, Liu T, Meyer CA, Eeckhoute J, Johnson DS, Bernstein BE, et al. Model‑based analysis of ChIP‑Seq (MACS). Genome Biol. 2008;9(9):R137. 50. Heinz S, Benner C, Spann N, Bertolino E, Lin YC, Laslo P, et al. Simple
combinations of lineage‑determining transcription factors prime cis‑ regulatory elements required for macrophage and B cell identities. Mol Cell. 2010;38(4):576–89.
51. Machanick P, Bailey TL. MEME‑ChIP: motif analysis of large DNA datasets. Bioinformatics. 2011;27(12):1696–7.
52. Stojnic R, Diez D. PWMEnrich: PWM enrichment analysis. 4.2.0 ed2014. 53. Pages H, Aboyoun P, Gentleman R, DebRoy S. Biostrings: String objects
representing biological sequences, and matching algorithms. 2.34.1 ed 2014.
54. Grant CE, Bailey TL, Noble WS. FIMO: scanning for occurrences of a given motif. Bioinformatics. 2011;27(7):1017–8.
55. Zhou T, Yang L, Lu Y, Dror I, Dantas Machado AC, Ghane T, et al. DNA‑ shape: a method for the high‑throughput prediction of DNA structural features on a genomic scale. Nucleic Acids Res. 2013;41:W56–62. 56. Aspland SE, White RA. Nucleocytoplasmic localisation of extradenticle
protein is spatially regulated throughout development in Drosophila. Development. 1997;124(3):741–7.