RESEARCH ARTICLE
Refinement of Strut-and-Tie Model for
Reinforced Concrete Deep Beams
Mohammad Panjehpour1*, Hwa Kian Chai2*, Yen Lei Voo3
1Department of Civil Engineering, Faculty of Science, Engineering, Technology and Mathematics (FOSTEM), INTI International University, 71800, Nilai, Malaysia,2Department of Civil Engineering, Faculty of Engineering, University of Malaya, 50603, Kuala Lumpur, Malaysia,3DURA Technology Sdn Bhd, Ipoh, Malaysia
*mohammad.panjehpour@newinti.edu.my(MP);hkchai@um.edu.my(HKC)
Abstract
Deep beams are commonly used in tall buildings, offshore structures, and foundations. According to many codes and standards, strut-and-tie model (STM) is recommended as a rational approach for deep beam analyses. This research focuses on the STM recom-mended by ACI 318-11 and AASHTO LRFD and uses experimental results to modify the strut effectiveness factor in STM for reinforced concrete (RC) deep beams. This study aims to refine STM through the strut effectiveness factor and increase result accuracy. Six RC deep beams with different shear span to effective-depth ratios (a/d) of 0.75, 1.00, 1.25, 1.50, 1.75, and 2.00 were experimentally tested under a four-point bending set-up. The ulti-mate shear strength of deep beams obtained from non-linear finite element modeling and STM recommended by ACI 318-11 as well as AASHTO LRFD (2012) were compared with the experimental results. An empirical equation was proposed to modify the principal tensile strain value in the bottle-shaped strut of deep beams. The equation of the strut effectiveness factor from AASHTTO LRFD was then modified through the aforementioned empirical equation. An investigation on the failure mode and crack propagation in RC deep beams subjected to load was also conducted.
Introduction
Deep beams are mainly used in tall buildings, offshore structures, and foundations [1]. Accord-ing to ACI 318–11, a deep beam has a clear span equal to or less than four times the overall depth. Regions with concentrated loads within twice the member depth from the face of sup-port are also considered deep beams [2].
Based on many codes and standards, the strut-and-tie model (STM) is recommended as a rational approach for analyzing and designing reinforced concrete deep beams [2–8]. The con-cepts of the STM are originally referred to truss analogy proposed by Ritter [9] and Mörsch [10] as well as compression field theory proposed by Michael P.Collins [11] for the design of shear structural elements. The truss model was then brushed up by Schlaich et al and proposed for consistent design of reinforced concrete structures [12]. Since 2002, ACI building code has OPEN ACCESS
Citation:Panjehpour M, Chai HK, Voo YL (2015) Refinement of Strut-and-Tie Model for Reinforced Concrete Deep Beams. PLoS ONE 10(6): e0130734. doi:10.1371/journal.pone.0130734
Academic Editor:Jose Manuel Garcia Aznar, University of Zaragoza, SPAIN
Received:August 11, 2014
Accepted:May 24, 2015
Published:June 25, 2015
Copyright:© 2015 Panjehpour et al. This is an open access article distributed under the terms of the Creative Commons Attribution License, which permits unrestricted use, distribution, and reproduction in any medium, provided the original author and source are credited.
Data Availability Statement:The data are all contained within the paper.
Funding:This study was supported by High Impact Research Grant UM.C/625/1/HIR/MOHE/ENG/54. DURA Technology Sdn Bhd provided experimental facilities and material. Dura Technology will not have any right regarding the findings of this research for issues of patent, copyright and etc.
been adopted the STM and replaced it with previously rather simple equation for design and analysis of deep beams [2]. STM is based on the lower-bound theorem which states that distri-bution of stresses used to resist an applied load is safe, as long as equilibrium is satisfied through structural elements and all parts of structure have stress less than yield [13]. Prior research have been attempted to evaluate the plastic behaviors of compressive strut in STM in cracked concrete fields [14].
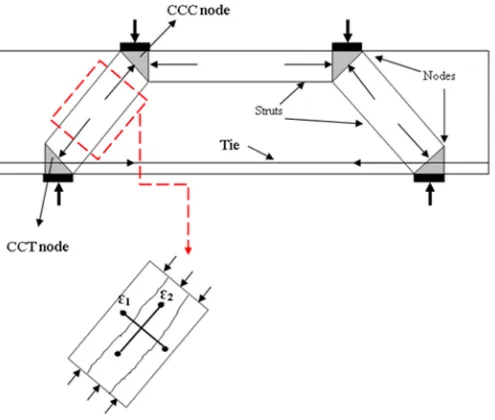
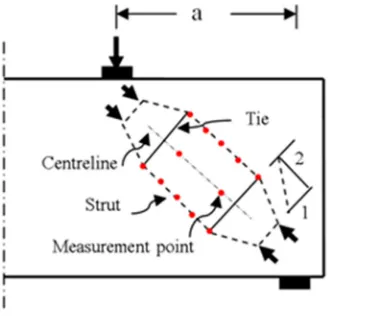
Numerous codes and standards have proposed equations to predict concrete strut effective-ness factor by considering various variables that affect discontinuity region (D-region) behav-iour. In the present study, these codes and standards are classified into two groups regarding the proposed STM method [15,16]. The first group comprises AASHTO LRFD, CSA-S6-06, and AS3600, which define the strut effectiveness factor as a function of the tensile strain of tie and angle between strut and tie [3,4,17]. The foregoing effectiveness factor is originally derived from research on modified compression-field (MCF) theory, which proposed the stress-strain relationship for cracked concrete in compression [11].Fig 1illustrates the STM for deep beams, which elaborates the principal strains in strut.
The second group comprises ACI 318–11, DIN 1045–1, and NZS 3101, which recommend a constant value for the strut effectiveness factor depending on the grad of concrete and the sat-isfaction of the required reinforcements [2,6,8].
AASHTO LRFD recommends Eqs (1) and (2) to determine the strut effectiveness factor.
ε1 ¼εsþ ðεsþ0:002Þcot2ðaÞ ðAASHTO LRFD eq:5:6:3:3:32Þ ð1Þ
fce¼ f0c
0:8þ170ε1<0:85
f0c ðAASHTO LRFD eq:5:6:3:3:31Þ ð2Þ
Where,
ε1: principal tensile strain of strut,εs: tensile strain in an adjoining tie,α:angle between
adjoining tie and strut in strut-and-tie model (rad), fce: effective compressive strength of strut
in STM along the strut centreline (MPa), f’c: specified concrete compressive strength (MPa),
The effectiveness factor equation derived from Eq (2) is shown below.
l¼0:8þ1170ε
1<0:85 ð
3Þ
Where,
λ: strut effectiveness factor
Numerous studies have been conducted on the behavior of reinforced concrete (RC) deep beams with openings [18], RC deep beams subjected to combined bending and axial forces [19], and RC deep beams using different grade of concrete [19–22]. Other researchers have also explored the effects of support settlement on deep beam and STM behavior [23]. The latest research conducted on RC deep beam has investigated and compared the cracking moment and rupture modulus in deep beams [24]. The effect of carbon fiber-reinforced polymer (CFRP) strengthening on energy absorption of deep beam has been currently investigated [25]. Application of STM for CFRP strengthened deep beams has been also researched [26,27].
The present study examines the STM that ACI 318–11 and AASHTO LRFD recommended and uses experimental results to modify the strut effectiveness factor for RC deep beams. Non-linear finite element modelling (FEM) is applied in the present study because codes and stan-dards [2,3] recommend both STM and non-linear FEM for deep beams analysis. Unlike other studies conducted on STM [28–34], the present research proposes the strut effectiveness factor using the experimental values of the principal tensile strain in RC strut. Thus, the present study
Strut-and-Tie Model for Reinforced Concrete Deep Beams
aims to establish an empirical relationship between the values of principal tensile strain per-pendicular to the strut centerline from the experiment and those proposed by AASHTO LRFD Equations. The experimental program also investigates the width and propagation of cracks in RC deep beams as well as the corresponding failure mode.
Methodology
[image:3.612.43.538.75.495.2]This study was supported by High Impact Research Grant UM.C/625/1/HIR/MOHE/ENG/54. Six RC deep beams with shear span to the effective-depth (a/d) ratios of 0.75, 1.00, 1.25, 1.50, 1.75, and 2.00 were constructed in this experiment. The strain in mid-length of the inclined strut perpendicular to the strut centerline was measured during the test. According to the prior research, addition of transverse reinforcement beyond the required amount of reinforcement does not increase the ultimate shear strength of deep beams. Using extra transverse reinforce-ment only provides a marginal strength for deep beams [1,35]. In this research, the required
Fig 1. STM for deep beam with principal strains in inclined concrete strut.
doi:10.1371/journal.pone.0130734.g001
amount of transverse reinforcement was provided based on ACI 318–11 and AASHTO LRFD (2012).
2.1 Details of deep beams
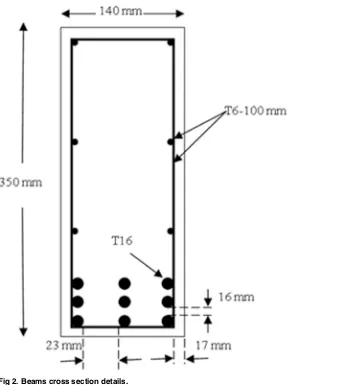
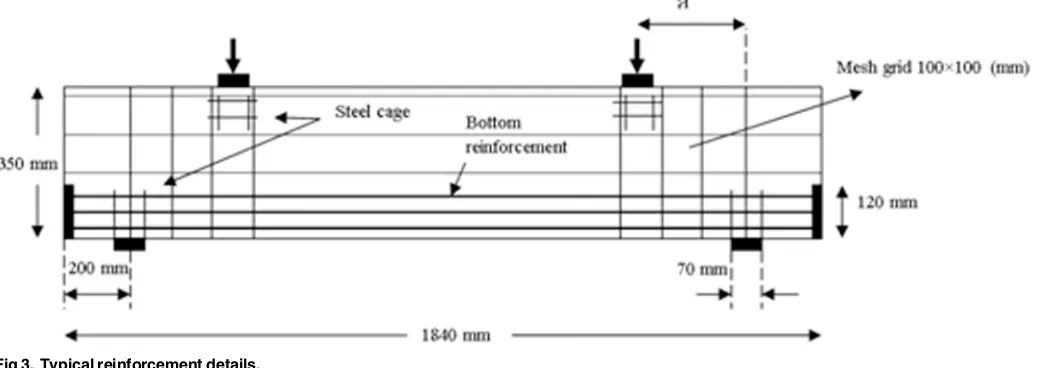
[image:4.612.202.565.73.458.2]The deep beams were identical in every aspect except for the position of the steel cages. Each beam had a length of 1840 mm with a rectangular cross-section as indicated inFig 2. The flex-ural reinforcement consisted of 9T16 deformed steel bars, which were placed in three layers at the bottom of the beam cross-section. These steel bars were welded into 10 mm thick steel plates at both beam ends to provide adequate anchorage capacity. The anchorage steel plates that had a height of 120 mm fully covered the beam widths. An orthogonal steel mesh forcement with diameter of 6 mm and spacing of 100 mm was provided as the transverse rein-forcement. This reinforcement provided the required minimum amount of web reinforcement that ACI 318–11 and AASHTO LRFD recommend [2,3]. The additional reinforcements (steel cages) were provided under the load plates and on top of the support plates to prevent prema-ture local bearing stress, as illustrated inFig 3. The presence of steel cages and anchorage plates may change the formation of compression-compression-tension (CCT) node on top of the support plates. However, the formation of CCT node is not the concern of this research and
Fig 2. Beams cross section details.
doi:10.1371/journal.pone.0130734.g002
does not affect strut performance. The beams were cast using a single supply of ready-mixed concrete. The maximum aggregate size in concrete was 10 mm. Two types of coarse
(uncrushed granite) and fine (uncrushed sand) aggregates were used in the mix design. The water-to-cement ratio was 0.47. The concrete slump was 60 mm. The mix design for one cubic meter of concrete is shown inTable 1.
The support and load plates fully covered the area beneath and on top of the beam with 70 mm width and 10 mm thickness. The deep beams were tested 28 days after casting. The cylin-der compressive strength and cylincylin-der splitting tensile strength of concrete were 37.02 MPa and 3.31 MPa from the test, respectively. The yield strength of reinforced steel bar was 440 MPa from the test according to ASTM-E8.
2.2 Test procedure and instrument
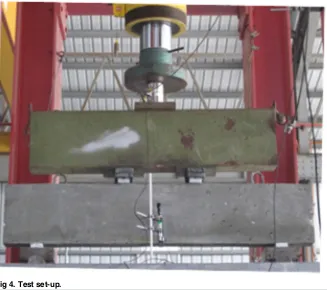
The beams were tested until they failed under a four-point load set-up, as shown inFig 4. The load was uniformly applied with a controlled loading rate until failure using a hydraulic actua-tor with a maximum capacity of 5000 kN.Fig 5illustrates the position of strain measurement points on the strut with a 200-mm distance equal to the demountable mechanical strain gauge (DEMEC) bar. The DEMEC discs were installed on the strain measurement points along and perpendicular to the strut centerline. The resolution of DEMEC gauge was 0.001 mm. DEMEC measured the strain along and perpendicular to the strut centerline to perceive the bottle-shaped strut deformation. However, the strain value perpendicular to the strut centerline at mid-height of the beam cross-section was the main concern of this research. A portable micro-scope with resolution of 0.02 mm was utilized to measure the cracks width in the D-region of deep beams surfaces.
Fig 3. Typical reinforcement details.
[image:5.612.39.570.81.265.2]doi:10.1371/journal.pone.0130734.g003
Table 1. Concrete mix design.
Cement Water Fine agg. Coarse agg. Super plasticizer (1/m3)
Quantities(kg) 340 160 855 1045 20
doi:10.1371/journal.pone.0130734.t001
Experimental Results and Discussion
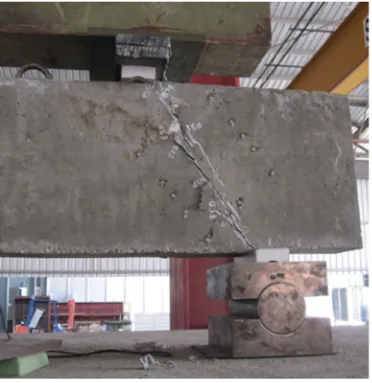
The strut represents concrete compressive stress fields with the compression stresses acting parallel to the strut centreline. Thus, the cracks formation parallel to the strut centerline, as indicated inFig 6, implies the strut formation while loading. The diagonal crack that propa-gated between the load and support plates, as shown inFig 6, is due to the principal tensile stress perpendicular to the strut centerline.
3.1 The failure modes observed for deep beam
Few concepts are considered as the basis of RC deep beam shear failure mode. According to these concepts, once inclined cracking starts to propagate, the RC deep beam with shear rein-forcement behaves as a truss with concrete between two alternative inclined cracks and the shear reinforcement acting as strut and tie, respectively [1]. The concrete crushing mode in the compressive zone was not observed in this experiment because the compressive zones under the loading plates and on top of the support plates were reinforced using steel cages. In accor-dance with the beam design, the adequate longitudinal steel bars were assembled to prevent steel bars from yielding. During loading, diagonal cracks were observed to be propagating towards the loading and support plates. Shear failure mode was dominant for all the tested deep beams. This result was expected based on the prior research [1].Fig 6illustrates the typi-cal shear failure mode and crack pattern observed in RC deep beams in the experiment.
3.2 Crack width of RC deep beams
[image:6.612.205.532.78.368.2]According to the experimental observations, the elastic behavior dominated in the RC deep beams by approximately 30% of the ultimate load. Then the diagonal cracks firstly appeared in
Fig 4. Test set-up.
doi:10.1371/journal.pone.0130734.g004
the mid-depth of the beams and subsequently extended towards the load and support plates. A further load increase widened and extended the existing diagonal cracks, whereas new diagonal cracks appeared. The flexural cracks appeared at the imposed load, which was greater than approximately 50% of the ultimate load. The flexural cracks hardly reached mid-depth of the beams sections. Finally, one of the diagonal cracks perceptibly extended and widened at approximately 90% of the ultimate load. Consequently, final failure of the beams occurred.
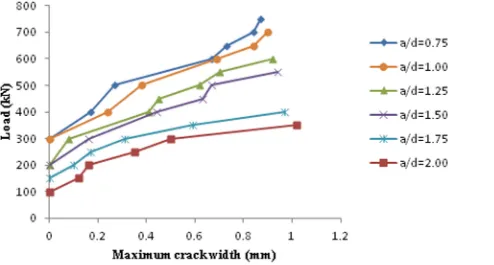
The maximum diagonal crack width for RC deep beams and the corresponding loads were measured up to approximately 95% of the ultimate loads, as illustrated inFig 7. In addition, as the a/d ratio increased the maximum width of diagonal crack, which was measured in each step of the load increment, increased. For an equivalent imposed load, the maximum width of the diagonal crack increased with the increase of the a/d ratio.
3.3 STM and non-linear FE modeling of deep beams
According to ACI 318–11 and AASHTO LRFD, both STM and non-linear finite element modeling (NLFEM) are recommended for deep beams analysis. Thus, the ultimate shear strength of deep beams obtained from NLFEM and STM recommended by ACI 318–11 as well as AASHTO LRFD (2012) are compared with experimental results in the following sections.
[image:7.612.199.568.75.391.2]3.3.1 Non-linear finite element modeling. ABAQUS software was used for non-linear FE analysis using three-dimensional (3D) modeling of the RC deep beams. The beams were mod-eled using solid geometry for concrete, sweep geometry for steel bars, and shell geometry for
Fig 5. Strain measurement points on strut.
doi:10.1371/journal.pone.0130734.g005
CFRP sheets with extrusion option. The C3D20R element with 20 nodes was used for the mesh configuration of 3D modeling. Perfect bond between concrete and steel bars was assumed in the modeling. A mesh size of 5 mm that resulted from the convergence test was used in the NLFEM for the mesh size dependency. Due to the symmetry of the geometry, loading, bound-ary conditions and material properties, a quarter of deep beams were assembled in NLFEM. The use of a quarter model significantly reduced the computational time. A static uniformly distributed load was applied on the load plates.
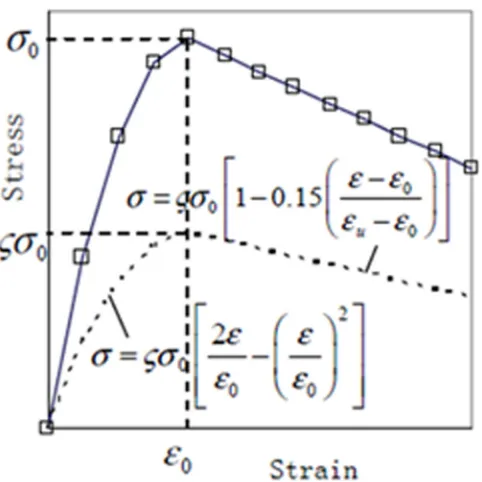
[image:8.612.202.574.77.460.2]This study adopted suitable configurations to define the non-linear behaviours of steel and concrete in NLFEM. The softening behaviour of the concrete in compression attributed to transverse cracking was an important mechanism that affected NLFEM results. Therefore, Eqs (4) and (5) were used in NLFEM for the ascending and descending branches of the modified Hagenstd’s stress-strain curve. The modified Hagenstd’s stress-strain includes
Fig 6. Typical crack pattern of RC deep beam.
doi:10.1371/journal.pone.0130734.g006
asoftening coefficientzwhich Belarbi and Hsu proposed [36,37].
s¼Bf0c
2ε ε0
ε ε0 2
" #
εε0 ð4Þ
s¼Bf0c 10:15
εε0
εuε0
2
" #
ε0 εεu ð5Þ
Where B¼ ffiffiffiffiffiffiffiffiffiffiffiffiffiffiffiffiffiffiffiffi0:9
1þ400ε1
p ð6Þ
Where,
σ: concrete compressive stress in Hognestad’s model (MPa),δ: modified coefficient, 0.92 for concrete with compressive strength greater than 35,ε: concrete compressive strain in Hognes-tad’s model,ε0:peak compressive strain of concrete,εu: ultimate compressive strain of concrete,
ε1: principal tensile strain of strut
The parameters below that resulted from the test were used for the modified Hognestad stress-strain curve of concrete as shown inFig 8.
ε0: 0.002,εu= 0.003,σ0= 37.02 (MPa),δ= 0.92
Where,σ0: peak concrete compressive stress in Hognestad’s model (MPa)
The parameters below that resulted from the test were used to define the input data of the concrete properties in the ABAQUS software.
[image:9.612.36.530.77.342.2]wc= 2420 (kg/m3), Ec=31146.53 (MPa), ft, split= 3.31 (MPa), fr= 4.21 (MPa),υc= 0.2 Fig 7. Maximum width of diagonal cracks in RC deep beams at different applied loads and a/d.
doi:10.1371/journal.pone.0130734.g007
where, wc: density of concrete (kg/m3), Ec= elastic modulus of concrete (MPa),ft,split:
con-crete tensile strength from split test (MPa), fr: concrete modulus of rupture (MPa),νc: concrete
Poisson’s ratio
The input data for steel properties that resulted from the test comprising elastic modulus, yield stress, and Poisson’s ratio are as follows.
Es = 200,000 (MPa), fy= 440 (MPa),νs= 0.3
Where, Es: elastic modulus of steel (MPa),fy:yield strength of steel,νs= steel Poisson’s ratio
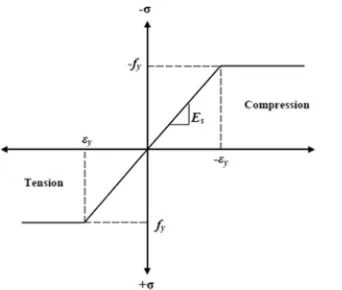
The steel for the finite element models was assumed to be an elastic-perfectly plastic mate-rial and identical in tension and compression.Fig 9shows the stress-strain relationship for steel reinforcement used in this study.
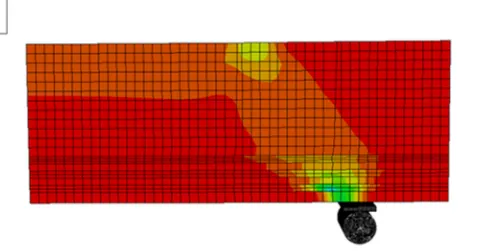
A few assumptions were made in NLFEM, as highlighted below. The Poisson’s ratio was constant throughout the loading history. The concrete behavior was linear prior to cracking and non-linear after cracking. The steel was an elastic-plastic material and identical in tension and compression. Decisions were carefully made regarding mesh layout use, representation of reinforcement details, elements type, loading method, support conditions, convergence criteria, and adoption of material behavior models to attain a convergence of results. The typical com-pressive stress-distribution that resulted from NLFEM for RC deep beams is illustrated in
Fig 10.
The mesh size in this figure was considered 20 mm to prevent disordering of figure. How-ever, the mesh size of 5 mm resulted from the convergence test was used in NFEM in this study.
3.3.2 STM method proposed by ACI 318–11 and AASHTO LRFD. The STM illustrated inFig 1was used to analyze RC deep beams. The effective strength of concrete in RC strut was calculated using Eq (7).
fce ¼0:85bsf
0
c ðACI Eq:A3Þ ð7Þ
[image:10.612.202.443.74.315.2]According to ACI 318–11, Section A.3.3, for structural elements with reinforcement
Fig 8. Plotted modified Hognestad stress-strain curve of concrete in this study.
doi:10.1371/journal.pone.0130734.g008
satisfying
bs¼0:75
Thus, the value of the strut effectiveness factor is
l¼fce=f0c¼0:850:75¼0:6375
Eq (5) was used to calculate the strut effectiveness factor for the AASHTO LRFD STM. The ultimate shear strength of deep beams that resulted from the ACI 318–11, AASHTO LRFD, NLFEM, and the experiment were compared, as shown inTable 2andFig 11(PACI: ultimate
shear strength of deep beam from STM recommended by ACI 318–11 (kN), PAASHTO: ultimate
shear strength of deep beam from STM recommended by AASHTO LRFD (kN), PFEM:
ulti-mate shear strength of deep beam from non-linearfinite element modeling (kN), Ptest: ultimate
shear strength of deep beam from the experiment (kN)).
[image:11.612.200.542.73.363.2]Based onTable 2, the results of the AASHTO LRFD STM in the range of 0.75a / d1.5 were averagely in better agreement with the experimental results than the results of ACI 318– 11. However, the results of the ACI 318–11 STM were in better agreement with the experimen-tal results than the results of AASHTO LRFD in the range 1.75a / d2. Thus, the AASHTO LRFD STM may provide more accurate results for deep beams (0.75a / d1.5) than ACI 318–11. Non-linear FEM was also used to predict the ultimate shear strength of RC deep beams. However, the results of non-linear FEM showed lower accuracy than the results obtained through the recommended STMs by ACI 318–11 and AASHTO LRFD. This condi-tion is attributed to the assumpcondi-tions made in non-linear FEM.
Fig 9. Stress-strain curve for steel reinforcement.
doi:10.1371/journal.pone.0130734.g009
The AASHTO LRFD STM was selected for modification because this STM obtained better results for very deep beams than ACI 318–11 and non-linear FEM. The principal tensile strain value of strut mainly governs the strut effectiveness factor equation of AASHTO LRFD. Accordingly, the next section aims to modify the AASHTO LRFD STM through the principal tensile strain value of strut.
3.4 Refinement of STM recommended by AASHTO LRFD (2012)
Eqs (1) and (2) were originally derived from the research conducted on modified compression-field theory [11]. The principal tensile strain of strut (ε1) used in Eqs (1) and (2) includes the
crack widths because MCF theory was proposed, particularly for cracked RC. The amounts of principal tensile strain at the mid-length of strut (ε1-test), which are given inTable 3, were
mea-sured in the experiment using a DEMEC gauge with a resolution of 0.001 mm. Pε1-test:ultimate
[image:12.612.75.577.119.370.2]shear strength of deep beam calculated by STM usingε1-test(kN). Fig 10. Typical FE compressive stress-distribution in RC deep beams.
doi:10.1371/journal.pone.0130734.g010
Table 2. Comparison of ultimate shear strength of RC deep beams resulted from ACI 318–11, AASHTO LRFD, NLFEM and experiment.
a/d a(mm) PACI(kN) PAASHTO(kN) PFEM(kN) Ptest(kN)
0.75 216.75 707.95 817.18 892.34 756.95
1.00 289.00 615.77 720.51 588.11 709.02
1.25 361.25 537.38 685.97 525.49 604.08
1.50 433.50 472.88 617.00 641.49 555.91
1.75 505.75 420.17 541.14 455.91 403.01
2.00 578.00 376.88 470.01 401.32 360.00
doi:10.1371/journal.pone.0130734.t002
[image:12.612.37.576.605.698.2]Table 4indicates the ratio of the deep beam ultimate shear strength usingε1-testand
ε1-AASHTOto the ultimate shear strength from the experiment. Usingε1-testin place of
ε1-AASHTOobtained more accurate results for the ultimate shear strength of deep beams
consid-ering the average value inTable 4. Therefore, calibrating the value ofε1-AASHTOwith the
exper-imental results is needed to enhance the results of ASHTO LRFD STM for RC deep beams. The a/d ratio mainly governed the behaviour of deep beams. Therefore, an empirical equa-tion was proposed between the two ratios of and,ε1-test/εAASHTOas shown in Eq (8).ε1-test:
principal tensile strain of strut from the test.
[image:13.612.35.578.74.336.2]The data fromTable 3were plotted inFig 12to obtain Eq (8). The empirical Eq (8) was pro-posed to modify the principal tensile strain of the RC strut that AASHTO LRFD recommended for RC deep beams with 0.75a/d2.00.
Fig 11. Comparison of shear strength of deep beams from codes and experiment.
[image:13.612.33.582.605.698.2]doi:10.1371/journal.pone.0130734.g011
Table 3. Principal tensile strain of strut resulted from test and AASHTO LRFD method.
a/d εs ε1-AASHTO ε1-test ε1-test/ε1-AASHTO
0.75 0.0011 0.0033 0.0031 0.94
1.00 0.0011 0.0050 0.0051 1.02
1.25 0.0011 0.0072 0.0083 1.15
1.50 0.0011 0.0099 0.0126 1.27
1.75 0.0011 0.0130 0.0180 1.39
2.00 0.0011 0.0167 0.0262 1.57
doi:10.1371/journal.pone.0130734.t003
Eqs (8) and (9) obtainε1-recommendedbased onε1-AASHTOand a/d. This empirical equation is
confined to STM used in analyzing RC deep beams.
R¼0:50ða
dÞ þ0:53 ð8Þ
ε1recommended ¼Rε1AASHTO ð9Þ
Where,
R: modification ratio,ε1-recommended: principal tensile strain of strut recommended in this
[image:14.612.199.577.98.203.2]research,ε1-AASHTO: principal tensile strain of strut from AASHTO LRFD
Table 4. Comparison of ultimate shear strength of RC deep beams usingε1-testandε1-AASHTOwith test
results.
No a/d PAASHTO/Ptest Pε1-test/Ptest
1 0.75 1.09 0.95
2 1.00 1.02 1.03
3 1.25 1.14 1.04
4 1.50 1.12 0.94
5 1.75 1.35 0.94
6 2.00 1.31 0.95
Average 1.17 0.97
doi:10.1371/journal.pone.0130734.t004
Fig 12. Empirical relationship betweenε1-AASHTO andε1-testfor RC deep beams with 0.75a/d2.00.
doi:10.1371/journal.pone.0130734.g012
[image:14.612.38.566.429.696.2]Conclusion
This study aimed to modify STM for RC deep beams through the modification of the strut effectiveness factor. Six RC deep beams with different a/d ratios were tested until failure. Based on the experimental results, the following conclusions are drawn:
1. The results of STM method recommended by AASHTTO LRFD (2012) in the range of 0.75a/d2.00 were averagely in better agreement with the experimental results than the results of ACI 318–11.
2. An empirical equation was proposed to modify the theoretical value of principal tensile strain value of strut from AASHTO LRFD for RC deep beams with 0.75a/d2.00. The strut effectiveness factor equation was then modified using this empirical equation.
3. The elastic behavior was dominant for the RC deep beams for applied load approximately up to 30% of the ultimate load.
4. The first flexural cracks appeared at the applied load that was approximately greater than 50% of the ultimate load.
5. For an equivalent applied load, the maximum width of the diagonal crack increased with the increase of the a/d ratio.
The empirical equation proposed for the principal tensile strain of strut is confined to STM used in analysis of RC deep beams. The proposed empirical equation in this research can be further explored through the consideration of the RC deep beams with a/d ratio below 0.75. The results of NLFEM showed lower accuracy than those of obtained by STM method from ACI 318–11 and AASHTO LRFD. However, the results of NLFEM may become more accurate with improved assumptions. The adoption of smeared crack model to attain crack morphology may improve the NLFEM results. The effect of size of deep beams on the proposed model could be further explored with conducting more extensive experimental program.
Acknowledgments
The authors acknowledge Dura Technology S/B for facilitating the experimental work.
Author Contributions
Conceived and designed the experiments: MP YLV. Performed the experiments: MP HKC. Analyzed the data: MP. Contributed reagents/materials/analysis tools: MP YLV. Wrote the paper: MP HKC.
References
1. Kong FK. Reinforced Concrete Deep Beams: Blackie, Glasgow and London; 1990. 288 p.
2. ACI. Building Code Requirements for Structural Concrete and Commentary, section 10.7 and R10.7.2011. 317–8 p.
3. AASHTO. Design specifications, customary U.S. units: 2012 interim revisions. 4 ed. Washington: American Association of State Highway and Transportation Officials; 2012.
4. CAN/CSA-S6-06. Canadian highway bridge design code and S6.1–06 commentary on CAN/CSA-S6-06, Canadian Highway Bridge Design Code: Association canadienne de normalisation; 2006.
5. CSA-A23.3–04. Technical Committee on Reinforced Concrete Design. A23.3–04 Design of Concrete Structures: Canadian Standards Association; 2005.
6. DIN. Building and Civil Engineering Standards Committee. Plain, Reinforced and Prestressed Concrete Structures, Part 1: Design and Construction (DIN 1045–1). Berlin, Germany: Deutsches Institut für Nor-mung (DIN-Normen),; 2001.
7. Eurocode2. EN 1992–2:2005, Design of concrete structures—Part 2: Concrete bridges—Design and detailing rules2005.
8. NZS. Concrete Design Committee P 3101 for the Standards Council. Concrete Structures Standard: Part 1-The Design of Concrete Structures (NZS 3101–1). Wellington: Standards New Zealand; 2006.
9. Ritter W. Die Bauweise Henn bique, Schweizerische Bauzeitung. 1899.
10. Mörsch E. Der Eisenbetonbau, seine Theorie und Anwendung, 2nd ed. concrete-steel construction. New York: Good rich, McGraw Hill; 1909.
11. Collins MP, Vecchio FJ. The modified compression-field theory for reinforced concrete elements sub-jected to shear. ACI Journal. 1986.
12. Schlaich JS, Schafer K. Towards a consistent design of reinforced concrete structures. Journal of the prestressed concrete institute. 1987; 32(3).
13. Hendy CR, Smith DA, Expert E. Designers' Guide to EN 1992–2: Eurocode 2: Design of Concrete Structures. Concrete bridges: Thomas Telford; 2007.
14. Muttoni A, Schwartz J, Thürlimann B. Design of Concrete Structures With Stress Fields: Springer; 1997.
15. Panjehpour M, Ali AAA, Anwar Mp, Aznieta FN, Voo YL. An overview of strut-and-tie model and its com-mon challenges. International journal of engineering research in Africa. 2012; 8:37–45.
16. Panjehpour M, Ali AAA, Voo YL, Aznieta FN. Strut elaboration in strut-and-tie model ConstructII. 2012; 2:45–53.
17. AS3600. Australian standard for Concrete structures. standard association of Australia, North sydney; 2009. p. 198.
18. Farghaly A, Benmokrane B. Shear Behavior of FRP-Reinforced Concrete Deep Beams without Web Reinforcement. Journal of Composites for Construction. 2013; 10(1061).
19. Kim HS, Lee MS, Shin YS. Structural Behaviors of Deep RC Beams under Combined Axial and Bend-ing Force. Procedia EngineerBend-ing. 2011; 14(0):2212–8.http://dx.doi.org/10.1016/j.proeng.2011.07.278.
20. Mohammad M, Jumaat MZB, Chemrouk M, Ghasemi A, Hakim SJS, Najmeh R. An Experimental Inves-tigation of the Stress-Strain Distribution in High Strength Concrete Deep Beams. Procedia Engineering. 2011; 14(0):2141–50.http://dx.doi.org/10.1016/j.proeng.2011.07.269.
21. Schlaich J, Weischede D. Detailing of concrete structures (in German). Bulletin d' Information 150, Comite Euro-International du Beton, Paris. 1982:163.
22. Mohammadhassani M, Jumaat MZ, Jameel M. Experimental investigation to compare the modulus of rupture in high strength self compacting concrete deep beams and high strength concrete normal beams. Construction and Building Materials. 2012; 30(0):265–73.http://dx.doi.org/10.1016/j. conbuildmat.2011.12.004.
23. Zhang N, Tan K-H. Effects of support settlement on continuous deep beams and STM modeling. Engi-neering Structures. 2010; 32(2):361–72.http://dx.doi.org/10.1016/j.engstruct.2009.09.019.
24. Cheng M-Y, Cao M-T. Evolutionary multivariate adaptive regression splines for estimating shear strength in reinforced-concrete deep beams. Engineering Applications of Artificial Intelligence. 2014; 28(0):86–96.http://dx.doi.org/10.1016/j.engappai.2013.11.001.
25. Panjehpour M, Ali AAA, Aznieta FN. Energy absorption of reinforced concrete deep beams strength-ened with CFRP sheet. Steel and Composite Structures. 2014; 16(5):481–9.http://dx.doi.org/10. 12989/scs.2014.16.5.481
26. Panjehpour M, Ali AAA, Voo YL, Aznieta FN. Effective compressive strength of strut in CFRP-strength-ened reinforced concrete deep beams following ACI 318–11. Computers and Concrete. 2014; 13 (1):135–65.http://dx.doi.org/10.12989/cac.2014.13.1.135
27. Panjehpour M, Ali AAA, Voo YL, Aznieta FN. Modification of strut effectiveness factor for reinforced concrete deep beams strengthened with CFRP laminates. Materiales de Construcción. 2014; 64(314). http://dx.doi.org/10.3989/mc.2014.02913. doi10.1038/srep05988PMID:25100561
28. Bruggi M. Generating strut-and-tie patterns for reinforced concrete structures using topology optimiza-tion. Computers & Structures. 2009; 87(23–24):1483–95.http://dx.doi.org/10.1016/j.compstruc.2009. 06.003.
29. Godat A, Chaallal O. Strut-and-tie method for externally bonded FRP shear-strengthened large-scale RC beams. Composite Structures. 2013; 99(0):327–38.http://dx.doi.org/10.1016/j.compstruct.2012. 11.034.
30. He Z-Q, Liu Z. Optimal three-dimensional strut-and-tie models for anchorage diaphragms in externally prestressed bridges. Engineering Structures. 2010; 32(8):2057–64. doi10.1016/j.engstruct.2010.03. 006
31. Khalifa ES. Macro-mechanical strut and tie model for analysis of fibrous high-strength concrete corbels. Ain Shams Engineering Journal. 2012; 3(4):359–65.http://dx.doi.org/10.1016/j.asej.2012.04.004.
32. Perera R, Vique J. Strut-and-tie modelling of reinforced concrete beams using genetic algorithms opti-mization. Construction and Building Materials. 2009; 23(8):2914–25. doi10.1016/j.conbuildmat.2009. 02.016
33. Perera R, Vique J, Arteaga A, Diego AD. Shear capacity of reinforced concrete members strengthened in shear with FRP by using strut-and-tie models and genetic algorithms. Composites Part B: Engineer-ing. 2009; 40(8):714–26.http://dx.doi.org/10.1016/j.compositesb.2009.06.008.
34. Wang G-L, Meng S-P. Modified strut-and-tie model for prestressed concrete deep beams. Engineering Structures. 2008; 30(12):3489–96. doi10.1016/j.engstruct.2008.05.020
35. Alam MA, Jumaat MZ. Experimental Investigations on U- and L-Shaped End Anchored CFRP Laminate Strengthened Reinforced Concrete Beams The Arabian Journal for Science and Engineering (AJSE) 2012;(37–4: ):905–19.
36. Belarbi A, Hsu TTC. Constitutive laws of softened concrete in biaxial tension-compression. ACI, Struc-ture Journal. 1995; 92(5):562–73.
37. Hognestad E. Inelastic behaviour in tests of eccentrically loaded short reinforced concrete columns. ACI Journal. 1952; 49(10):117–39.