Interlaboratory Comparison of Six Real-Time PCR Assays for
Detection of Bovine Leukemia Virus Proviral DNA
J. P. Jaworski,a,bA. Pluta,cM. Rola-Łuszczak,cS. L. McGowan,dC. Finnegan,dK. Heenemann,eH. A. Carignano,aI. Alvarez,a,b K. Murakami,fL. Willems,gT. W. Vahlenkamp,eK. G. Trono,a,bB. Choudhury,dJ. Kuz´makc
aInstituto Nacional de Tecnología Agropecuaria (INTA), CICVyA, Instituto de Virología, Buenos Aires, Argentina
bConsejo Nacional de Investigaciones Científicas y Tecnológicas (CONICET), Buenos Aires, Argentina
cNational Veterinary Research Institute (NVRI), Pulawy, Poland
dAnimal and Plant Health Agency (APHA), Weybridge, United Kingdom
eInstitute of Virology, Center for Infectious Diseases, University of Leipzig, Leipzig, Germany
fDepartment of Veterinary Medicine, Faculty of Agriculture, Iwate University, Morioka, Iwate, Japan
gGembloux Agro-Bio Tech and GIGA Institute, University of Liège, Liège, Belgium
ABSTRACT Quantitative real-time PCR (qPCR) is increasingly being used for the de-tection of bovine leukemia virus (BLV) proviral DNA. Nevertheless, quality control for the validation and standardization of such tests is currently lacking. Therefore, the present study was initiated by three Office International des Epizooties (OIE) refer-ence laboratories and three collaborating laboratories to measure the interlaboratory variability of six already developed and available BLV qPCR assays. For that purpose, an international panel of 58 DNA samples reflecting the dynamic range of the ma-jority of the assays was distributed to six testing centers. Based on qualitative re-sults, the overall agreement among all six laboratories was moderate. However, sig-nificant variability in the measurement of the BLV proviral DNA copy number was observed among different laboratories. Quantitative PCR assays, even when per-formed by experienced staff, can yield large variability in BLV proviral DNA copy numbers without harmonization. Further standardization of different factors (i.e., uti-lization of unified protocols and unique calibrators) should increase interlaboratory agreement.
KEYWORDS bovine leukemia virus (BLV), proviral DNA, interlaboratory ring trial, quantitative real-time PCR (qPCR)
B
ovine leukemia virus (BLV) is a deltaretrovirus in the subfamilyOrthoretrovirinae, familyRetroviridae, and is the etiologic agent of enzootic bovine leukosis (EBL) (1). BLV in cattle causes a persistent infection, which in most cases remains clinically silent; however, in one-third of infected animals, it progresses to a state of persistent lym-phocytosis, and 1 to 10% of infected cattle develop lymphosarcoma (2). BLV has a significant economic impact on the dairy industry due to trade restrictions, replacement cost, reduced milk production, immunosuppression, and increased susceptibility to pneumonia, diarrhea, mastitis, and other diseases (3).BLV is distributed worldwide, with high prevalences reported in North and South America, Asia, and Eastern Europe. The disease has been eradicated from Western Europe, Scandinavia, and Oceania due to the implementation of official programs based on the detection and sacrifice of infected animals, thus providing a trading advantage.
Serologic assays have been widely used as screening tests for BLV due to their ability to test large numbers of samples at a very low cost and high sensitivity (4). However, there are multiple scenarios where direct detection of the antigen is necessary, e.g.,
Received21 February 2018Returned for modification30 March 2018Accepted13 April 2018
Accepted manuscript posted online18 April 2018
CitationJaworski JP, Pluta A, Rola-Łuszczak M, McGowan SL, Finnegan C, Heenemann K, Carignano HA, Alvarez I, Murakami K, Willems L, Vahlenkamp TW, Trono KG, Choudhury B, Kuz´mak J. 2018. Interlaboratory comparison of six real-time PCR assays for detection of bovine leukemia virus proviral DNA. J Clin Microbiol 56:e00304-18.https://doi.org/10.1128/JCM
.00304-18.
EditorBrad Fenwick, University of Tennessee at Knoxville
Copyright© 2018 American Society for Microbiology.All Rights Reserved. Address correspondence to J. P. Jaworski, jaworski.juan@inta.gob.ar.
J.P.J. and A.P. contributed equally to this article.
crossm
on May 16, 2020 by guest
http://jcm.asm.org/
screening calves with maternal antibodies, animals with hyperacute infection, or ani-mals that are not generating a persistent antibody response. In this regard, nucleic acid amplification tests, such as PCR, play an increasing role in the detection of BLV proviral DNA. Moreover, the use of quantitative real-time PCR (qPCR) assays has the added benefit of generating quantitative results (5–7). Considering that the BLV proviral load correlates directly with the risk of transmission (8, 9), this feature of qPCR is important for developing rational segregation programs based on minimizing the risk of trans-mission. In addition, the high sensitivity of qPCR is crucial, since BLV may be present in very low quantities in some infected, seronegative, and asymptomatic animals that are responsible for the recurrence of infection in disease-free herds (10, 11).
In recent years, several molecular tests based on real-time technology have been developed and used for the detection of BLV proviral DNA in naturally infected animals (5–7, 12, 13). Nevertheless, quality control for the validation and standardization of such tests is currently lacking. Evaluation of overall interlaboratory variability in methods and results is necessary for the future implementation of an appropriate harmonization scheme (14, 15). Furthermore, harmonization and standardization of BLV qPCR assays are essential to enable the comparison of data from international surveillance programs (14–17). Therefore, a study was initiated by three Office International des Epizooties (OIE) reference laboratories and three collaborating laboratories to assess the inter-laboratory variability of six already developed and available real-time PCR assays for the detection of BLV proviral DNA.
MATERIALS AND METHODS
Participants.The six laboratories that took part in the study were at (i) the National Agricultural Technology Institute (INTA), Buenos Aires, Argentina (ARG); (ii) the Molecular and Cellular Biology Laboratory of Gembloux Agro-Bio Tech, Gembloux, Belgium (BE); (iii) the Institute of Virology, Center for Infectious Diseases, University of Leipzig, Leipzig, Germany (GER); (iv) the Department of Veterinary Medicine, Iwate University, Iwate, Japan (JPN); (v) the National Veterinary Research Institute (NVRI), Pulawy, Poland (PL); and (vi) the Animal and Plant Health Agency (APHA), Weybridge, United Kingdom (UK). Three of these laboratories, those at the APHA, the NVRI, and the University of Leipzig, are acting as OIE reference laboratories for EBL. The six participating laboratories are referred to below as ARG, BE, GER, JPN, PL, and UK, respectively.
Sample collection and DNA extraction.Blood samples were taken from a total of 56 cattle that were serologically positive for BLV infection. The animals came from seven countries: Ukraine (n⫽8), Russia (n⫽10), Moldova (n⫽9), Croatia (n⫽1), Japan (n⫽4), Argentina (n⫽5), and Poland (n⫽19). Serological testing and sample processing were conducted by the laboratories from which the samples originated. At the NVRI, peripheral blood leukocytes (PBLs) were isolated by centrifugation at 1,500⫻g for 25 min, and erythrocytes were hemolyzed by osmotic shock with H2O and 4.5% NaCl. After two washes in phosphate-buffered saline (PBS), the supernatant was discarded, and the cell pellet was used for the extraction of genomic DNA. PBLs isolated from cattle from Ukraine, Russia, and Moldova were sent to the NVRI as dry pellets. Genomic DNA was extracted with the DNeasy blood and tissue kit (Qiagen) according to the manufacturer’s recommendations. The genomic DNA from Argentinian samples was extracted from peripheral blood mononuclear cells (PBMCs) using a High Pure PCR template preparation kit (Roche, Penzberg, Germany) according to the manufacturer’s instructions. Samples from Japan were preprocessed as described by Somura and colleagues previously (18). Briefly, a DNeasy blood and tissue kit was used to purify genomic DNA from blood. The DNA samples from Argentina and Japan were then sent to the NVRI in the form of DNA solutions. One DNA sample from Croatia was kindly supplied by D. Balic (Veterinary Institute, Vinkovci, Croatia). Additionally, one DNA sample extracted from FLK-BLV cells and one sample extracted from PBLs of serologically negative cattle were included as positive and negative controls, respectively. The DNA concentrations in all samples were calculated using a Nano-Photometer (Implen). Each sample was divided into seven identical aliquots containing 1.5g of DNA. Seven identical sets of these samples were prepared and distributed to participating laboratories. The samples were stored and shipped refrigerated at 4°C.
Examination of DNA quality/stability.Since different extraction and purification methods were employed for the preparation of the DNA samples, it was necessary to test the quality of the DNA. For that purpose, one complete set of samples (n⫽58) was tested by quantitative real-time PCR (qPCR) to determine the copy number of the histone H3 family 3A (H3F3A) housekeeping gene (19). The results were expressed as the number of H3F3A gene copies per 500 ng of DNA in each sample. To determine whether there were any outlier values for H3F3A gene copy numbers in these samples, Grubbs’ test was performed. In order to test the stability of DNA, samples were stored at⫹4°C and were retested by qPCR 21 days after the original measurement to detect H3F3A gene copy numbers. Attest was used to compare the mean values between the two groups (time 0 and time 1 [after 21 days at⫹4°C]).
Sample distribution.All samples were coded (identification [ID] numbers 1 to 58) so that the testing could be performed blind. The samples were air shipped with a cold pack. All the samples arrived at their destinations within 2 to 5 days.
on May 16, 2020 by guest
http://jcm.asm.org/
Description of BLV qPCR protocols used by participating laboratories.All participating labora-tories performed the qPCR using a variety of different equipment, reagents, and reaction conditions, which had been set up, validated, and evaluated previously and are currently used as working protocols. The specific features of each of these protocols are described below and summarized in Table 1. All laboratories applied standard procedures for avoiding false-positive results as a consequence of DNA contamination, such as the use of separate rooms for preparing reaction mixtures, adding the samples, and performing the amplification reaction. Five of the six BLV qPCRs used thepolgene as the target sequence for amplification, while the JPN qPCR amplified thetaxgene.
(i) ARG qPCR.PCRs for BLV contained Fast Start Universal SYBR green master mix (Roche), 800 nM forward (Fw) and reverse (Rv) primers (Fw, 5=-CCTCAATTCCCTTTAAACTA-3=; Rv, 5=-GTACCGGGAAGACT GGATTA-3=) (7), and 100 ng of purified DNA as the template. Real-time PCR was performed on the ABI 7500 machine (Applied Biosystems) under the following cycling conditions: 2 min at 50°C and 95°C for 10 min, followed by 40 cycles at 95°C for 15 s, 55°C for 15 s, and 60°C for 1 min. After the reaction was completed, the specificity of the amplicons was checked by analyzing the individual dissociation curves. As a standard, plasmid pBLV1, containing a BLVpolfragment, was used. Tenfold dilutions of this standard were made from 5⫻106copiesl⫺1to 5 copiesl⫺1. Highly and weakly positive controls, as well as two negative controls, were included in each tested plate.
(ii) BE qPCR. BLV sequences were PCR amplified usingpolgene sequence-specific primers (Fw, 5=-GAAACTCCAGAGCAATGGCATAA-3=; Rv, 5=-GGTTCGGCCATCGAGACA-3=). As a reference for quantifi-cation, the-actin gene was amplified with oligonucleotides 5=-TCCCTGGAGAAGAGCTACGA-3=(Fw) and 5=-GGCAGACTTAGCCTCCAGTG-3=(Rv) (20). DNA was amplified in a Roche LightCycler system using MESA green master mix (Eurogentec). The thermal protocol was initiated by a 5-min denaturation step at 95°C, followed by 45 cycles of 15 s at 95°C, 20 s at 60°C, and 40 s at 72°C, and terminated by a melting curve. PCR efficiencies were calculated for each sample using 100 ng, 33 ng, and 11 ng of DNA. Standard curves were generated using pCR4-TOPO vectors (Life Technologies) containing the correspondingpolor actin gene amplicon. The proviral load was calculated by dividing the number of proviral copies by half of the number of actin copies and averaging the loads for the three dilutions; the average proviral load was expressed as the number of proviral copies per 100 PBMCs.
(iii) GER qPCR.The BLV real-time PCR was performed as published previously (5), as follows. The PCR was performed in a 20-l reaction volume using the TaqMan universal PCR master mix including AmpliTaq Gold DNA polymerase, AmpErase uracilN-glycosylase (UNG), a mixture of deoxyribonucleotide triphosphate with 2=-dUTP, and a passive reference dye (5-carboxy-X-rhodamine [ROX]). The reaction mixture included 10l of universal PCR master mix, 10 pmol/l of each oligonucleotide (pol-specific primers, apol-specific probe, and an internal-control probe), and 50 ng of the sample DNA. If necessary, distilled H2O was added until a 20-l reaction volume was reached. A control plasmid containing thepol amplicon (112 bp) was diluted from 4.68⫻106to 4.68⫻10⫺1to generate a standard curve. The reaction was carried out using the Rotor-Gene Q system (Qiagen) with the following temperature profile: 2 min at 50°C and 10 min at 95°C, followed by 40 cycles of 15 s at 95°C and 1 min at 58°C. The fluorescence data were collected during the annealing step for the BLVpolprobe in the green channel and for the BLV control probe in the yellow channel.
(iv) JPN qPCR.The BLV proviral load was measured using a Cycleave PCR bovine leukemia virus detection kit (TaKaRa, Shiga, Japan) and an ABI Step One plus system (Applied Biosystems, Foster City, CA, USA) according to the manufacturers’ instructions. The Cycleave BLV qPCR is a commercially available method designed to amplify thetaxregion of the BLV genome.
[image:3.585.39.549.83.261.2](v) PL qPCR.The BLV qPCR was performed as published previously (7). A quantitative TaqMan PCR was carried out in a 25-l PCR mixture containing 12.5l of 2⫻QuantiTect Multiplex PCR NoROX master TABLE 1Primers and probes used in this study
PCR assay
Target gene
Primer or probe
positionsa Sequence (5=–3=)b
Amplicon
size (bp) Reference
ARG pol Fw, 2321–2340 CCTCAATTCCCTTTAAACTA 120 7
Rv, 2421–2440 GTACCGGGAAGACTGGATTA
Probe N/A
BE pol Fw, 3994–4016 GAAACTCCAGAGCAATGGCATAA 67 20
Rv, 4043–4060 GGTTCGGCCATCGAGACA
Probe N/A
GER pol Fw, 3298–3318 CCCTGGCCTACTTTCAGACC 114 5
Rv, 3390–3411 CTTGGCATAAGAGCTTAAGGCC
Probe, 3322–3345 TTGACTGACAACCAAGCCTCACCT
JPN tax N/A N/A N/A N/A
PL pol Fw, 2321–2340 CCTCAATTCCCTTTAAACTA 120 7
Rv, 2421–2440 GTACCGGGAAGACTGGATTA
Probe, 2341–2360 GAACGCCTCCAGGCCCTTCA
UK pol Fw, 2321–2340 CCTCAATTCCCTTTAAACTA 120 7
Rv, 2421–2440 GTACCGGGAAGACTGGATTA
Probe, 2341–2360 GAACGCCTCCAGGCCCTTCA
aNucleotide positions are given according to GenBank accession no.K02120.1. bN/A, no data available.
on May 16, 2020 by guest
http://jcm.asm.org/
mix (Qiagen), 0.4M each primer, 0.2M specific BLV probe, and 500 ng of extracted genomic DNA. Amplification was performed in the Rotor-Gene Q system (Qiagen) using an initial denaturation step and polymerase activation at 95°C for 15 min, followed by 50 cycles of 94°C for 60 s and 60°C for 60 s. All samples were amplified in duplicate. As a standard, the pBLV1 plasmid, containing a 120-bp BLVpol fragment, was used. Tenfold dilutions of this standard were made from 1⫻106copies perl to 100 copies perl and were used to estimate the BLV copy numbers.
(vi) UK qPCR.The APHA’s protocol was performed as at the NVRI (7) except for the use of 5⫻ QuantiFast master mix (Qiagen) instead of 2⫻QuantiTect Multiplex PCR NoROX master mix (Qiagen). Tenfold dilutions of the pBLV1 standard were made from 1⫻106copies perl to 1⫻100copy perl and were used to estimate the BLV copy numbers.
Analysis of BLVpolandtaxsequences targeted by particular qPCR assays.In order to assess full-lengthpolandtaxsequence variability among BLV genotypes, all BLV whole-genome sequences (n⫽ 74) available in public repositories (https://www.ncbi.nlm.nih.gov/GenBank/) were retrieved. Thirty-eight of these full-genome sequences had already been assigned toenv-based BLV genotypes (i.e., G1, G2, G4, G6, G9, and G10), and the remaining sequences belonged to unknown genotypes. In order to represent all known genotypes (i.e., G1 to G10), complete Env sequences belonging to each missing genotype (G3, G5, G7, and G8) were considered (n⫽12). Thus, anenv-based maximum likelihood (ML) phylogenetic tree (see Fig. S1 in the supplemental material) was constructed in order to assign genotypes to the unassigned BLV genomes. Sequences were aligned using the MAFFT program (21). Model selection for the best fit of the sequence data was performed with SMS software (22). An ML tree employing the Akaike information criterion (AIC)-based HKY85⫹I model, as implemented in the PhyML program (23), was built. As a measure of the branches’ robustness, an approximate likelihood ratio test (aLRT) was calculated. From this analysis, a total of 74 full-lengthpol andtaxsequences from 7 assigned BLV genotypes (G1, G2, G3, G4, G6, G9, and G10) were used for multiple-sequence alignment (MSA) according to the MAFFT program. Measures of nucleotide diversity () and nucleotide differences per site (dps) were calculated using MEGA7 software (24) as follows: ⫽ ⌺ijxixjij⫽2⫻ ⌺i⫽2
n ⌺
j⫽1
i⫺1x
ixjij, wherexiandxjare the frequencies of theith andjth sequences,ijis the number of nucleotide differences per nucleotide site between theith andjth sequences, andnis the absolute number of sequences in the study. Shannon information entropy (H) per site was calculated using SHiAT v1.1 (25), whereH(X) is calculated as⫺ ⌺in⫽1p
共xi兲logmp共xi兲,p(xi) is the observed probability (frequency) of nucleotidexifor all possiblei’s, andm, the number of possible information states, is 5 (A, C, G, T, and gaps).
RESULTS
Examination of the quality and stability of DNA samples.In order to test the
quality of DNA samples, the H3F3A gene copy number per 500 ng of DNA was calculated at the NVRI, and then the respective values were tested by Grubbs’ test. The results for all 58 DNA samples followed a normal distribution, with a mean value of 46,923 copies (95% confidence interval [CI], 42,858 to 52,984 copies), a minimum value of 1,552 copies, and a maximum value of 87,669 copies (see Table S1 in the supple-mental material). Despite the single very low value, no outlier was found for any samples (P⬍0.05). Therefore, it can be assumed that the DNA quality was acceptable for all samples present in the panel.
Next, DNA stability was assessed by retesting the H3F3A gene copy numbers in all samples after 21 days at⫹4°C. Attest was used to compare the mean values between the two groups (time 0 and time 1 [21 days later]), and no significant difference was observed at the 5% level (P⫽0.18) (Fig. 1). Therefore, it appears that sample storage and shipping did not influence DNA stability and further testing during the interlabo-ratory trial.
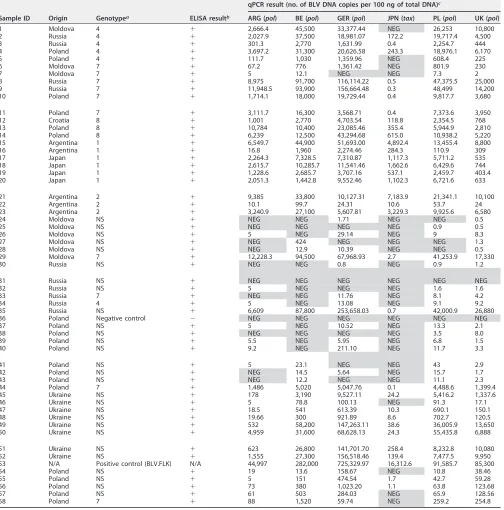
Detection of BLV proviral DNA by different qPCR assays. A total of 58 DNA
samples, including a positive (sample 53) and a negative (sample 36) control, were tested independently by six qPCR methods (Table 2). Except for the negative and the positive (FLK cell line) controls, all samples showed detectable levels of BLV-specific antibodies (BLV-Abs) by enzyme-linked immunosorbent assays (ELISA). Both the posi-tive and negaposi-tive controls were assessed adequately by all six tests. Considering all 57 positive samples, 47, 45, 49, 32, 53, and 56 samples were detected as positive by the ARG, BE, GER, JPN, PL, and UK qPCRs, respectively. Based on these observations, the most sensitive method was the UK qPCR, and the method with the lowest sensitivity was the JPN qPCR. Thirty-three of 58 samples were identified correctly by all qPCRs. A single BLV-seropositive sample (no. 31) tested negative by all qPCR assays. The remain-ing 24 samples gave discordant results. Comparison of qualitative results (positive versus negative) from all six laboratories revealed 80% overall agreement and a kappa value of 0.342 (Cohen’s kappa method adapted by Fleiss). The levels of agreement
on May 16, 2020 by guest
http://jcm.asm.org/
among the results from the six laboratories are represented in Table 3. The highest agreement was seen between two laboratories (PL and UK [94.8% agreement and a Cohen’s kappa value of 0.549]) that used similar protocols and targeted the same region of BLVpol.
Analysis of BLVpolandtaxsequences targeted by particular qPCR assays.Due
to differences in performance observed among thepol-based qPCR assays (the ARG, PL, UK, GER, and BE qPCRs), and considering that thetax-based qPCR (JPN) assay showed the lowest sensitivity and the poorest agreement with the other assays, the degree of sequence variability between thepolandtaxgenes was addressed. From the MSAs for polandtax, the average number of nucleotide difference per site (dps) was calculated. The dps value fortaxwas lower than that forpol(dps, 11 fortaxand 512 forpol). In addition, we observed that the nucleotide diversity () oftaxwas lower than that ofpol (tax, 0.017 [standard deviation {SD}, 0.002]; pol, 0.211 [SD, 0.02]). From this analysis, tax sequences appeared to be less variable than pol sequences. In addition, we performed a Shannon entropy-based per-site variability profile of thepolandtaxgenes (Fig. 2). This analysis showed a marked region of variability toward the 3=region ofpol. Interestingly, we noted that the BE qPCR primers targeted this particular region ofpol, whereas the ARG, GER, PL, and UK primers targeted the most-conserved regions (Fig. 2; see also Fig. S2a to c in the supplemental material). In contrast to thepolprofile, the profile observed for thetaxgene was homogeneous along the whole sequence.
Quantitation of BLV proviral DNA by different qPCR assays.In order to analyze whether the range of copy numbers detected by each qPCR was comparable to those of the others, Kruskal-Wallis one-way analysis of variance (ANOVA) was used (Fig. 3). The grouping variable revealed significant differences among the distributions of proviral DNA copy numbers with the various qPCRs (P⬍0.0001). These results showed that the abilities of particular qPCRs to determine the proviral DNA copy number differed. The correlations between copy numbers detected by different qPCRs were calculated. Although there were statistically significant differences in the distribution of copy numbers, a moderate correlation (Kendall’s tau⫽0.514;P⬍0.001) between particular qPCRs was found.
Since interlaboratory variation may be influenced by the number of BLV proviral copies present in each sample, we compared the average number of BLV copies between a group of samples that gave concordant results (group I [n⫽ 34]) and a FIG 1Assessment of the stability of DNA samples. Shown are copy numbers of the H3F3A housekeeping gene in 58 DNA samples that were stored at 4°C and tested twice with a 21-day interval. Attest was used to compare the mean values for the two groups (P⫽0.18).
on May 16, 2020 by guest
http://jcm.asm.org/
[image:5.585.62.351.71.288.2]group that gave discordant results (group II [n⫽24]). The mean number of copies in group I was 20,310 (minimum, 0; maximum, 207,587), while that in group II was 902 (minimum, 0.2; maximum, 19,766), and this difference was statistically significant (P,
⬍0.001 by a Studentttest) (Fig. 4).
DISCUSSION
[image:6.585.43.547.85.595.2]Classic BLV eradication programs consist of correct identification and segregation/ elimination of BLV-infected animals. In this regard, the detection of BLV-Abs (directed TABLE 2Results of qPCR analysis on 58 DNA samples used in this study
Sample ID Origin Genotypea ELISA resultb
qPCR result (no. of BLV DNA copies per 100 ng of total DNA)c
ARG (pol) BE (pol) GER (pol) JPN (tax) PL (pol) UK (pol)
1 Moldova 4 ⫹ 2,666.4 45,500 33,377.44 NEG 26,253 10,800
2 Russia 4 ⫹ 2,027.9 37,500 18,981.07 172.2 19,717.4 4,500
3 Russia 4 ⫹ 301.3 2,770 1,631.99 0.4 2,254.7 444
4 Poland 4 ⫹ 3,697.2 31,300 20,626.58 243.3 18,976.1 6,170
5 Poland 4 ⫹ 111.7 1,030 1,359.96 NEG 608.4 225
6 Moldova 7 ⫹ 67.2 776 1,361.42 NEG 801.9 230
7 Moldova 7 ⫹ 5 12.1 NEG NEG 7.3 2
8 Russia 7 ⫹ 8,975 91,700 116,114.22 0.5 47,375.5 25,000
9 Russia 7 ⫹ 11,948.5 93,900 156,664.48 0.3 48,499 14,200
10 Poland 7 ⫹ 1,714.1 18,000 19,729.44 0.4 9,817.7 3,680
11 Poland 7 ⫹ 3,111.7 16,300 3,568.71 0.4 7,373.6 3,950
12 Croatia 8 ⫹ 1,001 2,770 4,703.54 118.8 2,354.5 768
13 Poland 8 ⫹ 10,784 10,400 23,085.46 355.4 5,944.9 2,810
14 Poland 8 ⫹ 6,239 12,500 43,294.68 615.0 10,938.2 5,220
15 Argentina 1 ⫹ 6,549.7 44,900 51,693.00 4,892.4 13,455.4 8,800
16 Argentina 1 ⫹ 16.8 1,960 2,274.46 284.3 110.9 309
17 Japan 1 ⫹ 2,264.3 7,328.5 7,310.87 1,117.3 5,711.2 535
18 Japan 1 ⫹ 2,615.7 10,285.7 11,541.46 1,662.6 6,429.6 744
19 Japan 1 ⫹ 1,228.6 2,685.7 3,707.16 537.1 2,459.7 403.4
20 Japan 1 ⫹ 2,051.3 1,442.8 9,552.46 1,102.3 6,721.6 633
21 Argentina 2 ⫹ 9,385 33,800 10,127.31 7,183.9 21,341.1 10,100
22 Argentina 2 ⫹ 10.1 99.7 24.31 10.6 53.7 24
23 Argentina 2 ⫹ 3,240.9 27,100 5,607.81 3,229.3 9,925.6 6,580
24 Moldova NS ⫹ NEG NEG 1.71 NEG NEG 0.5
25 Moldova NS ⫹ NEG NEG NEG NEG 0.9 0.5
26 Moldova NS ⫹ 5 NEG 29.14 NEG 9 8.3
27 Moldova NS ⫹ NEG 424 NEG NEG NEG 1.3
28 Moldova NS ⫹ NEG 12.9 10.39 NEG NEG 0.5
29 Moldova 7 ⫹ 12,228.3 94,500 67,968.93 2.7 41,253.9 17,330
30 Russia NS ⫹ NEG NEG 0.8 NEG 0.9 1.2
31 Russia NS ⫹ NEG NEG NEG NEG NEG NEG
32 Russia NS ⫹ 5 NEG NEG NEG 1.6 1.6
33 Russia 7 ⫹ NEG NEG 11.76 NEG 8.1 4.2
34 Russia 4 ⫹ 5 NEG 13.08 NEG 9.1 9.2
35 Russia NS ⫹ 6,609 87,800 253,658.03 0.7 42,000.9 26,880
36 Poland Negative control ⫺ NEG NEG NEG NEG NEG NEG
37 Poland NS ⫹ 5 NEG 10.52 NEG 13.3 2.1
38 Poland NS ⫹ NEG NEG NEG NEG 3.5 8.0
39 Poland NS ⫹ 5.5 NEG 5.95 NEG 6.8 1.5
40 Poland NS ⫹ 9.2 NEG 211.10 NEG 11.7 3.3
41 Poland NS ⫹ 5 23.1 NEG NEG 43 2.9
42 Poland NS ⫹ NEG 14.5 5.64 NEG 15.7 1.7
43 Poland NS ⫹ NEG 12.2 NEG NEG 11.1 2.3
44 Poland 7 ⫹ 1,486 5,020 5,047.76 0.1 4,488.6 1,399.4
45 Ukraine NS ⫹ 178 3,190 9,527.11 24.2 5,416.2 1,337.6
46 Ukraine NS ⫹ 5 78.8 100.13 NEG 91.3 17.1
47 Ukraine NS ⫹ 18.5 541 613.39 10.3 690.1 150.1
48 Ukraine NS ⫹ 19.66 300 921.89 8.6 702.7 120.5
49 Ukraine NS ⫹ 532 58,200 147,263.11 38.6 36,005.9 13,650
50 Ukraine NS ⫹ 4,959 31,600 68,628.13 24.3 55,435.8 6,888
51 Ukraine NS ⫹ 623 26,800 141,701.70 258.4 8,232.8 10,080
52 Ukraine NS ⫹ 1,555 27,300 156,518.46 139.4 7,477.5 9,950
53 N/A Positive control (BLV.FLK) N/A 44,997 282,000 725,329.97 16,312.6 91,585.7 85,300
54 Poland NS ⫹ 19 13.6 158.67 NEG 10.8 38.46
55 Poland NS ⫹ 5 151 474.54 1.7 42.7 59.28
56 Poland NS ⫹ 73 380 1,023.20 1.1 63.8 123.68
57 Poland NS ⫹ 61 503 284.03 NEG 65.9 128.56
58 Poland 7 ⫹ 88 1,520 59.74 NEG 259.2 254.8
aNS, not sequenced.
b⫹, positive;⫺, negative; N/A, not applicable. cNEG, negative results.
on May 16, 2020 by guest
http://jcm.asm.org/
mainly at BLV glycoprotein gp51) in blood serum is the most common indicator of BLV infection; agar gel immunodiffusion and ELISA are both cited by the OIE as prescribed tests (4). As the eradication program progresses and prevalence decreases, the inclu-sion of more-sensitive assays might increase program efficiency. Unlike serological assays, qPCR assays have the potential of detecting BLV DNA soon after BLV infection, when animals might present transient or very low levels of BLV-Abs (2, 8, 11, 26, 27). qPCR assays can also serve as confirmatory tests for the clarification of inconclusive and discordant serological test results (7). Moreover, qPCR allows not only the detection of BLV infection but also estimation of the BLV proviral load, which directly correlates with TABLE 3Assessment of qPCR results by pairwise comparisons
Laboratory
Kappa value or % agreementawith the results of the following laboratory:
ARG BE GER JPN PL UK
ARG 0.476 0.518 0.447 0.575 0.265
BE 82.8 0.332 0.525 0.239 0.220
GER 86.2 79.3 0.369 0.357 0.326
JPN 74.1 77.6 70.7 0.208 0.084
PL 89.7 79.3 86.2 63.8 0.549
UK 84.5 81.0 87.9 58.6 94.8
aValues above the blank cells are kappa values; values below the blank cells are percentages of agreement.
FIG 2Sequence variability measured as per-site entropy. (Top) Multiple alignment of the polgene showing the locations of qPCR fragments withinpolgene regions for the ARG/PL/UK, GER, and BE qPCR assays. (Bottom) Multiple alignment of thetaxgene.
on May 16, 2020 by guest
http://jcm.asm.org/
[image:7.585.62.353.356.705.2]the risk of disease transmission (28, 29). This feature of qPCR is important for perform-ing a rational segregation of animals, based on the risk of transmission.
In order to compare different qPCR methods from six laboratories distributed worldwide and to evaluate interlaboratory variability, an international panel of refer-ence positive samples was produced. The amounts of BLV DNA in these samples were representative of the different BLV proviral loads found in field samples (from 1 to
⬎100,000 copies of BLV proviral DNA). In addition, the reference samples covered the dynamic range of the majority of the assays used in this study. A single negative sample was included in the panel. The addition of further negative samples may have allowed FIG 3Comparison of detection of BLV proviral DNA copy numbers by six testing centers. Shown is a box plot of data from Kruskal-Wallis ANOVA, a rank test. The DNA copy numbers for 56 samples, determined independently by each of the six qPCRs, were used for the variance analysis. In this analysis, the positive control (sample 53) and negative control (sample 36) were excluded.
FIG 4Impact of BLV proviral copy numbers on the level of agreement. Attest was performed to compare the numbers of BLV proviral copies in two groups of samples: 34 samples with fully concordant results by all six qPCRs (left) and 24 samples with discordant results by different qPCRs (right) (P⬍0.001).
on May 16, 2020 by guest
http://jcm.asm.org/
[image:8.585.62.352.70.294.2] [image:8.585.62.350.491.704.2]a comparison of specificity among the different tests; however, as described in Mate-rials and Methods, each assay had already been validated at its originating institute. In addition, appropriate measures were taken to avoid contamination and false-positive results. Therefore, for the purposes of this study, the inclusion of a single negative sample was deemed sufficient.
The comparison of qualitative qPCR results among all six laboratories (raters) revealed an overall observed agreement of 80%, indicating strong interrater reliability (30). However, considering a kappa value of 0.342, that observation might be overes-timated by chance. The kappa statistic was originally described by Cohen to take account of the possibility of guessing; however, it might lower the estimate of agree-ment excessively (30). Altogether, by adjusting the overall level of agreeagree-ment using the kappa statistic, we observed an expected overall agreement of 70%. Among all six laboratories, the highest level of concordance was observed between PL and UK (94.8%; kappa⫽0.549). This result was expected, since these two laboratories used the same target sequence and similar reaction protocols, based on TaqMan technology. Another laboratory (ARG) also targeted the same region of the BLV genome; however, the ARG qPCR was based on SYBR green dye technology. It has been reported that the use of different reagents and reaction conditions might account for increased variability of qPCR results (14, 15), which may explain for the variation in results observed in this study.
Diagnostic sensitivity (DxSn) was estimated for each particular qPCR assay. Of all 57 positive samples that constituted the panel, 56 (98%), 53 (93%), 49 (86%), 47 (82%), 45 (79%), and 32 (56%) samples were scored as positive by the UK, PL, GER, ARG, BE, and JPN qPCRs, respectively. The UK and JPN qPCRs were the methods with the highest and the lowest sensitivity, respectively. Interestingly, the JPN qPCR was the only method that targeted the BLV tax region instead of pol. In this regard, previous studies comparing the pol, gag, and env genes reported that the pol gene was the most suitable region to target for diagnostic purposes, since it provided the most-sensitive assays (5–8, 12, 13, 31). This might be due in part to higher sequence conservation of polamong strains from different geographical areas. However, none of these studies comparedpolwithtaxgenes. In this study, we found that the variability and nucleotide diversity oftaxwere lower than those ofpol. A deeper analysis focused on the specific region oftaxtargeted by the JPN qPCR would have helped us to better understand our observations; however, since the JPN qPCR is a commercial kit, the oligonucleotide sequences were not available. Hence, the reason for the lower sensitivity of the tax region than thepolregion could not be elucidated. Another possibility is that temper-ature variation during long-distance shipping might have led to the degradation of DNA in the samples, particularly affecting those with lower concentrations. Conse-quently, the degradation of target DNA might have limited the detection of BLV DNA by qPCR.
Since we had only partial information regarding the genotypes of the sample panel, we considered allpolsequences available from full-length BLV genomes in order to visualize how sequence variability would impact the annealing of the different primers used in each of thepolqPCRs. The variability profile analysis of thepolgene showed that the ARG, POL, UK, and GER oligonucleotides were located in the less-variable region, whereas the BE oligonucleotides aligned to a region of high variability. This is in agreement with the level of sensitivity observed for each of the pol-based qPCR assays in this study (ranked from highest to lowest sensitivity as follows: UK, PL, GER, ARG, and BE).
Since the detection ability of each assay and, consequently, the level of agreement among assays might also be influenced by the number of BLV proviral copies present in each sample (8), we compared the levels of proviral DNA from samples that gave concordant and discordant results. This analysis showed that samples that gave dis-cordant results had significantly lower numbers of BLV copies than samples that gave concordant results. In relation to this observation, the high proportion (31%) of samples with low BLV proviral loads (⬍20 copies 100 ng⫺1) might have accounted for the level
on May 16, 2020 by guest
http://jcm.asm.org/
of disagreement among the different assays, but because such samples (with low proviral loads) are frequently observed in surveillance programs, both from hyperacute infection and from chronic asymptomatic infection, they were included in the panel.
When the numbers of copies of proviral DNA detected by the different assays were compared, we observed that the ability to quantify proviral DNA differed among the six laboratories. However, despite statistically significant differences in the distribution of copy numbers, a moderate correlation among different assays was found. It has been demonstrated that protocol variations can increase interlaboratory variability consid-erably (14–17). In this regard, the different reagents (i.e., master mix, oligonucleotides, etc.) and calibrators (standard curve) used have been acknowledged to be major contributors to this variability. In this study, except for PL and UK, which shared most of the reagents and protocols, each laboratory performed particular qPCR protocols. The variation in the methods used by different laboratories in this study might have generated inconsistencies regarding the estimation of the number of copies of BLV proviral DNA among them.
Since BLV is a global problem, harmonization across diagnostic laboratories world-wide is a key requirement, and studies such as this are the first step toward gaining the ability to compare surveillance data globally. To this end, this first interlaboratory qPCR trial has highlighted the issues described above, some of which need to be explored and addressed further. As can be seen from the results, additional efforts are required to ensure that all laboratories are able detect low viral loads in samples. Through the sharing of protocols, the factors that may lead to the variation in detection may be elucidated. To an extent, the unification of protocols and standards is an option, but the laboratory setup and the availability of resources and reagents at each testing labora-tory must be kept in mind. While it may not be feasible for all laboratories to follow identical protocols, small adjustments that fit with existing methodologies may im-prove detection capabilities (e.g., the addition of a probe to an existing SYBR assay). In order to monitor detection capabilities, it is important that this be a continuous rather than a one-time effort. To support this objective, attempts will be made to obtain more geographically diverse DNA panels for testing and to extend the number of laboratories included in the trial.
SUPPLEMENTAL MATERIAL
Supplemental material for this article may be found athttps://doi.org/10.1128/JCM .00304-18.
SUPPLEMENTAL FILE 1,PDF file, 0.2 MB.
ACKNOWLEDGMENTS
We acknowledge Anton Gerilovych, National Scientific Center, Institute of Experi-mental and Clinical Veterinary Medicine, Kharkov, Ukraine; Maxim Petropavlovskiy, Urals State Scientific Research Institute of Veterinary Medicine, Ekaterinburg, Russia; Svetlana Balov, Republican Center for Veterinary Diagnostic, Chisinau, Moldova; and Roman Moskalik, Scientific and Practical Institute for Biotechnologies in Zootechnics and Veterinary Medicine, Chisinau, Moldova, for sharing material.
Funding was provided by the KNOW (Leading National Research Centre) Scientific Consortium, “Healthy Animal—Safe Food,” decision of Ministry of Science and Higher Education 05-1/KNOW2/2015 (to J.K.), the Department for Environment, Food and Rural Affairs: Maintaining the Enzootic Bovine Leukosis Disease-Free Status in Great Britain (to B.C.), and the Fonds National de la Recherche Scientifique (FNRS), Télévie and Inter-university Attraction Poles (IAP) Program, “Virus-Host Interplay at the Early Phases of Infection” (BELVIR), initiated by the Belgian Science Policy Office (to L.W.). This work was also funded by the Instituto Nacional de Tecnología Agropecuaria (INTA) and the Consejo Nacional de Investigaciones Científicas y Técnicas (CONICET), Argentina (to H.A.C., I.A., J.P.J., and K.G.T.).
We declare no competing financial interest.
on May 16, 2020 by guest
http://jcm.asm.org/
REFERENCES
1. Ghysdael J, Bruck C, Kettmann R, Burny A. 1984. Bovine leukemia virus. Curr Top Microbiol Immunol 112:1–19.
2. Gillet N, Florins A, Boxus M, Burteau C, Nigro A, Vandermeers F, Balon H, Bouzar AB, Defoiche J, Burny A, Reichert M, Kettmann R, Willems L. 2007. Mechanisms of leukemogenesis induced by bovine leukemia virus: pros-pects for novel anti-retroviral therapies in human. Retrovirology 4:18.
https://doi.org/10.1186/1742-4690-4-18.
3. Frie MC, Coussens PM. 2015. Bovine leukemia virus: a major silent threat to proper immune responses in cattle. Vet Immunol Immunopathol 163:103–114.https://doi.org/10.1016/j.vetimm.2014.11.014.
4. OIE. 2012. Manual of diagnostic tests and vaccines for terrestrial animals, Chapter 2.4.11, p 721–732. OIE, Paris, France.
5. Heenemann K, Lapp S, Teifke JP, Fichtner D, Mettenleiter TC, Vahlen-kamp TW. 2012. Development of a bovine leukemia virus polymerase gene-based real-time polymerase chain reaction and comparison with an envelope gene-based assay. J Vet Diagn Invest 24:649 – 655.https:// doi.org/10.1177/1040638712447524.
6. Lew AE, Bock RE, Molloy JB, Minchin CM, Robinson SJ, Steer P. 2004. Sensitive and specific detection of proviral bovine leukemia virus by 5=
Taq nuclease PCR using a 3=minor groove binder fluorogenic probe. J Virol Methods 115:167–175. https://doi.org/10.1016/j.jviromet.2003.09 .029.
7. Rola-Łuszczak M, Finnegan C, Olech M, Choudhury B, Kuzmak J. 2013. Development of an improved real time PCR for the detection of bovine leukaemia provirus nucleic acid and its use in the clarification of incon-clusive serological test results. J Virol Methods 189:258 –264.https://doi .org/10.1016/j.jviromet.2013.02.014.
8. Juliarena MA, Gutierrez SE, Ceriani C. 2007. Determination of proviral load in bovine leukemia virus-infected cattle with and without lympho-cytosis. Am J Vet Res 68:1220 –1225.https://doi.org/10.2460/ajvr.68.11 .1220.
9. Takeshima SN, Sasaki S, Meripet P, Sugimoto Y, Aida Y. 2017. Single nucleotide polymorphisms in the bovine MHC region of Japanese Black cattle are associated with bovine leukemia virus proviral load. Retrovi-rology 14:24.https://doi.org/10.1186/s12977-017-0348-3.
10. Lorenz RJ, Straub OC. 1994. The problem of recurrence of enzootic bovine leukosis in previously cured herds. Dtsch Tierarztl Wochenschr 101:158 –162. (In German.)
11. Martin D, Arjona A, Soto I, Barquero N, Viana M, Gomez-Lucia E. 2001. Comparative study of PCR as a direct assay and ELISA and AGID as indirect assays for the detection of bovine leukaemia virus. J Vet Med B Infect Dis Vet Public Health 48:97–106.https://doi.org/10.1111/j.1439 -0450.2001.00424.x.
12. Debacq C, Sanchez Alcaraz MT, Mortreux F, Kerkhofs P, Kettmann R, Willems L. 2004. Reduced proviral loads during primo-infection of sheep by bovine leukemia virus attenuated mutants. Retrovirology 1:31.
https://doi.org/10.1186/1742-4690-1-31.
13. Kuckleburg CJ, Chase CC, Nelson EA, Marras SA, Dammen MA, Christopher-Hennings J. 2003. Detection of bovine leukemia virus in blood and milk by nested and real-time polymerase chain reactions. J Vet Diagn Invest 15: 72–76.https://doi.org/10.1177/104063870301500117.
14. Le QT, Zhang Q, Cao H, Cheng AJ, Pinsky BA, Hong RL, Chang JT, Wang CW, Tsao KC, Lo YD, Lee N, Ang KK, Chan AT, Chan KC. 2013. An international collaboration to harmonize the quantitative plasma Epstein-Barr virus DNA assay for future biomarker-guided trials in naso-pharyngeal carcinoma. Clin Cancer Res 19:2208 –2215.https://doi.org/ 10.1158/1078-0432.CCR-12-3702.
15. Robardet E, Picard-Meyer E, Andrieu S, Servat A, Cliquet F. 2011. Inter-national interlaboratory trials on rabies diagnosis: an overview of results and variation in reference diagnosis techniques (fluorescent antibody test, rabies tissue culture infection test, mouse inoculation test) and molecular biology techniques. J Virol Methods 177:15–25.https://doi .org/10.1016/j.jviromet.2011.06.004.
16. Jones RM, Hertwig S, Pitman J, Vipond R, Aspan A, Bolske G, McCaughey C, McKenna JP, van Rotterdam BJ, de Bruin A, Ruuls R, Buijs R, Roest HJ, Sawyer J. 2011. Interlaboratory comparison of real-time polymerase
chain reaction methods to detect Coxiella burnetii, the causative agent of Q fever. J Vet Diagn Invest 23:108 –111. https://doi.org/10.1177/ 104063871102300118.
17. Muyldermans G, Debaisieux L, Fransen K, Marissens D, Miller K, Vaira D, Vandamme AM, Vandenbroucke AT, Verhofstede C, Schuurman R, Zissis G, Lauwers S. 2000. Blinded, multicenter quality control study for the quantification of human immunodeficiency virus type 1 RNA in plasma by the Belgian AIDS reference laboratories. Clin Microbiol Infect 6:213–217.https://doi.org/10.1046/j.1469-0691.2000.00048.x.
18. Somura Y, Sugiyama E, Fujikawa H, Murakami K. 2014. Comparison of the copy numbers of bovine leukemia virus in the lymph nodes of cattle with enzootic bovine leukosis and cattle with latent infection. Arch Virol 159:2693–2697.https://doi.org/10.1007/s00705-014-2137-9.
19. Meade KG, Gormley E, Doyle MB, Fitzsimons T, O’Farrelly C, Costello E, Keane J, Zhao Y, MacHugh DE. 2007. Innate gene repression associated with Mycobacterium bovis infection in cattle: toward a gene signature of disease. BMC Genomics 8:400.https://doi.org/10.1186/1471-2164-8-400. 20. Gillet NA, Hamaidia M, de Brogniez A, Gutierrez G, Renotte N, Reichert M, Trono K, Willems L. 2016. Bovine leukemia virus small noncoding RNAs are functional elements that regulate replication and contribute to oncogenesis in vivo. PLoS Pathog 12:e1005588.https://doi.org/10.1371/ journal.ppat.1005588.
21. Katoh K, Standley DM. 2013. MAFFT multiple sequence alignment soft-ware version 7: improvements in performance and usability. Mol Biol Evol 30:772–780.https://doi.org/10.1093/molbev/mst010.
22. Lefort V, Longueville JE, Gascuel O. 2017. SMS: smart model selection in PhyML. Mol Biol Evol 34:2422–2424. https://doi.org/10.1093/molbev/ msx149.
23. Guindon S, Dufayard JF, Lefort V, Anisimova M, Hordijk W, Gascuel O. 2010. New algorithms and methods to estimate maximum-likelihood phylogenies: assessing the performance of PhyML 3.0. Syst Biol 59: 307–321.https://doi.org/10.1093/sysbio/syq010.
24. Kumar S, Stecher G, Tamura K. 2016. MEGA7: Molecular Evolutionary Genetics Analysis version 7.0 for bigger datasets. Mol Biol Evol 33: 1870 –1874.https://doi.org/10.1093/molbev/msw054.
25. Humphreys I, Fleming V, Fabris P, Parker J, Schulenberg B, Brown A, Demetriou C, Gaudieri S, Pfafferott K, Lucas M, Collier J, Huang KH, Pybus OG, Klenerman P, Barnes E. 2009. Full-length characterization of hepa-titis C virus subtype 3a reveals novel hypervariable regions under pos-itive selection during acute infection. J Virol 83:11456 –11466.https:// doi.org/10.1128/JVI.00884-09.
26. Mirsky ML, Olmstead CA, Da Y, Lewin HA. 1996. The prevalence of proviral bovine leukemia virus in peripheral blood mononuclear cells at two subclinical stages of infection. J Virol 70:2178 –2183.
27. Eaves FW, Molloy JB, Dimmock CK, Eaves LE. 1994. A field evaluation of the polymerase chain reaction procedure for the detection of bovine leukaemia virus proviral DNA in cattle. Vet Microbiol 39:313–321.https:// doi.org/10.1016/0378-1135(94)90167-8.
28. Juliarena MA, Barrios CN, Ceriani MC, Esteban EN. 2016. Bovine leukemia virus (BLV)-infected cows with low proviral load are not a source of infection for BLV-free cattle. J Dairy Sci 99:4586 – 4589.https://doi.org/ 10.3168/jds.2015-10480.
29. Yuan Y, Kitamura-Muramatsu Y, Saito S, Ishizaki H, Nakano M, Haga S, Matoba K, Ohno A, Murakami H, Takeshima SN, Aida Y. 2015. Detection of the BLV provirus from nasal secretion and saliva samples using BLV-CoCoMo-qPCR-2: comparison with blood samples from the same cattle. Virus Res 210:248 –254.https://doi.org/10.1016/j.virusres.2015.08 .013.
30. McHugh ML. 2012. Interrater reliability: the kappa statistic. Biochem Med (Zagreb) 22:276 –282.https://doi.org/10.11613/BM.2012.031.
31. Dube S, Bachman S, Spicer T, Love J, Choi D, Esteban E, Ferrer JF, Poiesz BJ. 1997. Degenerate and specific PCR assays for the detection of bovine leukaemia virus and primate T cell leukaemia/lymphoma virus pol DNA and RNA: phylogenetic comparisons of amplified sequences from cattle and primates from around the world. J Gen Virol 78(Part 6):1389 –1398.
https://doi.org/10.1099/0022-1317-78-6-1389.