CO RR ESP O N DENC E
Open Access
Revisit linear regression-based
deconvolution methods for tumor gene
expression data
Bo Li
1,2, Jun S. Liu
2*and X. Shirley Liu
1*Please see related Newman et al. correspondence: www.dx.doi.org/10.1186/s13059-017-1257-4 and Zheng correspondence: www.dx.doi.org/10.1186/s13059-017-1258-3
We have recently published a statistical deconvolution method to study infiltrating immune cells using tumor RNA-seq data [1]. One of the goals in that work was to understand how proportions of different cell types co-vary across different cancer tissues. To this end, we esti-mated the abundance of six cell types over 9000 tumor samples across 23 cancer types, and then assessed the correlations of these estimated proportions across the different samples within a cancer type. In particular we compared our method (TIMER) with CIBERSORT [2], a previously published deconvolution approach, for their ability to assess such correlations. To our surprise, we found many non-biological negative correlations be-tween CIBERSORT estimates, and we believed that this artifact was, to a large extent, due to the incorporation of highly similar features in the linear model, or statis-tical collinearity. Newman et al., the authors of CIBER-SORT, have raised concerns that these correlations were due to data normalization, instead of collinearity [3]. While we agree with Newman and coauthors that the forced normalization indeed introduces unwanted nega-tive correlations, we will show in this response that the inclusion of highly similar features contributes as signifi-cantly as normalization, if not more, to the observed artificial negative correlations among the estimates obtained by CIBERSORT.
Highly correlated features (covariates) in linear regres-sion models can lead to many technical difficulties, such as high estimation variances, robustness, and non-identifiability. Furthermore, it is often misleading to
interpret their coefficients at their face value. For example, it is very easy to create examples where when only one of the two highly similar features is included in a regression model, its coefficient is highly significant and positive; whereas when both are included, none of the coefficients is significant or one is positively significant and the other is negative. This issue is a fundamental statistical problem due to lack of information and is unlikely to be solved simply by regularization employed by the CIBERSORT method.
To evaluate how CIBERSORT estimations are affected by the incorporation of similar features, we conducted two in silico experiments. In the first one, we selected two unrelated cell types, CD8 T cells and neutrophils, from the CIBERSORT feature set, LM22 matrix. The Pearson correlation of the expression levels of the two cell types is 0.009. We generated 500 mixtures by randomly apportioning the population consisting of these two cell types only:Y= Yi, i = 1,2,…500, where:
Yi¼f 1;i X1 þ f 2;i X2 þ εi
with εi following the normal distribution with mean 0 and the same standard deviation as X1. Coefficientsf1,i and f2,i follow Uniform(0,0.5), and X1 and X2 are re-spectively CD8 T cell and neutrophil gene expressions from the LM22 matrix. This approach is very similar to the procedure described in the CIBERSORT perform-ance evaluation “Analysis of multicollinearity” [2]. We applied CIBERSORT to estimate the fractions of all the 22 cell types, including CD8 T cells and neutrophils, with the simulated data (Fig. 1a, b). Althoughf1 and f2 were independently simulated, their corresponding CIBERSORT estimates were negatively correlated (r=– 0.4). Even when the true coefficients (f1,i,f2,i) were kept as fixed constants across the 500 replications, their esti-mates continued to show strong negative sampling * Correspondence:[email protected];[email protected]
2
Department of Statistics, Harvard University, 1 Oxford St, Cambridge, MA 02138, USA
1Department of Biostatistics and Computational Biology, Dana Farber Cancer
Institute, Harvard TH Chan School of Public Health, 450 Brookline Ave, Boston, MA 02215, USA
correlations. This phenomenon is understandable be-cause when one coefficient is estimated higher than its true underlying value, the other one is necessarily esti-mated lower due to normalization (fixed total sum at 1). This analysis sets the baseline for negative correlation resulting from data normalization in CIBERSORT.
In the second simulation, we replaced CD8 T cells and neutrophils with two highly correlated features: naïve and memory B cells. According to the LM22 matrix, the expression levels are highly correlated (r= 0.9). We per-formed the same simulation and used the online CIBER-SORT server to infer f1 and f2. The estimated fractions of the two cell types had even stronger negative correl-ation (r=–0.7; Fig. 1c, d). These results indicate that, in addition to data normalization, the incorporation of highly correlated features will exaggerate the non-biological negative correlations between the estimated coefficients.
In our manuscript [1], we mentioned that some im-mune subsets may respond to similar cytokines, but this
[image:2.595.61.539.88.436.2]Table 1Associations of CIBERSORT estimates for closely related features
Naive versus memory B cell (expected r = 0.7) Activated versus resting CD4 memory T cell (expected r = 0.3)
Glioblastoma r =−0.34⍴=−0.77 r =−0.05⍴=−0.06
Kidney renal clear cell carcinoma r =−0.07⍴=−0.29 r =−0.12⍴=−0.13
Lung squamous carcinoma r = 0.13⍴=−0.38 r =−0.26⍴=−0.19
Lung adenocarcinoma r =−0.07⍴=−0.37 r =−0.29⍴=−0.26
The expected correlations were obtained from Fig.1aand are given in the column headings. RNA-seq data of each cancer type were analyzed by the CIBERSORT online server to predict fractions of immune subsets. Pearson’srand Spearman’sρwere calculated between two pairs of closely related features: (1) naïve and memory B cells, and (2) activated and resting memory CD4 T cells.Red valuesindicate a negative association
[image:3.595.60.539.225.672.2]CIBERSORT found negative correlations for almost all the pairs of related cells in the cancers tested. These negative correlations contradict the experimental results reported in Newman et al. [3]. This result is likely due to the fact that naïve and memory B cells, and similarly active and resting CD4 T cells, have similar expression profiles and are thus difficult to distinguish due to collinearity.
The above analyses indicate that incorporating cells with similar features causes CIBERSORT to produce re-sults with non-biological associations.
Estimations from TIMER are proportional to the im-mune content in the tumor tissue. However, we explicitly emphasized in our manuscript [1] that TIMER estima-tions“are not comparable between cancer types or differ-ent immune cells,”but only comparable across individuals within a cancer type. This is because in TIMER each im-mune cell type is individually normalized according to the availability of the reference data [5]. The absolute scales of the estimates for different cell types within a tumor are non-biological. In the original manuscript [1], we did not make arguments regarding the estimation of the absolute proportion of a single cell type. Therefore, we are sur-prised by the claim by Newman et al. [3] that our method reported “disproportionately high levels of typically rare dendritic cells (DCs).”In their correspondence, Newman et al. [3] went ahead and normalized TIMER estimations and made a series of conclusions based on data normalization (Fig. 2d–h in [3]). We believe that these claims resulted from a misinterpretation of our method and data, because the normalization of the total infiltrates to sum to 1 does not apply to TIMER estimates. In addition, we were fully aware that TIMER estimates may correlate with total leukocyte levels (Fig. S3c in [1]). Therefore, in the downstream analyses, we used the partial Spearman correlation conditioning on tumor purity when-ever necessary to control for this factor.
Let us now revisit the statistical model in CIBERSORT, where the sample mixture is considered as a linear com-bination of reference features. In this model, gene expression in a tumor tissue sample is a mixture of dif-ferent immune subsets:
Yi
g ¼
X22
j¼1
fi
jXigþε
where i indicates the tumor sample, j indexes the im-mune cell type, and g stands for an LM22 gene, with constraints ∑j22= 1fji= 1 and fji≥0,for ∀i,j. An important hidden assumption of this model is that malignant cells in the tumor tissue do not express a significant amount of any of the LM22 genes, which have been selected a priori based on mRNA expression data profiled from
sorted immune cells. However, due to genome
instability, it is possible that malignant cells also ex-press immune-related genes.
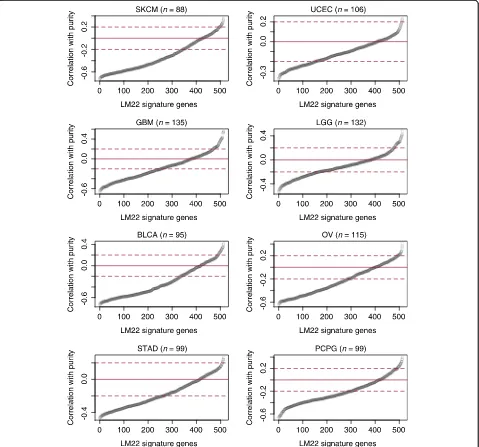
To examine if this is true, we analyzed the LM22 sig-nature genes using The Cancer Genome Atlas data. We found that, in multiple cancers, a substantial fraction of the 513 LM22 signature genes showed positive correla-tions with purity (Fig. 2). Such a correlation suggests that samples with higher tumor content express these genes at higher levels, indicating that these genes are also expressed in malignant cells. In their analysis, New-man et al. [2] in silico mixed colon cancer cell line expression data with immune subsets to show that CIBERSORT works for tumor tissues. In our analysis, we found that colon cancer expresses a very small num-ber of LM22 genes (n= 56), explaining why CIBERSORT may work well for this cancer type. However, given that up to a quarter of the LM22 genes are not immune-specific in many other cancer types, the model assumption of CIBERSORT is frequently violated. As a consequence, it is likely that the CIBERSORT inferences derived from these genes are confounded by cancer cell expression. This is a possible reason that CIBERSORT [6] failed to identify putative prognostic factors in these cancers, such as T cells in melanoma and ovarian cancer, or macro-phages in glioma.
Finally, we would like to re-emphasize that CIBERSORT and TIMER target different aspects of tumor immune infiltrates. CIBERSORT infers the relative fractions of immune subsets in the total leukocyte population, while TIMER predicts the abundance of immune cells in the overall tumor microenvironment. Currently both methods are limited by the assumption that transcriptomes of tumor-infiltrating immune cells do not significantly differ from those collected from peripheral blood of healthy donors. This is a convenient assumption based on practi-cality but may not hold for many tumors. Future deconvo-lution methods could continue to improve, with more studies profiling the tumor-infiltrating immune subsets or single-cell tumor transcriptomes to generate high-quality reference data.
Funding
This work is supported by NCI grant 1U01 CA180980.
Availability of data and materials
All simulation data generated from this work, including those used in Fig. 1 and Table 1, are available at http://www.cistrome.org/TIMER/download.html.
Authors’contributions
BL performed the analysis and wrote the responses. JSL and XSL supervised this study. All authors read and approved the final manuscript.
Authors’information
BL is a postdoctoral research fellow. Both JSL and XSL are tenured professors at Harvard University.
Competing interests
Publisher’s Note
Springer Nature remains neutral with regard to jurisdictional claims in published maps and institutional affiliations.
Received: 26 May 2017 Accepted: 12 June 2017
References
1. Li B, Severson E, Pignon JC, Zhao H, Li T, Novak J, et al. Comprehensive analyses of tumor immunity: implications for cancer immunotherapy. Genome Biol. 2016;17(1):174. doi:10.1186/s13059-016-1028-7. 2. Newman AM, Liu CL, Green MR, Gentles AJ, Feng W, Xu Y, et al. Robust
enumeration of cell subsets from tissue expression profiles. Nat Methods. 2015;12(5):453–7. doi:10.1038/nmeth.3337.
3. Newman AM, Gentles AJ, Liu CL, Diehn M, Alizadeh AA. Data normalization considerations for digital tumor dissection. Genome Biol. 2017. doi:10.1186/ s13059-017-1257-4.
4. Nagorsen D, Voigt S, Berg E, Stein H, Thiel E, Loddenkemper C. Tumor-infiltrating macrophages and dendritic cells in human colorectal cancer: relation to local regulatory T cells, systemic T-cell response against tumor-associated antigens and survival. J Transl Med. 2007;5:62. doi:10.1186/1479-5876-5-62.
5. Mabbott NA, Baillie JK, Brown H, Freeman TC, Hume DA. An expression atlas of human primary cells: inference of gene function from coexpression networks. BMC Genomics. 2013;14:632. doi:10.1186/1471-2164-14-632. 6. Gentles AJ, Newman AM, Liu CL, Bratman SV, Feng W, Kim D, et al. The
prognostic landscape of genes and infiltrating immune cells across human cancers. Nat Med. 2015;21(8):938–45. doi:10.1038/nm.3909.
• We accept pre-submission inquiries
• Our selector tool helps you to find the most relevant journal
• We provide round the clock customer support
• Convenient online submission
• Thorough peer review
• Inclusion in PubMed and all major indexing services
• Maximum visibility for your research
Submit your manuscript at www.biomedcentral.com/submit