Open Access
Vol 13 No 5Research
Brachial artery peak velocity variation to predict fluid
responsiveness in mechanically ventilated patients
Manuel Ignacio Monge García, Anselmo Gil Cano and Juan Carlos Díaz Monrové
Servicio de Cuidados Críticos y Urgencias, Unidad de Investigación Experimental, Hospital del SAS Jerez, C/Circunvalación s/n, 11407, Jerez de la Frontera, Spain
Corresponding author: Manuel Ignacio Monge García, ignaciomonge@gmail.com
Received: 22 May 2009 Revisions requested: 25 Jun 2009 Revisions received: 6 Jul 2009 Accepted: 3 Sep 2009 Published: 3 Sep 2009
Critical Care 2009, 13:R142 (doi:10.1186/cc8027)
This article is online at: http://ccforum.com/content/13/5/R142 © 2009 Monge García et al.; licensee BioMed Central Ltd.
This is an open access article distributed under the terms of the Creative Commons Attribution License (http://creativecommons.org/licenses/by/2.0), which permits unrestricted use, distribution, and reproduction in any medium, provided the original work is properly cited.
Abstract
Introduction Although several parameters have been proposed to predict the hemodynamic response to fluid expansion in critically ill patients, most of them are invasive or require the use of special monitoring devices. The aim of this study is to determine whether noninvasive evaluation of respiratory variation of brachial artery peak velocity flow measured using Doppler ultrasound could predict fluid responsiveness in mechanically ventilated patients.
Methods We conducted a prospective clinical research in a 17-bed multidisciplinary ICU and included 38 mechanically ventilated patients for whom fluid administration was planned due to the presence of acute circulatory failure. Volume expansion (VE) was performed with 500 mL of a synthetic colloid. Patients were classified as responders if stroke volume index (SVi) increased ≥ 15% after VE. The respiratory variation in Vpeakbrach (ΔVpeakbrach) was calculated as the difference between maximum and minimum values of Vpeakbrach over a single respiratory cycle, divided by the mean of the two values and expressed as a percentage. Radial arterial pressure
variation (ΔPPrad) and stroke volume variation measured using the FloTrac/Vigileo system (ΔSVVigileo), were also calculated.
Results VE increased SVi by ≥ 15% in 19 patients (responders). At baseline, ΔVpeakbrach, ΔPPrad and ΔSVVigileo were significantly higher in responder than nonresponder patients [14 vs 8%; 18 vs. 5%; 13 vs 8%; P < 0.0001, respectively). A ΔVpeakbrach value >10% predicted fluid responsiveness with a sensitivity of 74% and a specificity of 95%. A ΔPPrad value >10% and a ΔSVVigileo >11% predicted volume responsiveness with a sensitivity of 95% and 79%, and a specificity of 95% and 89%, respectively.
Conclusions Respiratory variations in brachial artery peak velocity could be a feasible tool for the noninvasive assessment of fluid responsiveness in patients with mechanical ventilatory support and acute circulatory failure.
Trial RegistrationClinicalTrials.gov ID: NCT00890071
Introduction
Traditional indices of cardiac preload, such as intracardiac pressures or telediastolic volumes, have been consistently sur-passed by dynamic parameters to detect fluid responsiveness in critically ill patients [1,2]. The magnitude of cyclic changes in left ventricular (LV) stroke volume due to intermittent posi-tive-pressure ventilation have been demonstrated to accu-rately reflect preload-dependence in mechanically ventilated
patients [3]. So, the greater the respiratory changes in LV stroke volume, the greater the expected increase in stroke vol-ume after fluid administration.
By increasing intrathoracic pressure and lung volume, mechanical insufflation raises both pleural and transpulmonary pressure, decreasing the pressure gradient for venous return and increasing right ventricular (RV) afterload. According to
the Frank-Starling relationship, if both ventricles remain sensi-tive to changes in preload, RV stroke volume, and therefore LV preload, should decrease during positive-pressure inspiration, diminishing LV stroke volume after a few beats (normally dur-ing expiration). On the otherhand, if any of the ventricles are unaffected by cyclic variations of preload, LV stroke volume should be unaltered by swings in intrathoracic pressure. Therefore, the degree of respiratory variations in LV stroke vol-ume could be used to reveal the susceptibility of the heart to changes in preload induced by mechanical insufflation [3].
In this regard, several surrogate measurements of LV stroke volume have been proposed to determine the preload-dependence status of a patient, such as pulse pressure tion [4], stroke volume variation [5] or aortic blood flow varia-tion [6]. However, the acquisivaria-tion of these parameters usually requires an invasive catheterization or a skilled echocardio-graphic evaluation to obtain an accurate interpretation of data, limiting their applicability because of the need for specialized training and equipment.
Recently, Brennan and colleagues [7], using a hand-carried Doppler ultrasound at the bedside, demonstrated that respira-tory variations in brachial artery peak velocity (ΔVpeakbrach), measured by clinicians with minimal ultrasound expertise, were closely correlated with radial artery pulse pressure varia-tions (ΔPPrad), a well-known parameter of fluid responsive-ness. Moreover, a ΔVpeakbrach value of 16% or more was highly predictive of a ΔPPrad of 13% or more (the usual ΔPPrad threshold value for discrimination between fluid responder and nonresponder patients), so ΔVpeakbrach could be used as a noninvasive surrogate of LV stroke volume variation for assess-ing preload dependence in patients receivassess-ing controlled mechanical ventilation. However, the predictive value of this indicator was not tested performing a volume challenge and checking the effects on cardiac output (CO) or stroke volume. Thus, although promising, further studies are required before validating this parameter and recommending it for its clinical use [8].
Therefore, we designed the current study to confirm the pre-dictive value of the ΔVpeakbrach for predicting fluid responsive-ness in mechanically ventilated patients with acute circulatory failure.
Materials and methods
This study was approved by the Institutional Ethics Committee of the Jerez Hospital of the Andalusian Health Service and endorsed by the Scientific Committee of the Spanish Society of Intensive Care, Critical and Coronary Units. Written informed consent was obtained from each patient's next of kin.
Patients
The inclusion criteria were patients with controlled mechanical ventilation, equipped with an indwelling radial artery catheter
and for whom the decision to give fluids was taken due to the presence of one or more clinical signs of acute circulatory fail-ure, defined as a systolic blood pressure of less than 90 mmHg (or a decrease of more than 50 mmHg in previously hypertensive patients) or the need for vasopressor drugs; the presence of oliguria (urine output <0.5 ml/kg/min for at least two hours); the presence of tachycardia; a delayed capillary refilling; or the presence of skin mottling. Contraindication for the volume administration was based on the evidence of fluid overload and/or hydrostatic pulmonary edema. Patients with unstable cardiac rhythm were also excluded.
Arterial pulse pressure variation
Radial arterial pressure was recorded online on a laptop com-puter at a sampling rate of 300 Hz using proprietary data-acquisition software (S/5 Collect software, version 4.0; Datex-Ohmeda, Helsinki, Finland) for further off-line analysis (QtiPlot software, version 0.9.7.6 [9].
ΔPPrad was defined according to the formula:
where PPmax and PPmin are the maximum and minimum pulse pressures determined during a single respiratory cycle, respectively [10]. The average of three consecutive determina-tions was used to calculate ΔPPrad for statistical analysis.
Respiratory variation in brachial artery blood velocity The brachial artery blood velocity signal was obtained using a Doppler ultrasound scanner (Vivid 3, General Electric, Wauke-sha, WI, USA), equipped with a 4 to 10 MHz flat linear array transducer. With the patient in the supine position, the trans-ducer was placed over a slightly abducted arm, opposite to the indwelling radial artery catheter and 5 to 10 cm above the antecubital fossa. After confirmed correct placement and artery pulse quality by Doppler ultrasound, the transducer was rotated to acquire the transversal image of the artery. Angle Doppler was adjusted to ensure a less than 60° angle for the accurate determination of Doppler shift and blood flow veloc-ity. The velocity waveform was recorded from the midstream of the vessel lumen and the sample volume was adjusted to cover the center of the arterial vessel, in order to obtain a clear Doppler blood velocity trace. Brachial flow velocity was regis-tered simultaneously to the radial arterial pressure for at least one minute.
The ΔVpeakbrach was calculated on-line using built-in software as:
where Vpeakmax and Vpeakmin are the maximum and the mini-mum peak systolic velocities during a respiratory cycle, ΔPPrad(% )=100×(PPm ax−PPm in)/((PPm ax+PPm in)/ ))2
respectively. The mean values of the three consecutive deter-minations were used for statistical analysis.
The intraobserver reproducibility was determined for Δ
Vpeak-brach measurements using Bland-Altman test analysis in all tar-get patients over a one-minute period, and described as mean bias ± limits of agreements.
Cardiac output and stroke volume variation measurements
A FloTrac sensor (Edwards Lifesciences LLC, Irvine, CA, USA) was connected to the arterial line and attached to the Vigileo monitor, software version 1.10 (Edwards Lifesciences LLC, Irvine, CA, USA). Briefly, the CO was calculated from the real-time analysis of the arterial waveform over a period of 20 seconds at a sample rate of 100 Hz without prior external cal-ibration, using a proprietary algorithm based on the relation between the arterial pulse pressure and stroke volume. Arterial compliance and vascular resistance contribution was esti-mated every minute based on individual patient demographic data (age, gender, body weight and height) and the arterial waveform analysis, respectively. Stroke volume variation (Δ
SV-Vigileo) was assessed by the system as follows:
A time interval of 20 seconds was used by the algorithm to cal-culate SVmean and ΔSVVigileo [11].
After zeroing the system against atmosphere, the arterial waveform signal fidelity was checked using the square wave test and hemodynamic measurements were initiated. CO, stroke volume and ΔSVVigileo values were obtained by an inde-pendent physician and averaged as the mean of three consec-utive measurements. The Doppler operator was unaware of the Vigileo monitor measurements.
Study protocol
All the patients were ventilated in controlled-volume mode (Puritan Bennett 840 ventilator, Tyco, Mansfield, MA, USA) and temporally paralyzed (vecuronium bromide 0,1 mg/Kg) if spontaneous inspiratory efforts were detected on the airway pressure curve displayed on the respiratory monitor. Support-ive therapies, ventilatory settings and vasopressor therapy were kept unchanged throughout the study time. A first set of hemodynamic measurements was obtained at baseline and after volume expansion (VE), consisting of 500 ml of synthetic colloid (Voluven®, hydroxyethylstarch 6%; Fresenius, Bad Homburg, Germany) infused over 30 minutes.
Statistical analysis
Non-parametric tests were applied as data were not normally distributed. Results are expressed as median and interquartile range (25th to 75th percentiles). Patients were classified according to stroke volume index (SVi) increase after VE in
responders (≥15%) and nonresponders (<15%), respectively [10]. The effects of VE on hemodynamic parameters were assessed using the Wilcoxon rank sum test. Differences between responder and nonresponder patients were estab-lished by the Mann-Whitney U test. The rate of vasopressor treatment was compared between responder and nonre-sponder patients using the chi-squared test. The relations between variables were analyzed using a linear regression method. The area under the receiver operating characteristic (ROC) curves for ΔVpeakbrach, ΔPPrad, ΔSVVigileo and central venous pressure (CVP) according to fluid expansion response were calculated and compared using the Hanley-McNeil test. ROC curves are presented as area ± standard error (95% confidence interval (CI)). A P value less than 0.05 was consid-ered statistically significant. Statistical analyses were per-formed using MedCalc for Windows, version 10.3.4.0 (MedCalc Software, Mariakerke, Belgium).
Results
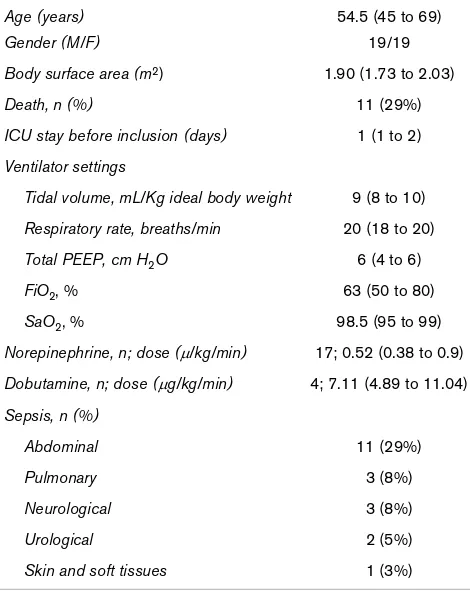
Thirty-eight patients were included in the study, 19 of them with an increased SVi of 15% or higher (responders). The main characteristics of the studied population are summarized in Table 1. The vasoactive rate was not different between
ΔSCVigileo(%)=100×(SVmax−SVmin) /SVmean Table 1
Characteristics and demographics data of t population (n = 38)
Age (years) 54.5 (45 to 69)
Gender (M/F) 19/19
Body surface area (m2) 1.90 (1.73 to 2.03)
Death, n (%) 11 (29%)
ICU stay before inclusion (days) 1 (1 to 2)
Ventilator settings
Tidal volume, mL/Kg ideal body weight 9 (8 to 10)
Respiratory rate, breaths/min 20 (18 to 20)
Total PEEP, cm H2O 6 (4 to 6)
FiO2, % 63 (50 to 80)
SaO2, % 98.5 (95 to 99)
Norepinephrine, n; dose (μ/kg/min) 17; 0.52 (0.38 to 0.9)
Dobutamine, n; dose (μg/kg/min) 4; 7.11 (4.89 to 11.04)
Sepsis, n (%)
Abdominal 11 (29%)
Pulmonary 3 (8%)
Neurological 3 (8%)
Urological 2 (5%)
Skin and soft tissues 1 (3%)
[image:3.612.317.552.398.694.2]responders and nonresponders. Neither tidal volume nor pos-itive end-expiratory pressure (PEEP) was significantly different between both groups. Volume expansion was performed according to the presence of hypotension (n = 19; 50%), olig-uria (n = 29; 76%), tachycardia (n = 18; 47%), delayed capil-lary refilling (n = 7; 18%) and mottled skin (n = 2; 5%). The intraobserver variability in ΔVpeakbrach measurement was -1 ± 6.68.
Hemodynamic response to volume expansion
Hemodynamic parameters before and after VE are displayed in Table 2. In the whole population, VE induced a significant percentage gain in mean arterial pressure of 9.1% (3.3 to 19%), cardiac index by 10% (2.1 to 20.1%), SVi by 29% (20.4 to 37.5%) and CVP by 60% (28.5 to 72%).
Effects of VE on dynamic parameters of preload
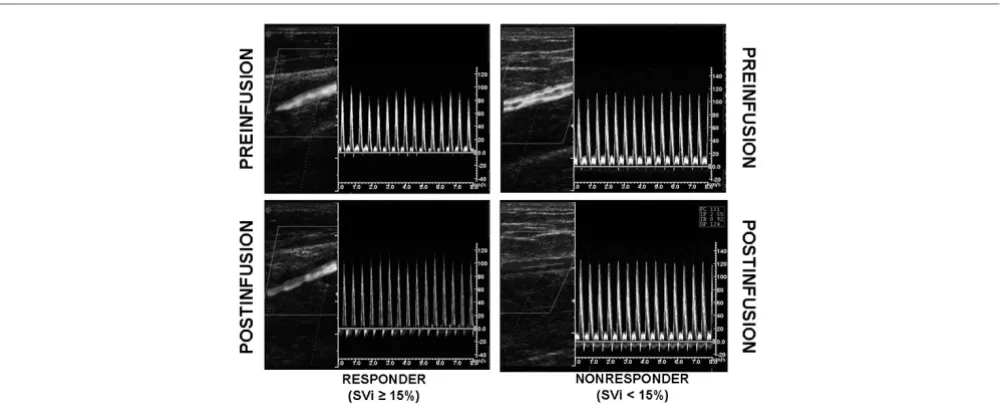
[image:4.612.59.532.293.693.2]The effects of VE on dynamic parameters of preload are sum-marized in Table 3. Individual values are displayed in Figure 1. At baseline, dynamic parameters did not differ between patients treated with norepinephrine and without vasopressor support. Volume loading was associated with a significant decrease in ΔVpeakbrach (3%, 1 to 6; P < 0.0001), ΔPPrad (4%, 2 to 11; P < 0.0001) and ΔSVVigileo (3%, 1 to 6; P < 0.0001) in both groups. An example of effects of VE in ΔVpeakbrach in one responder patient and other nonresponder is shown in Figure 2.
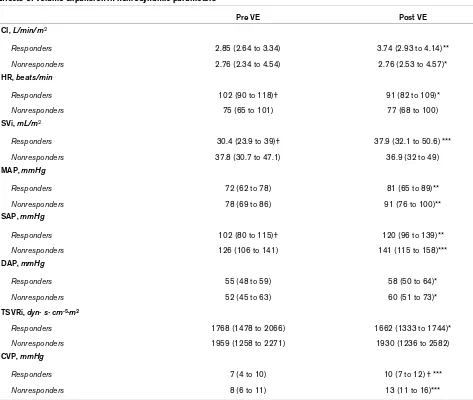
Table 2
Effects of volume expansion in hemodynamic parameters
Pre VE Post VE
CI, L/min/m2
Responders 2.85 (2.64 to 3.34) 3.74 (2.93 to 4.14)**
Nonresponders 2.76 (2.34 to 4.54) 2.76 (2.53 to 4.57)*
HR, beats/min
Responders 102 (90 to 118)† 91 (82 to 109)*
Nonresponders 75 (65 to 101) 77 (68 to 100)
SVi, mL/m2
Responders 30.4 (23.9 to 39)† 37.9 (32.1 to 50.6) ***
Nonresponders 37.8 (30.7 to 47.1) 36.9 (32 to 49)
MAP, mmHg
Responders 72 (62 to 78) 81 (65 to 89)**
Nonresponders 78 (69 to 86) 91 (76 to 100)**
SAP, mmHg
Responders 102 (80 to 115)† 120 (96 to 139)**
Nonresponders 126 (106 to 141) 141 (115 to 158)***
DAP, mmHg
Responders 55 (48 to 59) 58 (50 to 64)*
Nonresponders 52 (45 to 63) 60 (51 to 73)*
TSVRi, dyn· s· cm-5·m2
Responders 1768 (1478 to 2066) 1662 (1333 to 1744)*
Nonresponders 1959 (1258 to 2271) 1930 (1236 to 2582)
CVP, mmHg
Responders 7 (4 to 10) 10 (7 to 12) † ***
Nonresponders 8 (6 to 11) 13 (11 to 16)***
Data are expressed as median with interquartile range (25th to 75th percentiles). * P < 0.05, ** P < 0.001, *** P < 0.0001 post VE vs pre VE; † P < 0.05 responders vs nonresponders.
Dynamic parameters to quantify the hemodynamic effects of VE
At baseline, both ΔVpeakbrach and ΔPPrad were positively cor-related with VE-induced change in SVi (r2 = 0.56 and r2 = 0.71; P < 0.0001, respectively). ΔSVVigileo was also correlated, although less strongly (r2 = 0.32; P < 0.001). Therefore, the greater the respiratory variation in brachial artery peak velocity,
[image:5.612.59.550.91.265.2]arterial pulse pressure or stroke volume, the greater the expected SVi increase after fluid administration. The VE-induced change in ΔVpeakbrach and ΔPPrad were correlated with VE change in SVi (r2 = 0.58 and r2 = 0.56; P < 0.0001, respectively), although weakly for ΔSVVigileo (r2 = 0.12, P < 0.05). So a decrease in ΔVpeakbrach value after VE could be Figure 1
Comparison of different dynamic indices of preload
Comparison of different dynamic indices of preload. Box-and-whisker plots and individual values (open circles) of respiratory variations of brachial peak velocity (ΔVpeakbrach), radial arterial pulse pressure variation (ΔPPrad) and stroke volume variation measured using the FloTrac/Vigileo monitor-ing system (ΔSVVigileo) before volume expansion (VE), in responder (R, stroke volume index (SVi) ≥15% after VE) and nonresponder (NR, SVi <15% after VE) patients. The central box represents the values from the lower to upper quartile (25th to 75th percentile). The middle line represents the median. A line extends from the minimum to the maximum value.
Figure 2
Illustrative example of Doppler evaluation of brachial artery peak velocity variation in a responder patient and nonresponder patient
[image:5.612.57.561.442.646.2]used to indicate a successful increase in stroke volume by fluid administration.
Relationship between dynamic parameters of preload Before volume administration ΔVpeakbrach correlated with
ΔPPrad (r2 = 0.82; P < 0.0001) and ΔSV
Vigileo (r2 = 0.47; P < 0.0001). At baseline, ΔPPrad also correlated with ΔSVVigileo (r2 = 0.59; P < 0.0001). The VE-induced decreases in Δ
Vpeak-brach, ΔPPrad, Vpeakbrach, ΔSVVigileo, ΔPPrad and ΔSVVigileo were also significantly correlated (r2 = 0.71; P < 0.0001, r2 = 0.26;
P < 0.01 and r2 = 0.39; P < 0.0001; respectively).
Prediction of fluid responsiveness
The area under the ROC curves for baseline ΔVpeakbrach (0.88 ± 0.06; 95% CI 0.74 to 0.96), ΔPPrad (0.97 ± 0.03; 95% CI 0.86 to 0.99) and ΔSVVigileo (0.89 ± 0.06; 95% CI 0.75 to 0.97) was not significantly different (Figure 3). All dynamic parameters of preload were better predictors of fluid respon-siveness than CVP (area under the curve: 0.64 ± 0.09; 95% CI 0.47 to 0.79). A ΔVpeakbrach value of more than 10% pre-dicted fluid responsiveness with a sensitivity of 74% (95% CI 49 to 91%) and a specificity of 95% (95% CI 74 to 99%), with positive and negative predictive values of 93% and 78%, respectively. A ΔPPrad value of more than 10% and a ΔSVVigileo of more than 11% predicted volume responsiveness with a sensitivity of 95% (95% CI 74 to 99%) and 79% (95% CI 54 to 94%), and a specificity of 95% (95% CI 74 to 99%) and 89% (95% CI 67 to 97%), respectively.
Discussion
This study demonstrates that Doppler evaluation of the
[image:6.612.55.553.112.275.2]ΔVpeakbrach efficiently predicts the hemodynamic response to Table 3
Effects of volume expansion in dynamic parameters of preload (n = 38)
Pre VE Post VE
ΔPPrad, %
Responders 18.29 (15.66 to 24.42)†† 8.58 (4.59 to 12.05) † ***
Nonresponders 4.74 (2.32 to 6.95) 3.15 (0.96 to 5.24)*
ΔVpeakbrach, %
Responders 13.94 (9.88 to 18.83)†† 6.95 (5.29 to 9.38)***
Nonresponders 7.76 (6.24 to 8.29) 5.52 (4.38 to 7.66)*
ΔSVVigileo, %
Responders 13 (11.75 to 21.17)†† 9.33 (7.08 to 11.50) †† ***
Nonresponders 7.67 (6.75 to 9.5) 5.67 (4.67 to 6.59)**
Data are expressed as median with interquartile range (25th to 75th percentiles). * P < 0.05, ** P < 0.001, *** P < 0.0001 post VE vs pre VE. † P < 0.001, †† P = 0.0001 responders vs nonresponders.
ΔPPrad :radial artery pulse pressure variation; ΔSVVigileo :stroke volume variation measured with FloTrac/Vigileo® monitoring system; ΔVpeakbrach :brachial artery peak velocity variation; VE: volume expansion.
Figure 3
Comparison of receiver operating characteristics curves to discriminate fluid expansion responders and nonresponders
volume expansion in mechanically ventilated patients with acute circulatory failure.
Dynamic assessment of fluid responsiveness, unlike absolute measurements of preload, is based on the principle that chal-lenging the cardiovascular system to a reversible and transient change on preload, the magnitude of the induced variations in stroke volume or its surrogates are proportional to the preload-dependence status of a patient [12]. Swings in intrathoracic pressure during mechanical ventilation modulate LV stroke vol-ume by cyclically varying RV preload. As the main mechanism for reducing RV stroke volume (and hence LV filling) is imped-ing pressure gradient for venous return and RV preload [13], the increase in intrathoracic pressure will transiently reduce LV stroke output only if both the ventricles are operating in the steep part of the Frank-Starling curve. Therefore, phasic varia-tions of LV stroke volume induced by positive-pressure venti-lation could be used as an indicator of biventricular preload responsiveness in mechanically ventilated patients [14].
As direct measurement of LV stroke volume remains a compli-cated task at the bedside, different surrogate parameters have been proposed to assess the effects of mechanical ventilation in LV stroke volume for predicting volume responsiveness. In this regard respiratory variations on arterial pulse pressure [10] or the pulse contour-derived stroke volume variation [5,15] have been repeatedly demonstrated to accurately pre-dict fluid responsiveness in different settings and clinical situ-ations [4].
With echocardiography becoming more widely available in intensive care units and increasingly used in the management of hemodynamically unstable patients, the noninvasive assess-ment of preload dependence has logically aroused the interest of some authors. Feissel and colleagues [16] demonstrated that respiratory variations of aortic blood velocity, measured by transesophageal echocardiography at the level of the aortic annulus, was a more reliable parameter than a static index of preload such as LV end-diastolic area for predicting the hemo-dynamic response to VE in patients with septic shock. Simi-larly, Monnet and colleagues [6], measuring the descending aortic blood flow with an esophageal Doppler probe, reported that aortic blood flow variation and respiratory variation in aor-tic peak velocity were reliable indices for detecting fluid responsiveness and better predictors than the flow time cor-rected for heart rate, a static preload index provided by the esophageal Doppler. Moreover, in children receiving mechan-ical ventilation, Durand and colleagues [17], confirmed that the respiratory variation in aortic peak velocity measured by transthoracic pulsed-Doppler was superior to pulse pressure variation and systolic pressure variation for assessing cardiac preload reserve. Additionally, in two experimental studies, Slama and colleagues [18,19] analyzed the effects of control-led blood withdrawal and restitution in mechanically ventilated rabbits on the aortic velocity time integral, registered by
tran-sthoracic echocardiography, and the aortic blood flow veloc-ity, recorded by esophageal Doppler. They observed that the prediction of hemodynamic consequences of blood depletion and restoration was highly accurate in both methods.
Recently, Brennan and colleagues [7] suggested that Doppler evaluation of respiratory variations in peak velocity of brachial artery blood flow, assessed by internal medicine residents after a brief training in brachial Doppler measurement, could be used as an easily obtainable, noninvasive surrogate of pulse pressure variation, reporting a close correlation and a high level of agreement between ΔVpeakbrach and ΔPPrad. Using a ΔPPrad cutoff of 13% to define a positive prediction of fluid responsiveness, a ΔVpeakbrach value of 16% or more allowed predicting with a 91% of sensitivity and 95% of spe-cificity. Regrettably, the authors did not confirm their findings against an objective end-point of fluid responsiveness, such as changes in stroke volume or CO after a volume challenge.
Our results confirm the ability of ΔVpeakbrach to detect preload dependence in patients receiving passive mechanical ventila-tion and are consistent with previously published studies by demonstrating the efficiency of dynamic parameters for pre-dicting fluid responsiveness and its superiority over static indi-cators of cardiac preload. Unlike invasive indices of preload dependence, ΔVpeakbrach measurement does not need arterial catheterization, is quickly performed at the bedside and does not require any special device or CO monitoring tool, just widely available ultrasound equipment and a minimal training in Doppler acquisition to obtain reliable measurements. There-fore, the noninvasive evaluation of mechanical ventilation over peripheral blood flow could be used as a first-line approach in the emergency department or as an initial intensive care unit assessment in hemodynamically unstable patients for whom fluid administration is considered.
administration [25]. Thirdly, all surrogate parameters of LV stroke volume variations fail to predict fluid responsiveness during spontaneous ventilation or in the presence of cardiac arrhythmias [26], so our results should not be extrapolated to these clinical conditions.
Conclusions
In conclusion, this study provides additional evidence of the utility of respiratory variations in brachial artery peak velocity induced by intermittent positive-pressure ventilation as a feasi-ble tool for predicting fluid responsiveness, with efficiency sim-ilar to other well-known dynamic parameters of preload, in mechanically ventilated patients with acute circulatory failure.
Competing interests
MIMG has received consulting fees from Edwards Lifesci-ences. AGC and JCDM have no conflicts of interest to disclose.
Authors' contributions
MIMG conceived and designed the study, performed the sta-tistical analysis, participated in the recruitment of patients and drafted the manuscript. AGC and JCDM participated in the study design, patient recruitment, measurements and data col-lection and helped draft the manuscript. All the authors read and approved the final manuscript.
References
1. Michard F, Teboul JL: Predicting fluid responsiveness in ICU patients: a critical analysis of the evidence. Chest 2002, 121:2000-2008.
2. Bendjelid K, Romand JA: Fluid responsiveness in mechanically ventilated patients: a review of indices used in intensive care.
Intensive Care Med 2003, 29:352-360.
3. Michard F, Teboul JL: Using heart-lung interactions to assess fluid responsiveness during mechanical ventilation. Crit Care
2000, 4:282-289.
4. Michard F: Changes in arterial pressure during mechanical ventilation. Anesthesiology 2005, 103:419-428.
5. Hofer CK, Senn A, Weibel L, Zollinger A: Assessment of stroke volume variation for prediction of fluid responsiveness using the modified FloTrac and PiCCOplus system. Crit Care 2008, 12:R82.
6. Monnet X, Rienzo M, Osman D, Anguel N, Richard C, Pinsky MR, Teboul JL: Esophageal Doppler monitoring predicts fluid responsiveness in critically ill ventilated patients. Intensive Care Med 2005, 31:1195-1201.
7. Brennan JM, Blair JE, Hampole C, Goonewardena S, Vasaiwala S, Shah D, Spencer KT, Schmidt GA: Radial artery pulse pressure variation correlates with brachial artery peak velocity variation in ventilated subjects when measured by internal medicine residents using hand-carried ultrasound devices. Chest 2007, 131:1301-1307.
8. Eikermann M, Magder S, Malhotra A: Is brachial artery peak velocity variation ready for prime time? Chest 2007, 131:1279-1281.
9. QtiPlot - Data Analysis and Scientific Plotting [http://soft.proin dependent.com/qtiplot.html]
10. Michard F, Boussat S, Chemla D, Anguel N, Mercat A, Lecarpen-tier Y, Richard C, Pinsky MR, Teboul JL: Relation between respi-ratory changes in arterial pulse pressure and fluid responsiveness in septic patients with acute circulatory failure. Am J Respir Crit Care Med 2000, 162:134-138. 11. Manecke GR: Edwards FloTrac sensor and Vigileo monitor:
easy, accurate, reliable cardiac output assessment using the arterial pulse wave. Expert Rev Med Devices 2005, 2:523-527. 12. Pinsky MR, Teboul JL: Assessment of indices of preload and volume responsiveness. Curr Opin Crit Care 2005, 11:235-239.
13. Pinsky MR: The hemodynamic consequences of mechanical ventilation: an evolving story. Intensive Care Med 1997, 23:493-503.
14. Magder S: Clinical usefulness of respiratory variations in arte-rial pressure. Am J Respir Crit Care Med 2004, 169:151-155. 15. Cannesson M, Musard H, Desebbe O, Boucau C, Simon R,
Hen-aine R, Lehot JJ: The ability of stroke volume variations obtained with Vigileo/FloTrac system to monitor fluid respon-siveness in mechanically ventilated patients. Anesth Analg
2009, 108:513-517.
16. Feissel M, Michard F, Mangin I, Ruyer O, Faller JP, Teboul JL: Res-piratory changes in aortic blood velocity as an indicator of fluid responsiveness in ventilated patients with septic shock. Chest
2001, 119:867-873.
17. Durand P, Chevret L, Essouri S, Haas V, Devictor D: Respiratory variations in aortic blood flow predict fluid responsiveness in ventilated children. Intensive Care Med 2008, 34:888-894. 18. Slama M, Masson H, Teboul JL, Arnould ML, Nait-Kaoudjt R, Colas
B, Peltier M, Tribouilloy C, Susic D, Frohlich E, Andréjack M: Mon-itoring of respiratory variations of aortic blood flow velocity using esophageal Doppler. Intensive Care Med 2004, 30:1182-1187.
19. Slama M, Masson H, Teboul JL, Arnout ML, Susic D, Frohlich E, Andrejak M: Respiratory variations of aortic VTI: a new index of hypovolemia and fluid responsiveness. Am J Physiol Heart Circ Physiol 2002, 283:H1729-1733.
20. Gault JH, Ross J Jr, Mason DT: Patterns of brachial arterial blood flow in conscious human subjects with and without cardiac dysfunction. Circulation 1966, 34:833-848.
21. Mayer J, Boldt J, Schollhorn T, Rohm KD, Mengistu AM, Suttner S: Semi-invasive monitoring of cardiac output by a new device using arterial pressure waveform analysis: a comparison with intermittent pulmonary artery thermodilution in patients undergoing cardiac surgery. Br J Anaesth 2007, 98:176-182. 22. Sander M, Spies C, Grubitzsch H, Foer A, Muller M, von Heymann
C: Comparison of uncalibrated arterial waveform analysis in cardiac surgery patients with thermodilution cardiac output measurements. Critical Care 2006, 10:R164.
23. Mayer J, Boldt J, Wolf MW, Lang J, Suttner S: Cardiac output derived from arterial pressure waveform analysis in patients undergoing cardiac surgery: validity of a second generation device. Anesth Analg 2008, 106:867-872.
24. Senn A, Button D, Zollinger A, Hofer CK: Assessment of cardiac output changes using a modified FloTrac/Vigileo algorithm in cardiac surgery patients. Crit Care 2009, 13:R32.
25. Biais M, Nouette-Gaulain K, Cottenceau V, Revel P, Sztark F: Uncalibrated pulse contour-derived stroke volume variation predicts fluid responsiveness in mechanically ventilated patients undergoing liver transplantation. Br J Anaesth 2008, 101:761-768.
Key messages
• Fluid responsiveness can be reliably assessed using Doppler evaluation of ΔVpeakbrach in mechanically venti-lated patients with acute circulatory failure.
• The predictive value of ΔVpeakbrach for assessing fluid responsiveness was similar to ΔPPrad and ΔSVVigileo.
• A ΔVpeakbrach value of 10% or more predicted fluid responsiveness with a 74% sensitivity and 95% specificity.