International Journal of Emerging Technology and Advanced Engineering
Website: www.ijetae.com (ISSN 2250-2459, ISO 9001:2008 Certified Journal, Volume 6, Issue 4, April 2016)
122
Accelerated Solvent Extraction of Polyphenols from Dried
Gabes Henna Leaves: Process Optimization for DIC treatment
and Extraction
Khaoula Elaydi
1, Ahmed Bedoui
2, Karim Allaf
31Materials, Environment and Energy Laboratory ,(06/UR/12-01), Science faculty of Gafsa, 2112 Gafsa, Tunisia. 1,2University of Gabes; Faculty of Sciences, Erriadh City, 6072 Gabes, Tunisia.
3
University of La Rochelle; Laboratory of Engineering Science for Environment LaSIE - UMR-CNRS 7356; Avenue Michel
Crepeau, 17042 La Rochelle cedex 01 (France).
Abstract—In this work, the process of ‘‘Détente Instantanée Contrôlee’’: DIC (French for Instant controlled pressure drop) assisted to water accelerated solvent extraction of secondary metabolites of Henna (Lawsonia inermis) leaves was studied. Accelerated solvent extraction (ASE) was investigated for the extraction of polyphenols from raw material Henna leaves. The most important factors affecting the extraction results were found to be solvent extraction, particle size, temperature, static time and number of extraction static cycle. The maximum TPC yield extracted by water was 107 mg GAE per g of dry raw material, and the optimal conditions were: 75-300 µm, 40°C, 15 min and 2 cycles. Response Surface Methodology (RSM) was used to optimize the conditions of the operating parameters of DIC texturing taking place as pretreatment for getting the highest extraction yields of total phenolic compounds (TPC), total flavonoids content (TFC) and antioxidants. Under the optimal accelerated solvent extraction conditions of the polyphenols extraction, Response Surface Methodology (RSM) was used for optimizing DIC treatment. The yields of secondary metabolites of dry DIC-textured material were higher than that of untreated material with optimized values of, 122 mg GAE g-1db under saturated steam pressure: P = 0.5 MPa and thermal treatment time t = 50s, 38.82 mg Quercetin E g-1 under (P=0.5MPa; t=40s) and 93.85% under (P=0.45MPa; t=44s) for TPC, TFC yields and % inhibition using DPPH radical assay, respectively. The results obtained confirmed that the DIC operating parameters were significant for all dependent variables. In addition, DIC assisted – accelerated solvent extraction was compared with DIC assisted– conventional solvent extraction. All findings indicated that accelerated solvent extraction was as effective as conventional methanol extraction for the recovery of phenolic compounds from Henna leaves and the use of DIC as an innovative process of texturing further intensified the recovery of phenolic compounds. The analyses of the physical and structural properties of untreated and DIC-textured powders were carried out and considered as response dependent variables.
The results illustrated that the optimized DIC treatment implied a controlled increase in porosity. Scanning Electron Microscopy (SEM) showed that, after DIC treatment, there is a change in the structure of the cells of Henna leaves with a destruction of cell walls in comparison with untreated leaves.
Keywords—Accelerated Solvent Extraction ASE, Gabes Henna Leaves GHL, Instant controlled Pressure Drop DIC, Response Surface Methodology RSM and Scanning Electron Microscopy SEM
I. INTRODUCTION
Lawsonia inermis (Lythraceae), commonly called Henna or Hinna, is known for its cosmetic properties. Henna is an important source of phytochemicals of immense medicinal and pharmaceutical significance such as alkaloids, naphthoquinone derivatives, aliphatic components, tannins, phenolic derivatives, coumarins, xanthones, flavonoids (Hsouna et al., 2011; Elaydi et al., 2015). Polyphenols in Henna serve as a natural defense mechanism against microbial infections. They also exert other physiological effects including accelerated blood clotting, reduced blood pressure, decreased serum lipid level, and modulated immune responses (Uma et al., 2010). Number of studies were conducted to prove the bioactivity of L. inermis; free radical scavenging and reducing power (Philip et al., 2011), anti-ulcer potential (Goswami et al., 2011), hypoglycemic and antihyperglycemic effect (Choubey et al., 2010), anthelmintic activity (Eguale and Giday, 2009) and antibacterial activity (Borade et al., 2011).
International Journal of Emerging Technology and Advanced Engineering
Website: www.ijetae.com (ISSN 2250-2459, ISO 9001:2008 Certified Journal, Volume 6, Issue 4, April 2016)
123
Accelerated Solvent Extraction (ASE) is a relatively new technology for extraction of phytochemicals under high temperature and pressure. In ASE, pressure is applied to allow the use as extraction solvents of liquids at temperatures greater than their normal boiling point. The combined use of high pressures (3.3-20.3 MPa) and temperatures (40-200°C) provides faster extraction processes that require small amounts of solvents. High temperature and pressure improves analyte solubility and the desorption kinetics from the matrices (Richter et al., 1996). A considerable number of studies have focused on the use of ASE from an environmental perspective (Okuda et al., 2009 (30); Siriwong et al., 2009). Some studies have reported the use of ASE to extract specified target compounds from spices (Herrero et al., 2005; Zaibunnisa et al., 2009). Other studies have concentrated on total phenolic content and antioxidant extraction (Hossain et al., 2011). Moreover, pretreatment–assisted extraction methods have been recently used, these include microwave-assisted (Guowen Zhang et al., 2013), ultrasound-assisted (Dezashibi et al., 2013), and DIC-assisted extractions (Allaf et al., 2012).
DIC (Détente Instantanée Contrôlée) standing for instant controlled pressure drop was defined in 1988 (Allaf, 1988). DIC is a thermo-mechanical process generated by subjecting the raw material for a short period of time to highly saturated steam pressure followed by an abrupt pressure drop towards a vacuum. Such a drop in pressure rate triggers a certain amount of water to vaporize within the material. It results in an expansion of the material. "Autovaporization" is a vaporization process achieved without heat exchange with the surrounding medium which triggers a cooling of the product and stops any thermal degradation (Allaf and Allaf., 2014).
An initial study on Henna leaves showed a relative improvement of DIC treatment-assisted solvent extraction compared to classic phenolic compound extraction processes. Experimental and fundamental analysis with respect to autovaporization phenomena through instant controlled pressure drop technology were investigated (Elaydi et al., 2015).
In this report, a study carried out on the optimization of phenolic compounds extraction of Henna leaves performed with accelerated solvent extraction and DIC technique was described. A comparative study is also studied on phenolic compounds yields and antioxidant activity between standard solvent extraction and accelerated solvent extraction after DIC treatment. Moreover, measurements of intrinsic density, apparent bulk density, bulk packed density and porosity were carried out for DIC and control powder samples.
Scanning electron microscopy was performed in order to understand the specific effects of DIC treatment on Henna leaf tissues. .
II. MATERIALS AND METHODS
A. Raw material
Henna leaves were collected from Chnini Gabes (Tunisia). They were dried in a dark place at room temperature .The dried leaves were treated by DIC then turned into powder and stored at 4°C.
B. Chemicals
Folin–Ciocalteu reagent, Gallic acid, 2, 2-diphenyl-1-picrylhydrazyl (DPPH), Aluminum chloride, Potassium acetate, Quercetin, Catechin, Vanillin and Gallic acid were purchased from Sigma–Aldrich Company (Saint Louis, MO, USA). Methanol and sodium carbonate (Na2CO3) were obtained from Fisher Scientific Inc. (Pittsburgh, PA, USA). All the reagents were of analytical grade. Deionized water was produced by Millipore system (Millipore Corporation, USA).
C. Instant Controlled Pressure Drop
DIC was defined in 1988 (Allaf et al., 1988) and has been studied, developed, optimized and used at industrial scale for various applications including drying and decontamination, texturing, extraction of non-volatile molecules such as flavonoids and of volatile compounds of some plants (Allaf et Allaf., 2014; Elaydi et al., 2014). DIC equipment has been detailed in numerous articles (Berka-Zougali et al., 2010; Kristiawan et al., 2008).
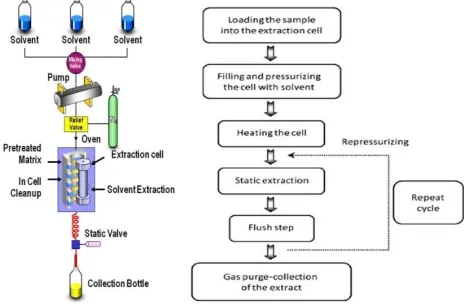
A DIC cycle can be divided into four steps (Figure 1):
a. Initial vacuum
b. Steam injection maintaining both high pressure and high temperature constant during the total processing time
c. Abrupt pressure drop towards the vacuum d. Releasing to atmospheric pressure
International Journal of Emerging Technology and Advanced Engineering
Website: www.ijetae.com (ISSN 2250-2459, ISO 9001:2008 Certified Journal, Volume 6, Issue 4, April 2016)
[image:3.612.59.280.122.261.2]124 Figure 1. Different stages of a DIC cycle.
D. Accelerated Solvent Extraction (ASE)
An Accelerated Solvent Extraction system, ASE 350, equipped with a solvent controller unit from Dionex Corporation (Sunnyvale, CA, USA) with static mode was used to extract bioactive molecules from Henna leaves. Water solvent was used as a fixed parameter in this study after preliminary experiences. All extractions were performed at the following basic conditions: 0.5 g of dried and powdered leaves with a particle size in the range of 75– 300 µm were placed in between two layers of diatomaceous earth in a 5 ml Dionex (ASE 350) stainless steel cell. The cells were equipped with a stainless steel frit and a cellulose filter (20 µm pore size; Dionex Corp.) at the bottom to avoid the collection of suspended particles in the collection vial. The dispersing agent (diatomaceous earth) was used to reduce the solvent volume used for the extraction. The 22 ml stainless steel extraction cells and collection vials were loaded onto the automated carousel. Extraction process was carried out hereafter automatically by an ASE 350 system (Figure 2). The extraction procedure was as follows i) sample is loaded into cell, ii) the extraction cell is moved into the oven, once the oven temperature reached the set point (40°C) and the pump filled the cell with water, iii) heat-up time is applied within the cell is preheated at 40°C for 15 min, iv) 15 min static extraction step takes place in which all system valves are closed, v) the extract was pumped into collection vials and cell is rinsed with 60 % of the cell volume using water solvent vi) solvent is purged from cell with N2 gas and
depressurization takes place. One extraction cycle was applied for the determination of the effective extraction factors. Between extractions, a rinse of the complete system was made in order to overcome any carry-over. The extracts obtained were protected from light and stored under refrigeration until analysis.
Particle size, temperature, static time, flush volume and extraction number cycles were investigated as independent factors.
Effects of independent factors on system responses were determined by changing the level of each factor and keeping the other factors constant. After determination of the optimum levels of independent factors, the number of optimum extraction cycles was determined at optimum extraction conditions. The optimization is performed using the raw material not treated by DIC. After that, DIC and raw material samples (control) were carried out in the same optimized conditions.
Henna leaves were also extracted, in my previous work (Elaydi et al., 2015), with methanol using conventional extraction maceration with the same solid /liquid ratio (0.5:10 g/ml) and temperature (40°C) as ASE. ASE results were compared with the results obtained by optimized conventional extraction after texturing by DIC.
Figure 2. Operating schema and steps involved in accelerated solvent extraction (ASE).
E. Assessments and analysis
1) Total Phenolic Compound (TPC) and Total Flavonoid Content (TFC) determination
TPC was obtained using the Folin-Ciocalteu method according to the Lapornik method (Lapornik et al., 2005). TFC was evaluated using aluminum chloride colorimetric method according to Chang et al. (2002). Details of the two procedures were well described in my previous research (Elaydi et al., 2015).
2) Antioxidant Antioxidant activity: DPPH method
The DPPH radical scavenging activity was evaluated according to the method described by Elaydi et al., (2015).
[image:3.612.328.560.317.469.2]
International Journal of Emerging Technology and Advanced Engineering
Website: www.ijetae.com (ISSN 2250-2459, ISO 9001:2008 Certified Journal, Volume 6, Issue 4, April 2016)
125
is the absorbance of DPPH at time
zero. is the absorbance of DPPH after the 30 minutes of incu-bation.The percentages of remaining DPPH• were plotted against the sample or standard concentrations to obtain the amount of antioxidant necessary to reduce the initial concentration of DPPH.
3) Measurements of intrinsic density, apparent bulk density and bulk packed density
The intrinsic density of Henna expressed in
kilo-grams per cubic meter was measured using a Helium Pycnometer (Accu Pyc 1330 Pycnometer, Micromeritics, Norcross, USA). The pycnometer method (Bachelor and Lynch, 1977) is based on Archimedes‘ principle of fluid displacement and Boyle‘s law to determine the volume. It consists of measuring a change in pressure (and thus a volume) due to the presence of the sample in a calibrated vessel. The apparatus pycnomatic uses helium gas because it can penetrate pores even smaller than 10-10 m. The density is determined very precisely and measurement, including degassing, takes place fully automatically. DIC and control powder samples were placed in a hot air oven at 27°C for 5 h before the intrinsic density measurement in order to ensure their complete drying. The intrinsic density was determined with a precision of ±5 kg.m−3.
The apparent bulk density (aerated bulk density) (kg.m−3) is a property of powders, granules, and other "divided" solids, especially used in reference to chemical substances, pharmaceutical ingredients, foodstuff, or any other masses of corpuscular or particulate matter. It is defined as the mass of many particles of the material divided by the total volume they occupy. The total volume includes particle volume, inter-particle void volume, and internal pore volume.
The bulk packed density (kg.m−3) was obtained after a compaction process (100 successive jerks). Powder densities and were determined and used to describe the aptitude of the powder to lose volume by packing or tapping (Mounir et al., 2010). From these measurements, one can deduce the powder porosity ε and better explain the effect of texturation by DIC after the pretreatment by DIC. The porosity ε is defined as the set of voids (pores) of a solid material. It is the ratio between the volumes of voids to the apparent volume of the powder. Porosity includes both intra-particle porosity and inter-particle porosity, related to the ability of the powder to rearrange during the compaction. It is defined and calculated according to the formula shown by Eq.2 (Wang and Brennan, 1995; Mounir et al., 2010).
Eq. 2
4) Scanning Electron Microscopy (SEM)
The ultra structure of the dried DIC and control samples of Henna leaves were observed thanks to a Scanning Electron Microscope with Energy Dispersive X-Ray (SEM-EDX) (Nova Nano SEM 450). Measurements were carried out under partial vacuum and at an accelerating voltage of 25 kV, in Central Laboratory Unit, at Qatar University.
F. Experimental Design and statistical analysis
In DIC- assisted accelerated solvent extraction, preliminary trials allowed us to define an adequate experimental design with relevant operating parameters with well-defined ranges. DIC impacts have the specificity to be observed as a texturing pre-treatment prior to the ASE. The study was carried out in two successive stages: a) accelerated solvent extraction optimization based on maximizing TPC from raw material (powdered dried Henna), and b) DIC treatment optimization based on multi-criteria procedure. Both stages were separately studied
.
The main DIC operating parameters used as independent variables were the saturated steam pressure P and the thermal treatment time t. An adequate statistical treatment of the data issued from the experimental work was used to study, analyze and optimize DIC treatment. Response Surface Methodology (RSM) with a two-factor, five-level ( ; ; ; ) central composite rotatable experi-mental design method was defined with: 2k =22 =4 factorial levels; 2*k=2*2= 4 star-levels and 5 replicates at the central point.
Factorial points:4 points (-1/-1;-1/+1;+1/-1;+1/+1)
Star points: 4 points(-α/0 ; 0/-α ; +α/0 ; 0/+α)
Repetitions (0/0)
The mathematical empirical model was defined as:
∑
∑
∑ ∑
Eq. 3
Where : is the response dependent variable; the independent variables; and , , , and the
regression coefficients; i and j the indices of the factors; while : is the random error of the factors.
International Journal of Emerging Technology and Advanced Engineering
Website: www.ijetae.com (ISSN 2250-2459, ISO 9001:2008 Certified Journal, Volume 6, Issue 4, April 2016)
126 The analyses of variance (ANOVA) was used to
determine significant differences between
independent variables (p<0.05);
Pareto chart was used to identify the impact of variables on various responses. The vertical line (significance front) in the Pareto chart determines the effects that are statistically significant at the 95% confidence level;
General trends to analyze various behavioral responses in front of variable changes;
Surface methodology plots to optimize the various responses;
Empirical model coefficients to determine the regression model for each response and R2 for the accurate fitting of models to real data.
If the Pareto chart shows a significant effect of any operating parameter, Main Trends and Surface Response, as well as the empirical regression model, can be used to optimize the concerned response (dependent parameter). In the specific studies of DIC, the possible absence of significant effect of operating parameters can be coupled with a global impact of this whole texturing pretreatment. Thus, the comparison between the average of DIC-textured samples and the untreated sample allows for the identification of this impact.
Analyses were performed in triplicate. Results were expressed as means ± standard deviation.
III. RESULTS AND DISCUSSION
A. Optimization of accelerated solvent extraction
Despite the improvements noted in the secondary metabolites yields extracted from Henna leaves, global diffusivity as well as in the starting accessibility when using DIC-assisted conventional methanol extraction (Elaydi et al., 2015), it remains to replace methanol by another environmental solvent by maintaining or even intensifying the responses of dependants variables. Pressure in the instrument was evaluated as a fixed factor because the pump pressure could not be changed in the ASE 350 model. So, a fixed pressure value (102.1 atm) was applied throughout all experiments. Independent factors including solvent extraction, particle size, temperature, flush volume, and static extraction time were investigated to achieve maximum extraction efficiency. TPC of the raw material extract was selected as the best response (dependent factor). It was chosen because it gives an important idea about overall and proportional polyphenol composition of the tested samples.
1) Solvent extraction
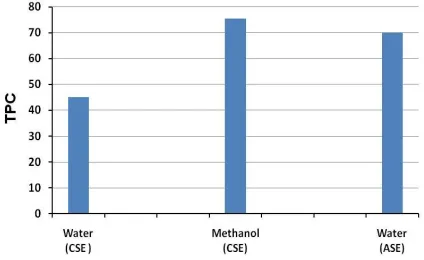
Since our main goal was to extract the polyphenols of Gabes Henna leaves with a friendly solvent, we thought to assess water extractability using accelerated solvent extraction. In this case, we speak about "the extraction with water under pressure" or "Pressurized Water Extraction PWE". By applying the same operating conditions opti-mized in my previous work using conventional solvent extraction (solid to liquid ratio (0.5:10 g/ml), T= 40°C and t=75 min) in the ASE instrument by replacing methanol by water, we obtained a TPC = 70 mg GAE.g-1 db. This yield was much higher than that found in Conventional Solvent Extraction (CSE) using water (TPC = 45.06 mg GAE.g
-1db), and it was in the same order as the optimum content
[image:5.612.335.547.366.496.2]found using methanol (TPC = 75.51 mg GAE.g-1 db) (Figure 3).We therefore found these results to be encoura-ging evidence to choose water the suitable solvent in ASE. Water was selected as a fixed factor throughout all of the ASE experiments.
Figure 3. Solvent impact on TPC extraction from GHL using Conventional Solvent Extraction (CSE) and Accelerated Solvent
Extraction (ASE).
2) Particle size
The extraction of valuable and bioactive compounds from Henna leaves can be facilitated by grinding samples to small particles to increase the surface area and shorten the path lengths over which the solutes have to travel to reach the bulk fluid medium. In general, lowering particle size also enhances the yield of phenolic compounds (Jian et al., 2010).
International Journal of Emerging Technology and Advanced Engineering
Website: www.ijetae.com (ISSN 2250-2459, ISO 9001:2008 Certified Journal, Volume 6, Issue 4, April 2016)
127
The extraction is conducted at fixed parameters which include temperature (40°C), extraction time (30 min), flush volume (60%) and one static cycle, respectively.
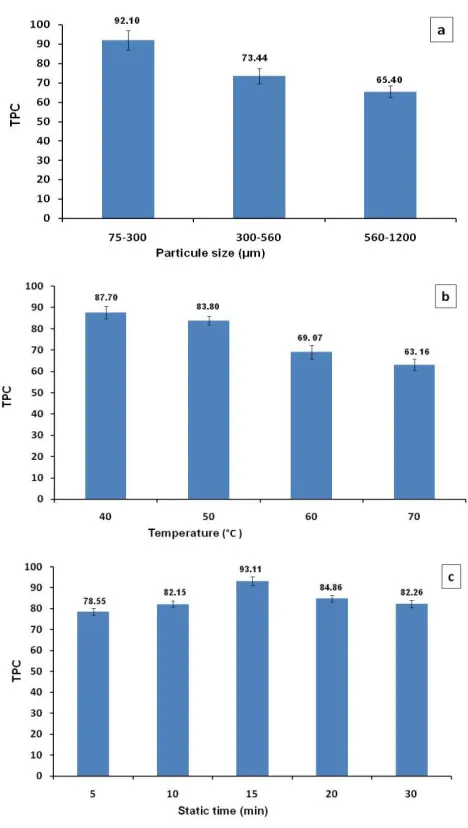
[image:6.612.51.285.307.721.2]Particle size had a significant effect in ASE efficiency: TPC increased as the particle size decreased (Figure 4a). It was found that the highest TPC yield extracted was 92 mg GAE. g-1 db in the range between 75-300 μm of particle size. While, the lowest TPC yield found was 65.5 mg GAE.g-1db with big particle size in the range of 560-1200 μm. When the particle size of 75-300 μm was used instead of 560-1200 μm, there was an almost 1.4 fold increase in TPC. It may be more efficient to classify the particles of 75-300 μm into finer particles by using more sensitive commercial sieves. A particle size of 75-300 μm was used in subsequent experiments.
Figure 4. Effects of particle size (a), temperature (b), static time (c), and flush volume (d) on TPC yield. (Bars show means ± SD of three
replicates; TPC: total phenolic content (mg GAE g-1db))
3) Temperature
International Journal of Emerging Technology and Advanced Engineering
Website: www.ijetae.com (ISSN 2250-2459, ISO 9001:2008 Certified Journal, Volume 6, Issue 4, April 2016)
128 4) Static time
Static time is defined as the time the sample interacts with the extraction solvent per cycle in the extraction cell under defined extraction conditions in a pressurized liquid extractor (Luthria, 2008). Five static time settings (5, 10, 15, 20 and 30 min) were investigated in order to determine the effects of static time on TPC extraction yield. ASE 350 permits the extraction of samples with a static time between 5 and 99 min. A statistical difference was observed between 5 and 15 min in terms of TPC yield (Figure 4c), the maximum response as average value was observed with a 15 min static time. It should be noted that TPC of the extracts from Henna leaves started to decrease when a static time longer than 15 min was applied at 40°C. These finding can be attributed to the hydrolyzing of some long phenolic chains to others with some small degree. So, 15 minutes time was selected as optimum for subsequent experiments.
5) Flush volume
To minimize solvent consumption especially when organic solvents are used in extractions, the determination of optimum flush volume is very important. ASE 350 permits to study flush volume between 0% and 150% of the extraction cell volume. While, after several preliminary assays carried out by Dionex Corporation on wet food, animal feed and vegetables samples, a technical note was used and preferred to begin at 60% of flush volume. Three levels of flush volume (60%, 80% and 100%) were carried out and showed that there is no significant effect on TPC response (Figure 4d). Consequently, flush volume of 60% was selected as optimum to analyze the number of cycle parameter. Flush volumes were noted as significant (Luthria, 2008), or non significant (Li et al., 2006) on extraction efficiency.
6) Number of extraction static cycle
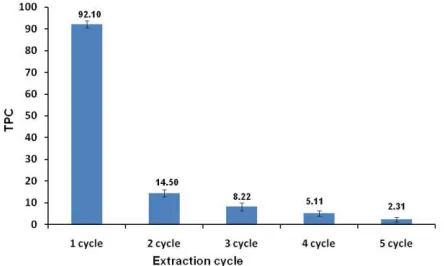
Generally, it is advisable to use multiple cycles rather than long single cycles. ASE 350 permits to extract samples with a maximum of 5 static cycles. Samples of powdered GHL with a particle size of 75-300µm were extracted with water at 40°C and 102.1 atm for 15 min. The extraction cell was then rinsed with fresh water (60%) and purged with nitrogen gas flow for 45 s. Each extract of five cycles was separately collected in five different collection bottles. TPC yields were analyzed using the Folin-ciocalteu method.
The maximum TPC which can be extracted from GHL is the sum of the five yields from each cycle. About 75.5 % of TPC in five total cycles were extracted in the first cycle while 87.5 % were extracted in the second cycle (Figure 5).
Three and four extraction cycles were enough to extract more than 94% and 98% of the phenolics, respectively. To obtain 100% of the analytes in the sample matrix, an infinite number of extraction cycles should be applied.
[image:7.612.334.556.223.356.2]In order to minimize energy costs and solvents in the process, we selected two extraction cycles for subsequent experiments.
Figure 5. Effect of extraction cycles on TPC yield (Bars show means ± SD of three replicates; TPC: total phenolic content (mg GAE .g-1db)).
B. Effet of DIC as texturing pretreatment on Total phenolic compound (TPC), total flavonoids content (TFC) and Antioxidant activity AOA
The effect of DIC pretreatment on TPC, TFC and antioxidant activity extraction was studied using the optimum conditions previously estimated by ASE. Levels of DIC independent variables selected were saturated steam pressure P and thermal treatment time t. A statistical treatment of results was executed using the analysis design procedure of Statgraphics Plus software for Windows and the results are illustrated in Table 1.
Table 1.
Levels of DIC independent variables; saturated steam pressure P and thermal treatment time t used in a 2-parameter, 5-level DoE.
Coded level -α -1 0 +1 +α
Steam pressure (MPa) 0.2 0.24 0.35 0.46 0.5 Processing time (s) 10 16 30 44 50
α (axial distance)= √ , k is the number of orthogonal design variables. In this case, K=2 and α= 1.4142.
1) Total phenolic content
International Journal of Emerging Technology and Advanced Engineering
Website: www.ijetae.com (ISSN 2250-2459, ISO 9001:2008 Certified Journal, Volume 6, Issue 4, April 2016)
129
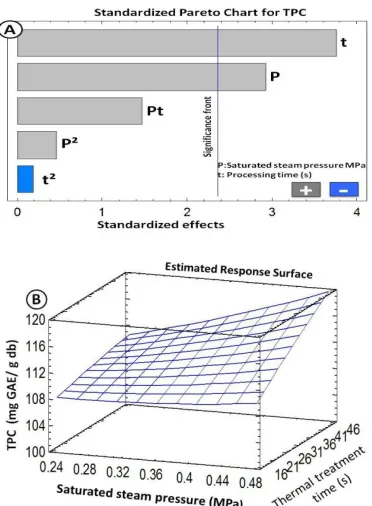
The positive result with both P and t shows that TPC increased when P and t were increased, confirming that DIC treatment does not involve thermal degradation because only an improve-ment of functional features occurred. The mathematical relationship obtained with the statistical software, Statgraphics, was a polynomial equation representing the quantitative effect of process variables and their interactions on the measured response. The second-order polynomial equation of the response surface obtained is as follows:
Eq. 4
[image:8.612.78.264.398.651.2]The R-squared statistic indicates that the model as described explains 78.19% of the variability in TPC. The optimized parameters to maximise the extraction of TPC give an optimal yield of 122 mg GAE.g-1db for saturated steam pressure P=0.5 MPa and total time t = 50 s compared to 105.12 mg GAE.g-1db for the control. The results reflected an increase in TPC yield from the DIC treated samples of about 1.16 times higher than that of the raw material.
Figure 6. Pareto chart (A), response surface (B) and general trends (C) of DIC operating parameters for TPC extracted from GHL after
DIC treated samples.
International Journal of Emerging Technology and Advanced Engineering
Website: www.ijetae.com (ISSN 2250-2459, ISO 9001:2008 Certified Journal, Volume 6, Issue 4, April 2016)
[image:9.612.184.432.158.301.2]130 Table 3.
Comparison of the total phenolic compounds TPC of Henna leave obtained with many extraction methods.
Extraction method TPC (mg GAE.g
-1 db)a
(mg TAE.mg-1dm)b Reference DIC-Assisted accelerated
solvent extraction
122 a This work
DIC-Assisted Solvent Extraction ( Methanol , t=75 min, T= 45°C)
76. 7 a Elaydi et al., 2015
Conventional extraction (Acetone (48.07%), t= 73.78 min and T= 39.57°C)
72.03 a Uma et al.,
2010
Ultrasound-assisted method (methanol )
2.5 b Haddad et al.,
2007) Percolation (methanol) 2.0 b Haddad et al.,
2007)
(mg TAE.mg-1dm): mg tannic acid equivalent per mg dry matter
2) Total Flavonoid content TFC
The experimental results on flavonoids content extracted from the DIC-treated samples of Henna leaves raw material are listed in Table 2. By reporting the values of TFC assay, it is worth noting that all DIC samples were higher than the untreated raw material (MP).
Figure 7B shows the effects of the operating parameters in terms of TFC response on a Pareto chart, which is usually introduced to describe a phenomenon in which 95% of the variation observed in experimental processes can be explained by a mere 5% of the causes of that variation. Saturated steam pressure (P) and processing time (t) were significant. General trends (7C) showed that the higher P and t, the higher the TFC yields. It was then possible to establish an empirical model of the DIC-TFC yields versus the DIC processing parameters.
The R2value (R2 = 93.77%) directly proved that the DIC treatment was a very relevant pretreatment process with flavonoids:
Eq. 5
[image:9.612.53.542.371.517.2]Similar findings described in my previous work (Elaydi et al., 2015) proved the great capability of DIC to increase the extractability of TFC from Henna leaves using a conventional solvent extraction method. The highest value of total flavonoids extraction was reached from the DIC sample treated at (P=0.5 MPa and t= 40 s); it was 70% higher than the untreated raw material (38.81 versus 22.85 mg Quercetin E.g-1db).
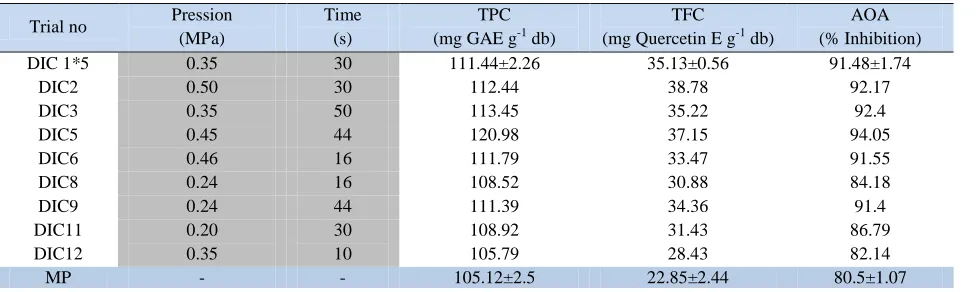
Table 2.
DIC operating parameters (independent variables), total phenolic and total flavonoids contents yields and anti-oxidant as responses (dependent variables) in a central composite design in the accelerated solvent extraction of GHL
Trial no Pression (MPa)
Time (s)
TPC (mg GAE g-1 db)
TFC
(mg Quercetin E g-1 db)
AOA (% Inhibition)
DIC 1*5 0.35 30 111.44±2.26 35.13±0.56 91.48±1.74
DIC2 0.50 30 112.44 38.78 92.17
DIC3 0.35 50 113.45 35.22 92.4
DIC5 0.45 44 120.98 37.15 94.05
DIC6 0.46 16 111.79 33.47 91.55
DIC8 0.24 16 108.52 30.88 84.18
DIC9 0.24 44 111.39 34.36 91.4
DIC11 0.20 30 108.92 31.43 86.79
DIC12 0.35 10 105.79 28.43 82.14
International Journal of Emerging Technology and Advanced Engineering
Website: www.ijetae.com (ISSN 2250-2459, ISO 9001:2008 Certified Journal, Volume 6, Issue 4, April 2016)
131
[image:10.612.47.289.255.596.2]DIC affects the vegetal morphology and breaks the cell walls, resulting in higher availability of stable bioactive molecules such as TFC. As cited by many researches, lawsochrysin, lawsochrysinin, lawsonaringenin, rhoifolin (Uddin et al., 2011), apigenin, luteolin, cosmosiin (Mikhaeil et al., 2004) were the famous names of flavonoids molecules which are extracted and isolated from the Henna leaves.
Table 4:
Comparison of the total flavonoid content (TFC) of Henna leaves obtained with several extraction methods.
Extraction method TFC (mg Quercetin E g-1db) Reference
DIC-Assisted
accelerated solvent extraction
38.81 This work
DIC-Assisted Solvent Extraction (Methanol , t=75 min, T= 45°C)
29.8 Elaydi et
al., 2015
Conventional extraction (methanol, t= 1 hrs, ultrasonic bath )
25.05 Arun et al.,
2010
Figure 7. Pareto chart (A), response surface (B) and general trends (C) of DIC operating parameters for TFC extracted from GHL after
DIC treated samples.
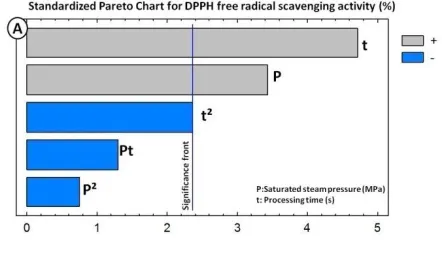
3) DPPH assay
The results for the free radical scavenging activity of plant extracts are presented in Table 2. The results showed that the DIC sample extracts contained a % DPPH radical scavenging activity that was between 82% - 94% higher than the extracts of the untreated raw material (80.5%).
The Pareto chart (Figure 8A) shows clearly that the two DIC operating parameters positively affected the antioxidant activity of Lawsonia inermis L. leaves. However, processing time seemed to be the most significant factor. This finding could be explained by the low thermal degradation of this activity during DIC treatment. The mechanical impact on the instantaneous drop to a vacuum results in some disruption of the cell walls, thus facilitating the extraction of phenols and other active compounds. The empirical regression model of anti-oxidant activity was established with R2 = 85.56%.
[image:10.612.333.554.574.702.2]International Journal of Emerging Technology and Advanced Engineering
Website: www.ijetae.com (ISSN 2250-2459, ISO 9001:2008 Certified Journal, Volume 6, Issue 4, April 2016)
[image:11.612.349.535.137.288.2]132 Figure 8. Pareto chart of DIC operating parameters (A), general
trends (B) and the response surface (C) for the Antioxidant Activity (AOA) of Henna leaf after DIC treatment
Recent research reported a highly positive relationship between total phenols and antioxidant activity as the main trend in many plant species (Shian et al., 2012). Figure 9 shows linear and polynomial correlations between total phenol content and DPPH assay of extracts of DIC treated materials. The results show a highly significant positive polynomial correlation coefficient between the total phenolic content and the DPPH assay of the extracts (R2=0.948), thus suggesting that phenols are major contributors to the antioxidant activity. The overall results clearly indicate that DIC-samples have a strong antioxidant activity (Eq. 6):
( )
[image:11.612.64.271.141.421.2]Eq. 6
Figure 9. Correlations between total phenolic content and DPPH free radical scavenging inhibition.
C. Effect of texturing by DIC on Henna structure: physical and microstructure characterization
In order to confirm the hypothesis of the DIC texturing effect and changes in the structure of Henna leaves, powders are physically and structurally characterized. The physical characterization involves the determination of intrinsic, bulk and bulk packed densities and the structural- textural characterization concerns the determination of the microstructure by scanning electron microscope.
1) Physical characterization
The intrinsic density or pycnometric density was determined by measuring the volume occupied by a known mass of powder, by equivalence with the volume of gas displaced by the powder in the helium pycnometer. Intrinsic density is generally dependent on the nature of the material and its composition, but generally does not depend on the structure of the product in question.
International Journal of Emerging Technology and Advanced Engineering
Website: www.ijetae.com (ISSN 2250-2459, ISO 9001:2008 Certified Journal, Volume 6, Issue 4, April 2016)
133
[image:12.612.57.281.260.701.2]The Pareto analysis shown in Figure 10 illustrates that operative conditions have no effect on this parameter. Intrinsic density values ranged between 1.4468 to 1.4804 g.cm-3, which corresponds respectively to points DIC 6 and DIC 11, compared to 1.4873 g.cm-3 value for the untreated raw material. The regression model relating the intrinsic density of Henna leaf powder to DIC operating parameters is obtained with a low regression coefficient R2 = 48. 51%.
Table 5.
[image:12.612.344.548.591.705.2]Examples of intrinsic densities values of Henna powder (a: DIC 5; b: raw material)
Figure 10. Pareto chart for intrinsic density of powdered GHL.
Contrary to the intrinsic densities of DIC-samples,
which were constantat 1462 ± 9 kg·m−3, the apparent bulk densities (aerated bulk densities) of Henna samples were significantly influenced by the DIC-texturing treatment (Figure11). The bulk densities of textured samples ( between 394 and 476 kg·m−3) were lower than the raw material ( =485 kg·m−3). The decrease in the aerated bulk densities of DIC-textured powder could be due to the enlargement of granules creating inter-particle voids. The presence of occluded air/vacuoles in the irregularly shaped particles consequently results in a larger bulk volume. The regression model of aerated bulk density was determined for DIC texturing samples (with R2 = 0.77) as follows:
Eq. 7
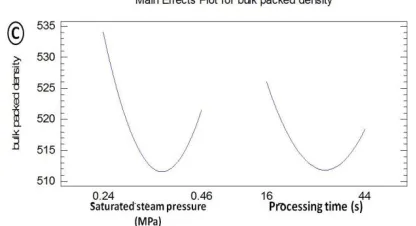
The ―bulk packed‖ density refers to the ability of the powder to lose a part of its volume by compressing or tapping. With regard to DIC treatment, the bulk packeddensities after specific compaction had asimilar behaviour to aerated bulk densities, but with closer values. Thus, for DIC-textured powders, bulk packed density values ranged between 510 and 550 kg·m−3 compared to 560 kg·m−3 for the raw material. This observation can be explained by the fact that the rearrangement of irregular shaped particles allows the fine particles to fill the large inter-particle space voids, inducing a low degree of interstitial air.
The RSA of the experimental data were shown in Figure 12.The regression model of bulk packed density was determined for DIC texturing samples (with R2 = 0.73) as follows:
Eq. 7
International Journal of Emerging Technology and Advanced Engineering
Website: www.ijetae.com (ISSN 2250-2459, ISO 9001:2008 Certified Journal, Volume 6, Issue 4, April 2016)
[image:13.612.78.274.135.372.2]134 Figure 11. Pareto chart of DIC operating parameters (A), general trends (B) and the response surface (C) for the apparent bulk density
[image:13.612.341.549.139.252.2]of Henna powder after DIC treatment
Figure 12. Effect of DIC –texturing on the bulk packed densities of DIC-samples of GHL
2) Microstructural characterization of GHL powdered
Porosity values were deducted from the apparent bulk and intrinsic densities, including both intra-particle and inter-particle porosity. Figure 13 shows the evolution of powder porosity. As illustrated in Figure 13 A, the porosity was influenced by the positive sign of both pressure P and processing time t. Porosity values ranged from 71% to 73% for textured powders compared to 67 % for the untreated raw material value. The high values of porosity explain the low values of bulk densities for textured powders. The main effects (Figure 13B) show a slow decrease of porosity after a maximum achieved by the two operating parameters. This observable decrease could be related to the formation of aggregates due to the assembling of the small powdery particles.
The regression model of the porosity of textured powder was determined with (R2 = 69.5%), as follows:
International Journal of Emerging Technology and Advanced Engineering
Website: www.ijetae.com (ISSN 2250-2459, ISO 9001:2008 Certified Journal, Volume 6, Issue 4, April 2016)
[image:14.612.66.277.138.423.2]135 Figure 13. Effect of DIC –texturing on Henna powder porosity
To study the microstructural changes after the DIC treatment, DIC-treated and untreated leaves were observed by Scanning Electron Microscopy (SEM) to show the modifications to the microstructure. The structural changes include external and internal microstructures of Henna leaves as shown in Figures 14 and 15. The structures of raw leaves are compact (Figures 14 and 15). In these latter figures, the dark regions were dominated and only some small cavities and holes appeared. However, well-defined big pores and cracks were created by the DIC-treatment as shown in Figures 14 and 15. The internal structure (Figure 14) shows the presence of two large cracks and the large diameter of a hole which is opposite of those found in the untreated raw material. One notes that these modifications led to an evident expansion of the structure.
[image:14.612.59.557.452.634.2]These figures show the great impact of DIC on the microstructure of Henna leaves. The modifications that are added can greatly modify structural characteristics (porosity, specific surface area, etc.). It would then be possible to control functional and technological capacities that help to greatly intensify mass transfer phenomena by improving diffusivity and permeability within the plant as well as the increase of the availability and/or the initial accessibility of some high added-value compounds as demonstrated in my previous work (Elaydi et al., 2015). In addition to this, we may easily explain why the extraction is much better after DIC treatment.
International Journal of Emerging Technology and Advanced Engineering
Website: www.ijetae.com (ISSN 2250-2459, ISO 9001:2008 Certified Journal, Volume 6, Issue 4, April 2016)
136 D. Verification of results
The suitability of the model equation for predicting the
optimum response values was tested using the
[image:15.612.59.557.140.324.2]recommended optimum conditions. The experimental results for all DIC-responses were very close to the predicted ones (Table 6). This implied that there was a high fit degree between the values observed in experiments and the values predicted from the regression model. Hence, the response surface modelling could be applied effectively to predict extraction of phenolic compounds from Henna leaves.
Table 6.
Comparison between predicted and experimental values of DIC-responses
Responses Predicted
values
Experimental values TPC (mg GAE.g-1db) 122 120.98 TFC (mg Quercetin E.g-1db) 38.82 38.78 AOA (% inhibition) (%) 93.85 94.05 (Kg. m-3) 570.77 551.4
Porosity (%) 73 73
The optimum conditions of DIC treatment based on using the highest secondary metabolites have been retained for future work concerning the scaling up and industrialization of the DIC-assisted ASE and its application in food processing as well as in the field of dyeing.
IV. CONCLUSION
[image:15.612.53.282.523.601.2]This research studied the yields of some secondary metabolites from Gabes Henna Leaves pretreated by instant controlled pressure-drop using accelerated solvent extraction and the results were compared with conventional extraction. The optimization of accelerated solvent extraction of polyphenol from Henna leaves showed that solvent extraction, particle size, temperature, static time and number of extraction static cycle were the main factors that affects TPC yield. The optimized conditions were determined using water as the best solvent; particles size between 75 and 300 µm; temperature T = 40°C, static time t=15 min, flush volume =60% and two extraction cycles. Then, the highest value of TPC was 107 mg GAE.g-1db. Under these conditions, the study of the impact of DIC texturing on the ASE of polyphenols from GHL showed that the global effect was systematically positive. The two DIC operating parameters P and t had positive effects and the improvement ratio of TPC yield reached up to 116%. A quite comparative study between solvent extraction and accelerated solvent extraction showed that ASE improved the phenolic compounds yields of the extracts and shorter the extraction times. The pretreatment by DIC induces many micro-structural and physical modifications on GHL powder. The open cell structure and expanded matrix allow getting better yields on bioactive molecules.
International Journal of Emerging Technology and Advanced Engineering
Website: www.ijetae.com (ISSN 2250-2459, ISO 9001:2008 Certified Journal, Volume 6, Issue 4, April 2016)
137 Acknowledge
The authors wish to thank La Rochelle University for all the chemicals, instruments, and apparatus supplied for this study also ABCAR-DIC Process for providing DIC equipment.
REFERENCES
[1] Allaf, K.,Vidal, P., (1988). Feasibility study of a new process of drying/swelling by instantaneous decompression toward vacuum of in pieces vegetables in view of na rapid re hydration, Gradient Activity Plotting University of Technology of Compiegne UTC No CR/89/103.
[2] Allaf, T., Allaf, K., (2014). Instant Controlled Pressure Drop (D.I.C.) in Food Processing. Springer, New York.
[3] Allaf, T., Mounir, S., Tomao, V., Chemat, F., (2012). Instant controlled pressure drop combined to ultrasounds as innovative extraction process combination: Fundamental aspects. Procedia Eng. 42, 1061-78.
[4] Allaf, T., Tomao, V., Ruiz, K., Bachari, K., El Maataoui, M., Chemat, F., (2013). Deodorization by instant controlled pressure drop autovaporization of rosemary leaves prior to solvent extraction of antioxidants. LWT - Food Science and Technology 51, 111- 119. [5] Arun, P., Purushotham, K.G, Johnsy jayarani, J., Vasantha, k.,
(2010). In vitro Antibacterial activity and flavonoid contents of Lawsonia inermis (Henna). International Journal of PharmTech Research2, 1178-1181.
[6] Bachelor, R.L., Lynch, T.J., (1977). Pycnometer, as United States patent 4095473, application number: 05/ 797648, publication date: 06/20/1978; filing date: 05/16/1977
[7] Ben Amor, B., Allaf, K., (2009). Impact of texturing using instant pressure drop treatment prior to solvent extraction of anthocyanins from Malaysian Roselle (Hibiscus sabdariffa). Food Chem. 115, 820–825.
[8] Berka-Zougali, B., Hassani, A., Besombes, C., Allaf, K., (2010). Extraction of essential oils from Algerian myrtle leaves using instant controlled pressure drop technology. Journal of Chromatography A 1217(40), 6134-6142.
[9] Besombes, C., Berka-Zougali, B., Allaf, K., (2010). Instant controlled pressure drop extraction of lavandin essential oils: fundamentals and experimental studies. J. Chromatogr. A 1217, 6807–6815.
[10] Borade, A.S., Kale, B.N., Shete, R.V., (2011). A phytopharmacological review on Lawsonia inermis (Linn.). International journal of pharmacy & life sciences 2(1), 536-541. [11] Chang, C.C., Yang, M.H., Wen, H.M., Chern, J.C., (2002).
Estimation of total flavonoid content in propolis by two complementary colorimetric methods. Journal of Food and Drug Analysis 10(3), 178-182.
[12] Choubey, A., Ojha, M., Mishra, A., Mishra, S., Patil, U.K., (2010). Hypoglycemic and antihyperglycemic effect of ethanol extract of whole plant of Lawsonio Inermis (Henna) in streptozotocin induced diabetic rats. International Journal of Pharmaceutical Sciences and Research 1(8), 74-77.
[13] Eguale, T., Giday, M., (2009). In vitro anthelmintic activity of three medicinal plants against Haemonchus contortus. International Journal of Green Pharmacy 3(1), 29-34.
[14] Elaydi, K., Kamal, I., Bedoui, A., Allaf, K., (2015). Innovative process of texturing-assisted solvent extraction: Impacts on polyphenols, flavonoids, tannins and antioxidant of Henna. International Journal of Emerging Technology and Advanced Engineering 5(3), 403- 416.
[15] Goswami, M., Kulshreshtha, M., Rao, C., Yadav, S., Yadav, S., (2011). Anti-ulcer potential of Lawsonia inermis I. leavesa gainst gastric ulcers in rats. Journal of Applied Pharmaceutical Science 01(02), 69-72.
[16] Guowen, Z., Mingming, H., Li H., Peng, F., Lin, W., Jia Z., (2013). Optimization of microwave-assisted enzymatic extraction of polyphenols from waste peanut shells and evaluation of its antioxidant and antibacterial activities in vitro. Food and bioproducts processing 91, 158-168.
[17] Haddad, K.M.H., Dezashibi, Z., (2007). Phenolic compounds and antioxidant activity of Henna leaves extracts (Lawsonia Inermis ). World Journal of Dairy & Food Sciences 2 (1), 38-41.
[18] Herrero, M., Arráez-Román, D., Segura, A., Kenndler, E., Gius, B., Raggi, M. A., et al. (2005). Pressurized liquid extraction–capillary electrophoresis–mass spectrometry for the analysis of polar antioxidants in rosemary extracts. Journal of Chromatography A1084(1–2), 54–62.
[19] Hossain, M.B., Barry-Ryan, C., Martin-Diana, A. B., Brunton N.P., (2011). Optimisation of accelerated solvent extraction of antioxidant compounds from rosemary (Rosmarinus officinalis L.), marjoram (Origanum majorana L.) and oregano (Origanum vulgare L.) using response surface methodology. Food Chemistry 126, 339–346. [20] Hsouna, A.B., Trigui, M., Culioli, G., Blache, Y., Jaoua, S., (2011).
Antioxidant constituents from Lawsonia inermis leaves: Isolation, structure elucidation and antioxidative capacity. Food Chemistry 125(1), 193-200.
[21] Jian, D., Russell, J.M., (2010). Plant phenolics: extraction, analysis and their antioxidant and anticancer properties. Molecules 15, 7313-7352.
[22] Kristiawan, M., Sobolik, V., Allaf, K., (2008). Isolation of Indonesian cananga oil using multi-cycle pressure drop process. Journal of Chromatography A 1192(2), 306-318.
[23] Lapornik, B., Prosek, M., Golc Wondra, A., (2005). Comparison of extracts prepared from plant by-products using different solvents and extraction time. Journal of Food Engineering 71(2), 214-222. [24] Li, P., Li, S.P., Lao, S.C., Fu, C. M., Kan, K.K.W., Wang, Y.T.,
(2006). Optimization of pressurized liquid extraction for Z-ligustilide, Z-butylidenephthalide and ferulic acid in Angelica sinensis. Journal of Pharmaceutical and Biomedical Analysis 40, 1073-1079.
[25] Luthria, D.L., (2008). Influence of experimental conditions on the extraction of phenolic compounds from parsley (Petroselinum crispum) flakes using a pressurized liquid extractor. Food Chemistry 107, 745-752.
[26] Luque de Castro, M.D, Priego-Capote, F., (2012). Soxhlet extraction versus accelerated solvent extraction. University of Córdoba, Córdoba, Spain.
[27] MaTeresa, F.P., Lourdes, C., Casimiro M., Miguel, R., Enrique, M.O., (2012). Extraction of antioxidant compounds from different varieties of Mangifera indica leaves using green technologies. J. of Supercritical Fluids 72, 168–175.
International Journal of Emerging Technology and Advanced Engineering
Website: www.ijetae.com (ISSN 2250-2459, ISO 9001:2008 Certified Journal, Volume 6, Issue 4, April 2016)
138
[29] Mounir, S., Schuck, Pierre., Allaf , K., (2010). Structure and attribute modifications of spray-dried skim milk powder treated by DIC (Instant Controlled Pressure Drop) technology. Dairy Sci. Technol. 90 (2-3), 301–320.
[30] Okuda,T., Yamashita, N., Tanaka, H., Matsukawa, H.,Tanabe, K., (2009). Development of extraction method of pharmaceuticals and their occurrences found in japanese wastewater treatment plants. Environment International 35(5), 815-820.
[31] Philip, J.P., Madhumitha, G., Mary, S.A., (2011). Free radical scavenging and reducing power of Lawsonia inermis L. seeds. Asian Pacific Journal of Tropical Medicine 4(6), 457-461.
[32] Richter, B.E., Jones, B.A., Ezzell, J.L., Porter, N.L., Avdalovic, N., Pohl, C., (1996). Accelerated solvent extraction: a technique for sample preparation. Anal. Chem. 68, 1033-1039.
[33] Sasidharan, S., Chen, Y., Saravanan, D., Sundram, K.M.,Yoga Latha, L., (2011). Extraction, Isolation and characterization of bioactive compounds from plants' extracts. Afr J Tradit Complement Altern Med., 8(1), 1-10.
[34] Shian, T.E., Abdullah, A., Musa, K.H., Maskat, M.Y., Ghani., M.A., (2012). Antioxidant Properties of Three Banana Cultivars (Musa acuminata ‗Berangan‘ ‗Mas‘ and ‗Raja‘) Extracts. Sains Malaysiana 41(3), 319-324.
[35] Siriwong, W., Thirakhupt, K., Sitticharoenchai, D., Rohitrattana, J., Thongkongowm, P., Borjan, M., et al. (2009). DDT and derivatives in indicator species of the aquatic food web of Rangsit agricultural area, Central Thailand. Ecological indicators, 9(5), 878-882.
[36] Spigno, G., Tramelli, L., & Faveri, D. M. D. (2007). Effects of extraction time, temperature and solvent on concentration and antioxidant activity of grape marc phenolics. Journal of Food Engineering, 81, 200–208.
[37] Uddin, N., Siddiqui, B.S., Begum, S., Bhatti, H.A., Khan, A., Parveen, S., Choudhary, M.I., (2011). Bioactive flavonoids from the leaves of Lawsonia alba (Henna). Phytochemistry Letters 4(4), 454-458.
[38] Uma, D.B., HO, C.W., Wan Aida, W.M., (2010). Optimization of Extraction Parameters of Total Phenolic Compounds from Henna (Lawsonia inermis) Leaves. Sains Malaysiana 39 (1), 119-128 [39] Wang, N., Brennan, J.G., (1995). Changes in structure, density and
porosity of potato during dehydration. Journal of Food Engineering, 24, 61-76.
[40] Wang, S.Y., Zheng, W., (2001). Antioxidant activity and phenolic compounds in selected herbs. Journal of Agriculture and Food Chemistry 49, 5165-5170.
[41] Zaibunnisa, A.H., Norashikin, S., Mamot, S., Osman, H., (2009). An experimental design approach for the extraction of volatile compounds from turmeric leaves (Curcuma domestica) using pressurised liquid extraction (PLE). LWT– Food Science and Technology 42(1), 233–238.