International Journal of Emerging Technology and Advanced Engineering
Website: www.ijetae.com (ISSN 2250-2459, ISO 9001:2008 Certified Journal, Volume 6, Issue 3, March 2016)
Optimization in Allocating Goods to Shop Shelves
Utilizing
Genetic Algorithm–An Application to Cup Noodles/Soup
Yuki Higuchi
1, Koumei Suzuki
2, Kazuhiro Takeyasu
3 1Faculty of Business Administration, Setsunan University, Japan 2Graduate School of Humanities and Social Sciences, Shizuoka University, 836, Ohya, Suruga-ku, Shizuoka-Shi, Shizuoka-Ken, 422-8529, Japan
3College of Business Administration, Tokoha University, 325 Oobuchi, Fuji City, Shizuoka, 417-0801, Japan
Abstract — How to allocate goods in shop shelves makes great influence to sales amount. Searching best fit allocation of goods to shelves is a kind of combinatorial problem. This becomes a problem of integer programming and utilizing genetic algorithm may be an effective method. Reviewing past researches, there are few researches made on this. Formerly, we have presented a papers concerning optimization in allocating goods to shop shelves utilizing genetic algorithm. In those papers, the problem that goods were not allowed to allocate in multiple shelves and the problem that goods were allowed to allocate in multiple shelves were pursued. In this paper, we examine the problem that allows goods to be allocated in multiple shelves and introduce the concept of sales profits and sales probabilities. Expansion of shelf is executed. Optimization in allocating goods to shop shelves is investigated. An application to the convenience store with POS sales data of cup noodles and cup soup is executed. Utilizing genetic algorithm, optimum solution is pursued and verified by a numerical example. Various patterns of problems must be examined hereafter.
Keyword — display, genetic algorithm, optimization, shelf
I. INTRODUCTION
Displaying method in the shop makes influence to sales amount, therefore various ideas are devised. What kind of items should be placed where in the shop, how to guide customers to what aisle in the shop are the big issues to be discussed. Searching best fit allocation of goods to shelves is also an important issue to be solved. In this paper, we seek how to optimize in allocating goods to shop shelves.
As for allocating good to shop shelves, following items are well known (Nagashima, 2005).
Shelf height is classified as follows.
Shelf of 135cm height: Customers can see the whole space of the shop. Specialty stores often use this type.
Shelf of 150cm height: Female customers may feel pressure to the shelf height. This height may be the upper limit to look over the shop.
Shelf of 180cm height: It becomes hard to look over the shop. Therefore it should not be used for island display (display at the center or inside the shop).
Next, we show the following three functions of shelf for display.
1. Exhibition of goods function 2. Stock function
3. Display function
Effective range for exhibition is generally said to be 45cm-150cm. The range of 75cm-135cm is called golden zone especially. For the lower part under 45cm, goods are stocked as well as displaying.
Reviewing past papers, there are many papers concerning lay out problem. As for the problem of the distribution of equipment, we can see B. Korte et al. (2005), M. Gen et al. (1997) for the general research book. There are many researches made on this. Yamada et al. (2004) handles the lay out problem considering the aisle structure and intra-department material flow. Y. Wu et al. (2002) and Yamada et al. (2004) handle this problem considering aisle structure. Ito et al. (2006) considers multi-floor facility problem.
Although there are many researches on corresponding theme as stated above, we can hardly find researches on the problem of optimization in allocating goods to shop shelves.
International Journal of Emerging Technology and Advanced Engineering
Website: www.ijetae.com (ISSN 2250-2459, ISO 9001:2008 Certified Journal, Volume 6, Issue 3, March 2016)
Utilizing genetic algorithm, optimum solution is pursued and verified by a numerical example.
The rest of the paper is organized as follows. Problem description is stated in section 2. Genetic Algorithm is developed in section 3. Numerical example is exhibited in section 4 which is followed by the remarks of section 5. Section 6 is a summary.
II. PROBLEM DESCRIPTION
Shelf model is constructed as Figure 1. There are five shelf positions. Shelf position 1 is mainly to put big and heavy goods including stock function. Shelf position 3, 4 at the height of the range 75cm to 135cm are the space of golden zone. Thus, we can use shelves properly by assuming these shelves. In numerical example, we examine using these five shelves. First of all, we make problem description in the case there is only one shelf (case 1). Then we expand to the case there are multiple shelves (case 2).
Figure 1: Shelf Model
(1) Case 1: The case that there is only one shelf
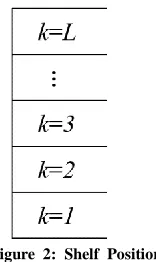
Although there are few cases that there is only one shelf, it makes the foundation for multiple shelves case. Therefore we pick it up as a fundamental one. Suppose shelf position 𝑘 is from 1 to 𝐿 (Figure 2).
Figure 2: Shelf Position
Suppose there are 𝑁 amount of goods (𝑖 = 1, ⋯ , 𝑁). Set sales profit of goods 𝑖 as 𝐻𝑖. Table 1 shows the sales probabilities when each goods is placed at each shelf position. The values in this table are written for example:
Table 1:
Sales probability for each goods
Day of the
Week Time Zone( )
Shelf =1 Shelf =2 … Shelf =
Shelf Position Shelf Position … Shelf Position
=1 … = =1 … = … =1 … =
(Mon.) 0-1( =1) 0.01 …
1-2( =2) 0.02 …
23-24( =24) 0.03
… … … …
(Sun.) 0-1( =145) 0.02
1-2( =146) 0.03 …
23-24( =168) 0.04
t
j
j
j m
k
k
L
1k
k
L
2k
k
L
mt
t
t
t
t
[image:2.612.406.484.208.339.2] [image:2.612.67.521.360.736.2]International Journal of Emerging Technology and Advanced Engineering
Website: www.ijetae.com (ISSN 2250-2459, ISO 9001:2008 Certified Journal, Volume 6, Issue 3, March 2016)
Suppose goods are sold in the period from 𝑡1 to 𝑡𝑛. In addition, a new goods 𝑖 is replenished when goods 𝑖 is sold out.
Set the accumulated sales probability of goods 𝑖 in time zone 𝑡, shelf 𝑗, and shelf position 𝑘 in the table as
𝐻 , , 𝑖 .
Then, the sales probability 𝑖, , of goods 𝑖 in the period will be described as follows.
nt i
k j t k
j i
t
t
HK
K
n 1
, , ,
, /
1
This can take the value more than 1. For example, the value 2 means that 2 amount of goods were sold during the period. Set Benefit in the sales period from 𝑡1 to 𝑡𝑛 as
𝑖, ,
(𝑖 = 1, ⋯ , 𝑁)(𝑗 = 1, ⋯ , 𝑚)(𝑘 = 1, ⋯ , 𝐿) when goods 𝑖 is placed at shelf 𝑗 and shelf position 𝑘.
Where Benefit means:
𝐵𝑒𝑛𝑒𝑓𝑖𝑡 = 𝑆𝑎𝑙𝑒𝑠 𝑟𝑜𝑏𝑎𝑏𝑖𝑙𝑖𝑡𝑦 × 𝑆𝑎𝑙𝑒𝑠 𝑟𝑜𝑓𝑖𝑡
Therefore, this equation is represented as follows.
𝑖, , =
𝑖, , 𝐻𝑖 (1)
where 𝑗 = 1 because one shelf case is considered here. Set 𝑖, as:
𝑖, = 1: Goods 𝑖 is placed at shelf position 𝑘
𝑖, = 0: Else
Suppose only one goods can be placed at one shelf position and also suppose that goods is allowed to allocate in multiple shelf positions. Then constraints are described as follows.
𝑖, = 1,0(𝑖 = 1, ⋯ , 𝑁)(𝑘 = 1, ⋯ 𝐿) (2)
∑ 𝑖, 𝑁
𝑖=1
= 1(𝑘 = 1, ⋯ 𝐿) (3)
Under these constraints,
𝑀𝑎 𝑖𝑚𝑖𝑧𝑒𝐽 = ∑ ∑ 𝑖, , 𝑖, 𝑁
𝑖=1 𝐿
=1
(4)
(2) Case 2: The case that there are
m
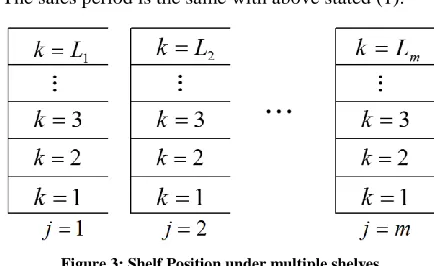
shelvesSuppose there are 𝑚 shelves (Figure 3). Set Benefit as
𝑖, , (𝑖 = 1, ⋯ , 𝑁)(𝑗 = 1, ⋯ , 𝑚)(𝑘 = 1, ⋯ , 𝐿)
where goods 𝑖 is placed at shelf position 𝑘 of shelf 𝑗.
[image:3.612.334.551.149.282.2]The sales period is the same with above stated (1).
Figure 3: Shelf Position under multiple shelves
Set 𝑖, , as:
𝑖, , = 1 : Goods is placed at shelf position 𝑘 of shelf 𝑗 𝑖, , = 0 : Else
Suppose only one goods can be placed at one shelf position and also suppose that goods is allowed to allocate in multiple shelf positions. Then constraints are described as follows. The sales period is the same with before.
𝑖, , = 1,0(𝑖 = 1, ⋯ , 𝑁)(𝑗 = 1, ⋯ , 𝑚)(𝑘
= 1, ⋯ , 𝐿) (5)
∑ 𝑖, , 𝑁
𝑖=1
= 1(𝑗 = 1, ⋯ , 𝑚)(𝑘 = 1, ⋯ , 𝐿) (6)
Under these constraints,
𝑀𝑎 𝑖𝑚𝑖𝑧𝑒𝐽 = ∑ ∑ ∑ 𝑖, , 𝑖, , 𝐿𝑗
=1 𝑚
=1 𝑁
𝑖=1
(7)
III. ALGORITHM
International Journal of Emerging Technology and Advanced Engineering
Website: www.ijetae.com (ISSN 2250-2459, ISO 9001:2008 Certified Journal, Volume 6, Issue 3, March 2016)
It is reported that GA is effective for these problems (Gen et al. (1995), Lin et al. (2005), Zhang et al. (2005)).
A. The Variables
Suppose the number of goods, shelf position, and shelfar e 20, 2, 8 respectively. In this paper, shelf is expanded from 2 to 8. Then the number of variables becomes two hundred.
𝑖, , = 1,0(𝑖 = 1, ⋯ ,20), (𝑗 = 1, ⋯ ,8), (𝑘 = 1,2)
Therefore, set chromosome as follows.
)
,
,
,
,
,
,
,
,
,
,
,
,
,
,
,
,
,
,
,
,
,
,
,
,
,
,
,
,
(
2 , 8 , 20 2 , 8 , 3 2 , 8 , 2 2 , 8 , 1 1 , 8 , 20 1 , 8 , 3 1 , 8 , 2 1 , 8 , 1 2 , 2 , 20 2 , 2 , 3 2 , 2 , 2 2 , 2 , 1 1 , 2 , 20 1 , 2 , 3 1 , 2 , 2 1 , 2 , 1 2 , 1 , 20 2 , 1 , 3 2 , 1 , 2 2 , 1 , 1 1 , 1 , 20 1 , 1 , 3 1 , 1 , 2 1 , 1 , 1x
x
x
x
x
x
x
x
x
x
x
x
x
x
x
x
x
x
x
x
x
x
x
x
X
(8)B. Initialize population
Initialization of population is executed. The number of initial population is 𝑀. Here set 𝑀 = 100. Set gene at random and choose individual which satisfies constraints.
C. Selection
In this paper, we take elitism while selecting. Choose individuals in the order which take maximum score of objective function. Here, set = 20
D. Crossover
Here, we take uniform crossover. Set crossover rate as:
𝑐= 0.7 (9)
E. Mutation
Set mutation rate as:
𝑚= 0.01 (10)
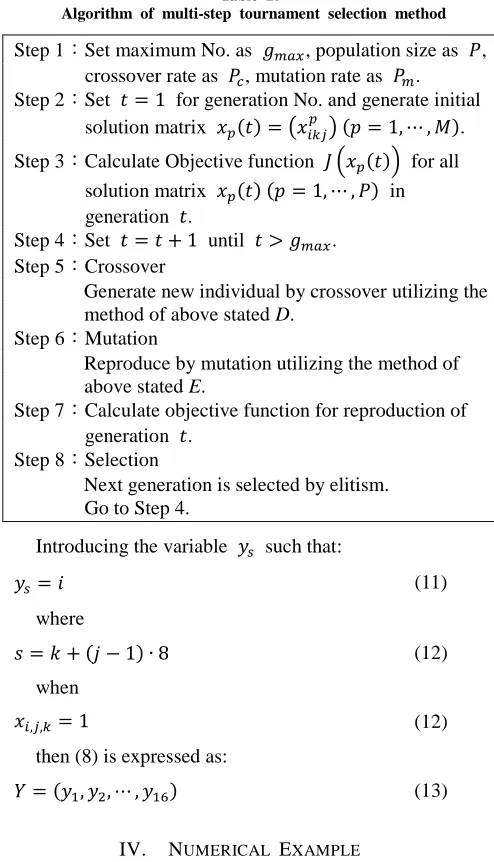
Algorithm of GA is exhibited at Table 2.
Table 2:
Algorithm of multi-step tournament selection method
Step 1:Set maximum No. as 𝑔𝑚𝑎𝑥, population size as , crossover rate as 𝑐, mutation rate as 𝑚. Step 2:Set 𝑡 = 1 for generation No. and generate initial
solution matrix 𝑝(𝑡) = ( 𝑖 𝑝 ) (𝑝 = 1, ⋯ , 𝑀).
Step 3:Calculate Objective function 𝐽 ( 𝑝(𝑡)) for all solution matrix 𝑝(𝑡) (𝑝 = 1, ⋯ , ) in generation 𝑡.
Step 4:Set 𝑡 = 𝑡 + 1 until 𝑡 > 𝑔𝑚𝑎𝑥. Step 5:Crossover
Generate new individual by crossover utilizing the method of above stated D.
Step 6:Mutation
Reproduce by mutation utilizing the method of
above stated E.
Step 7:Calculate objective function for reproduction of generation 𝑡.
Step 8:Selection
Next generation is selected by elitism. Go to Step 4.
Introducing the variable 𝑦𝑠 such that:
𝑦𝑠= 𝑖 (11)
where
𝑠 = 𝑘 + (𝑗 − 1) 8 (12)
when
𝑖, , = 1 (12)
then (8) is expressed as:
𝑌 = (𝑦1, 𝑦2, ⋯ , 𝑦16) (13)
IV. NUMERICAL EXAMPLE
[image:4.612.317.564.149.580.2]International Journal of Emerging Technology and Advanced Engineering
Website: www.ijetae.com (ISSN 2250-2459, ISO 9001:2008 Certified Journal, Volume 6, Issue 3, March 2016)
Table 3:
Unit Sales Price and Sales Profit of each goods
Lot
i
Sales Price iH
1… 20
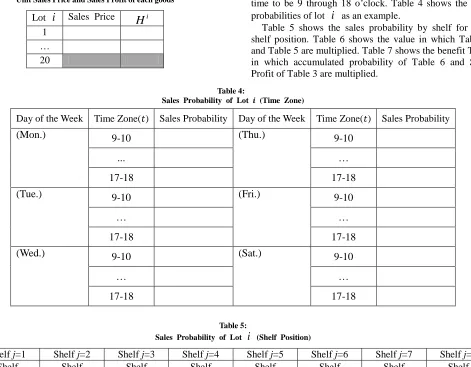
Supposing a general daytime retail store, we set opening time to be 9 through 18 o’clock. Table 4 shows the sales probabilities of lot
i
as an example.Table 5 shows the sales probability by shelf for each shelf position. Table 6 shows the value in which Table 4 and Table 5 are multiplied. Table 7 shows the benefit Table in which accumulated probability of Table 6 and Sales Profit of Table 3 are multiplied.
Table 4:
[image:5.612.73.544.156.523.2]Sales Probability of Lot 𝒊 (Time Zone)
Table 5:
Sales Probability of Lot
i
(Shelf Position)In Table 5, shelf j=2 is located near the entrance therefore the table value reflects this condition. Day of the Week Time Zone(𝑡) Sales Probability Day of the Week Time Zone(𝑡) Sales Probability
(Mon.) 9-10 (Thu.) 9-10
... …
17-18 17-18
(Tue.) 9-10 (Fri.) 9-10
… …
17-18 17-18
(Wed.) 9-10 (Sat.) 9-10
… …
17-18 17-18
Shelf j=1 Shelf j=2 Shelf j=3 Shelf j=4 Shelf j=5 Shelf j=6 Shelf j=7 Shelf j=8 Shelf
Position
Shelf Position
Shelf Position
Shelf Position
Shelf Position
Shelf Position
Shelf Position
Shelf Position
k
=1k
=2k
=1k
=2k
=1k
=2k
=1k
=2k
=1k
=2k
=1k
=2k
=1k
=2k
=1k
=2 [image:5.612.47.571.504.572.2]International Journal of Emerging Technology and Advanced Engineering
Website: www.ijetae.com (ISSN 2250-2459, ISO 9001:2008 Certified Journal, Volume 6, Issue 3, March 2016)
Table 6: Sales Probability of Lot
i
Day of
the Week Time Zone(
t
)Sales Probability
Shelf 𝑗 = 1 Shelf 𝑗 = 2 Shelf 𝑗 = 3 … Shelf 𝑗 = 7 Shelf 𝑗 = 8
k
=1k
=2k
=1k
=2k
=1k
=2 ….k
=1k
=2k
=1k
=2(Mon.) 9-10 ....
… ….
17-18 ….
(Tue.) 9-10 ….
… ….
17-18 ….
(Sat.) 9-10 ….
… ….
17-18 ….
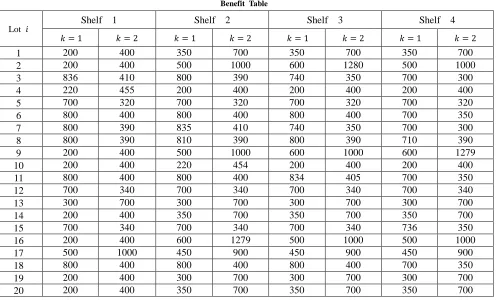
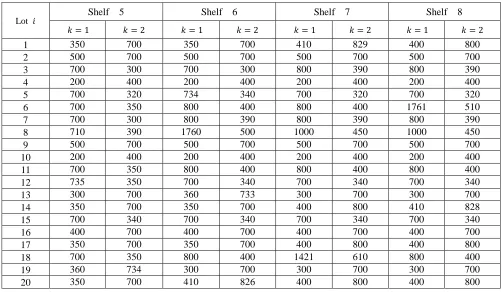
Table 7 shows the benefit when each goods is placed at each shelf position of each shelf.
Table 7: Benefit Table
Lot 𝑖
Shelf 1 Shelf 2 Shelf 3 Shelf 4
𝑘 = 1 𝑘 = 2 𝑘 = 1 𝑘 = 2 𝑘 = 1 𝑘 = 2 𝑘 = 1 𝑘 = 2
1 200 400 350 700 350 700 350 700
2 200 400 500 1000 600 1280 500 1000
3 836 410 800 390 740 350 700 300
4 220 455 200 400 200 400 200 400
5 700 320 700 320 700 320 700 320
6 800 400 800 400 800 400 700 350
7 800 390 835 410 740 350 700 300
8 800 390 810 390 800 390 710 390
9 200 400 500 1000 600 1000 600 1279
10 200 400 220 454 200 400 200 400
11 800 400 800 400 834 405 700 350
12 700 340 700 340 700 340 700 340
13 300 700 300 700 300 700 300 700
14 200 400 350 700 350 700 350 700
15 700 340 700 340 700 340 736 350
16 200 400 600 1279 500 1000 500 1000
17 500 1000 450 900 450 900 450 900
18 800 400 800 400 800 400 700 350
19 200 400 300 700 300 700 300 700
[image:6.612.62.558.373.673.2]International Journal of Emerging Technology and Advanced Engineering
Website: www.ijetae.com (ISSN 2250-2459, ISO 9001:2008 Certified Journal, Volume 6, Issue 3, March 2016)
231 Experimental results are as follows. The expression Eq. (8) is complicated. Therefore we use expression by Eq. (13).
A sample set of initial population is exhibited in Table 8.
Table 8:
A Sample Set of Initial Population
𝑌1 = ( 15 8 10 16 4 16 17 1 6 7 18 2 17 18 14 18 )
𝑌2= ( 11 10 9 2 7 18 15 10 8 20 18 13 4 4 20 10 )
𝑌99= ( 2 20 5 17 6 16 1 7 9 7 16 7 10 5 11 12 )
𝑌100= ( 8 7 7 8 11 7 18 20 8 10 6 11 20 4 5 1 ) Lot 𝑖
Shelf 5 Shelf 6 Shelf 7 Shelf 8
𝑘 = 1 𝑘 = 2 𝑘 = 1 𝑘 = 2 𝑘 = 1 𝑘 = 2 𝑘 = 1 𝑘 = 2
1 350 700 350 700 410 829 400 800
2 500 700 500 700 500 700 500 700
3 700 300 700 300 800 390 800 390
4 200 400 200 400 200 400 200 400
5 700 320 734 340 700 320 700 320
6 700 350 800 400 800 400 1761 510
7 700 300 800 390 800 390 800 390
8 710 390 1760 500 1000 450 1000 450
9 500 700 500 700 500 700 500 700
10 200 400 200 400 200 400 200 400
11 700 350 800 400 800 400 800 400
12 735 350 700 340 700 340 700 340
13 300 700 360 733 300 700 300 700
14 350 700 350 700 400 800 410 828
15 700 340 700 340 700 340 700 340
16 400 700 400 700 400 700 400 700
17 350 700 350 700 400 800 400 800
18 700 350 800 400 1421 610 800 400
19 360 734 300 700 300 700 300 700
[image:7.612.55.557.142.434.2]International Journal of Emerging Technology and Advanced Engineering
Website: www.ijetae.com (ISSN 2250-2459, ISO 9001:2008 Certified Journal, Volume 6, Issue 3, March 2016)
[image:8.612.73.552.157.431.2]232 Convergence process is exhibited in Figure 4.
Figure 4: Convergence Process of Case 2
The problem is simple, so combination of genotype for crossover saturates in the 487th generation. Genotype in which objective function becomes maximum is as follows.
𝑌 = (3,17,12,16,11,2,15,9,12,19,8,20,18,1,6,14)
This coincides with the result of optimal solution by the calculation of all considerable cases, therefore it coincides with a theoretical optimal solution. We take up simple problem and we can confirm the effectiveness of GA approach. Further study for complex problems should be examined hereafter.
V. REMARKS
As there are few papers made on this theme, we constructed prototype version before (Takeyasu et al.,2008). In this paper, we examined the problem that allowed goods to be allocated in multiple shelves and introduced the concept of sales profits and sales probabilities. An application to the shop with POS sales data was executed. We can see that genetic algorithm is effective for this problem.
In practice, following themes occur.
1. Sales probabilities should be arranged correctly.
2. There are various types of shelves corresponding to goods characteristics (For example, cold storage goods). 3. Furthermore, genotype must be devised in construction
when there are huge number of goods and shelves.
For these issues, expanded version of the paper will be built hereafter consecutively. As for 1, constraints are relaxed than those of this paper. As for 2, expansion is easy to make. As for 3, constructing genotype from the shelf side would bear much more simple expression.
VI. CONCLUSION
International Journal of Emerging Technology and Advanced Engineering
Website: www.ijetae.com (ISSN 2250-2459, ISO 9001:2008 Certified Journal, Volume 6, Issue 3, March 2016)
233 In those papers, the problem that goods were not allowed to allocate in multiple shelves and the problem that goods were allowed to allocate in multiple shelves were pursued. In this paper, we examined the problem that allowed goods to be allocated in multiple shelves and introduced the concept of sales profits and sales probabilities. Expansion of shelf was executed. Optimization in allocating goods to shop shelves was investigated. An application to the convenience store with POS sales data of cup noodles and cup soup was executed.Utilizing genetic algorithm, optimum solution was pursued and verified by a numerical example. Various patterns of problems should be examined hereafter.
REFERENCES
[1] Nagashima, Y. (2005) Shop Arrangement and Displaying (in Japanese) . Nihon-Jitsugyo-Press.
[2] Atsumi, S. (2008) Shop Lay Out (in Japanese). Jitsumu-Kyoiku-Press. [3] Kohno, H. (2006) Making Charming Shop (in Japanese). Paru-Press. [4] Korte, B., Vygeu, J. (2005) Combinatorial Optimization. Springer. [5] Gen, M., Cheng, R. (1997) Genetic Algorithms & Engineering Design.
JOHN WILEY & SONS, INC.
[6] Michalewicz, Z. (1999) Genetic Algorithms + Data Structures = Evolut ion Programs. Springer.
[7] Wu, Y., Appleton, E. (2002) The optimization of block layout and aisle structure by a genetic algorithm. Computers & Industrial Engineering, Vol.41, pp.371-382.
[8] Yamada, T., Irohara, T. and Fujikawa, H. (2004) Design methodology for the Facility Layout Problem to Consider the Aisle Structure and Int ra-Department Material Flow. JIMA, Vol.55, No.3, pp.111-120.
[9] Yamada, T. and Irohara, T. (2006) Detailed Layout Design Methodolo gy using Mixed Integer Programming and Simulated Annealing. JIMA, Vol.57, No.1, pp.39-50.
[10] Ito, T. and Irohara, T. (2006) Multi-floor Facility Layout Technique In cluding Determination of Detailed I/O
Location. JIMA, Vol.57, No.5, pp.395-403.
[11] Arial. M., Masui, Y. (2006) Optimization of maritime container-transp ortation network through the use of genetic algorithm. Japan Ship-Mari ne Engineering Society, Vol.4, pp.55-61.
[12] Gen, M., Ida, K., Li, Y. (1995) Solving multi objective solid transporta tion problem by genetic algorithm. JIMA, Vol.46, No.5, pp.445-454. [13] Toyama, H., Ida, K., Teramatsu, C. (2006) A proposal of a genetic algo
rithm for fixed-charge transportation problem and related numerical ex periments. JIMA, Vol.57, No.3, pp.227-230.
[14] Takeyasu, K., Higuchi, Y.,(2008) Optimization in Allocating Goods to Shop Shelves.The Journal of Economic Studies, Osaka Prefecture Uni versity, Vol.54, No.3, pp.55-64.
[15] Takeyasu, K., Higuchi, Y. (2011) Optimization in Allocating Goods to Shop Shelves. International Journal of Information Syste ms for Logistics and Management. Vol.6, No.2, pp.1-6.
[16] Takeyasu, K., Higuchi, Y.,Nakajima, H.,(2012) Optimization in Al locating Goods to Shop Shelves Utilizing Genetic Algorithm. Pro ceedings of the Asia Pacific Industrial Engineering & Managemen t Systems Conference 2012
[17] Shitara, A., Higuchi, Y., Takeyasu, D., Takeyasu, K. (2015a) Opti mization in Allocating Goods to Shop Shelves Utilizing Genetic Algorithm under the Introduction of Sales Probabilities. Journal of Communication and Computer Vol.12, pp.155-163.