Improving Indoor Air Quality (IAQ) in Kuwaiti Housing
Developments at Design, Construction, and Occupancy Stages
Walid H.D Alrazni
School of the Built Environment College of Science and Technology
University of Salford, Salford, UK
Acknowledgement
First of all, I would like to appreciate God (the most gracious, the most merciful). I would also like to acknowledge my father (God bless his soul). My father was an inspiration for me. As a matter of fact, the PhD is for him. As he’s not here with us, I’m sure watching and he’s happy to see me have this honour. And of course, my mother who gave me emotional support during the tough periods of writing this thesis.
I would also like to appreciate my wife and my kids, my brothers, who stood with me in the bad days, and my supervisor, Dr Yusuf Ariyici. My gratitude goes to Prof. Ghassan Aouad for his support and enlightenment on the topic, and Dr Omar Alawad for his friendship and advice.
Table of Contents
ACKNOWLEDGEMENT ... I TABLE OF CONTENTS ... II LIST OF FIGURES ... VII LIST OF TABLES ...X LIST OF ACRONYMS ... XII ABSTRACT ... XIV
1 CHAPTER ONE| INTRODUCTION ... 1
1.1 BACKGROUND TO THE RESEARCH ... 1
1.2 RESEARCH RATIONALE ... 3
1.3 RESEARCH QUESTIONS ... 4
1.4 AIM ... 4
1.5 OBJECTIVE ... 5
1.6 JUSTIFICATION AND CONTRIBUTION TO KNOWLEDGE ... 5
1.7 CONCEPTUAL FRAMEWORK... 6
1.8 ETHICAL ISSUES OF THE STUDY ... 7
1.9 THESIS GUIDE ... 7
2 CHAPTER TWO| LITERATURE REVIEW ... 10
2.1 INTRODUCTION ... 11
2.2 WHAT IS INDOOR AIR QUALITY (IAQ)? ... 11
2.3 INDOOR AIR QUALITY AND OCCUPANTS’ WELLBEING ... 12
2.4 BUILDINGS ILLNESSES ... 17
2.4.1 Sick Building Syndrome ... 17
2.4.2 Building Related Illnesses ... 18
2.5 INDOOR CONTAMINANTS ... 19
2.6 BENEFITS OF GOOD IAQ ... 23
2.7 VENTILATION IN RELATION TO POLLUTION SOURCES ... 24
2.8 VENTILATION SYSTEMS ... 26
2222.8.1Natural Ventilation systems ... 26
2.8.2 Mechanical Ventilation Systems ... 27
2.8.3 Hybrid Ventilation Systems ... 28
2.9 SOURCES OF INDOOR AIR POLLUTANTS ... 30
2.10 SUSTAINABLE ARCHITECTURE AND URBAN DEVELOPMENT ... 31
2.11 SUSTAINABLE ARCHITECTURE AND BUILDING CONSTRUCTION ... 34
2.12 HEALTHY BUILDINGS ... 35
2.12.1 Thermal Comfort and Health ... 36
2.12.2 Acoustic Performance ... 39
2.12.3 IAQ and Energy Use ... 40
2.13 IAQ STANDARDS AND REGULATIONS ... 42
2.14 IMPROVING IAQ AT DESIGN, CONSTRUCTION AND OCCUPANCY ... 46
2.14.1 Design ... 46
2.14.3 Commissioning and operation ... 51
2.14.4 Maintenance ... 52
2.14.5 Renovations ... 54
2.14.6 Quality Control ... 55
2.15 SOLUTIONS TO POOR IAQ AT OCCUPANCY STAGE ... 55
2.16 DISCREPANCY IN INTERNATIONAL STANDARDS & GUIDELINES ... 61
2.17 SUMMARY ... 62
3 CHAPTER 3| KUWAIT, IAQ, AND REGULATIONS AND STANDARDS ... 64
3.1 INTRODUCTION ... 65
3.2 KUWAIT DEMOGRAPHIC ... 65
3.3 CLIMATE CONDITION OF KUWAIT ... 67
3.4 KUWAIT ENVIRONMENT ... 69
3.4.1 Greenhouse Gas Emission in Kuwait ... 69
3.4.2 Vulnerability and Adaptation ... 70
3.5 KUWAIT POLLUTION RISK FROM TRANSPORTATION ... 71
3.5.1 Major Pollution Sources and Activities within the State of Kuwait... 72
3.5.2 Primary Pollutants Monitoring. ... 73
3.5.3 Secondary Pollutants. ... 73
3.5.4 Health Impact... 74
3.6 KUWAIT STUDIES IN IAQ ... 74
3.7 GREENHOUSE GAS MITIGATION ... 75
3.8 TECHNOLOGY NEEDS ASSESSMENT ... 76
3.9 RULES AND REGULATIONS. ... 77
3.10 SUMMARY ... 77
4 CHAPTER 4| RESEARCH METHODOLOGY ... 79
4.1 INTRODUCTION ... 80
... 81
4.2 RESEARCH PHILOSOPHY ... 81
4.2.1 Ontology ... 81
4.2.2 Epistemology ... 82
4.2.3 Pragmatism ... 83
4.3 THE PHILOSOPHICAL STANCE OF THIS RESEARCH ... 84
4.4 RESEARCH APPROACH ... 84
4.4.1 Deductive approach ... 84
4.5 RESEARCH STRATEGY ... 85
4.5.1 Triangulation ... 88
4.6 SELECTED RESEARCH STRATEGY IN THIS THESIS ... 88
4.7 RESEARCH CHOICES ... 89
4.8 RESEARCH DESIGN ... 89
4.9 RESEARCH TECHNIQUE ... 92
4.10 SAMPLING ... 93
4.11 SAMPLE SELECTION CRITERIA ... 96
4.12 METHODS FOR DATA COLLECTION ... 96
4.12.1 Quantitative data collection ... 97
4.12.2 Qualitative data collection ... 97
4.13 METHODS OF DATA ANALYSIS ... 98
4.13.1 Content analysis ... 98
4.13.2 Statistical analysis ... 99
4.14 LIMITATIONS OF THE STUDY ... 99
4.15 SUMMARY ... 100
5 CHAPTER 5| DATA COLLECTION AND ANALYSIS ... 101
5.1 INTRODUCTION ... 102
5.2 SAMPLE DESCRIPTION... 102
5.3 UNDERSTANDING OF IAQ ... 107
5.4 IAQ AND VALUE ENGINEERING PROCESS ... 111
5.5 STANDARDS AND REGULATIONS OF IAQ ... 112
5.6 CURRENT PRACTICES TO ACHIEVING IAQ IN KUWAIT HOUSING DEVELOPMENT ... 123
5.7 DESIGN INTEGRATION AND INCLUSION OF IAQ OBJECTIVES EARLY IN DESIGN ... 129
5.7.1 Inclusion of IAQ Specialist During Design Stage... 132
5.8 BARRIERS TO GOOD IAQ ... 133
5.8.1 Cost or Budget ... 134
5.8.2 Lack of enforceable IAQ Codes and Standards ... 135
5.8.3 Lack of Awareness ... 136
5.8.4 Lack of design integration ... 138
5.8.5 Distrust of the competence level of local IAQ companies ... 141
5.8.6 Habit and age ... 141
5.8.7 Low level of IAQ education amongst designers and engineers ... 142
5.8.8 Lack of training ... 142
5.9 DRIVERS OF GOOD IAQ IN KUWAIT ... 143
5.9.1 Clients/End-users ... 145
5.9.2 Architects, designers and other construction professionals ... 146
5.9.3 Government ... 147
5.10 STATISTICAL ANALYSIS OF RESULTS... 149
5.11 SUMMARY ... 151
6 CHAPTER 6| FRAMEWORK DEVELOPMEN ... 154
6.1 INTRODUCTION ... 155
6.2 LEADERSHIP AND COMMUNICATION TO ENSURE GOOD IAQ ... 157
6.3 STRATEGIC DEFINITION ... 160
6.3.1 Quality Assurance ... 161
6.3.2 Integrated Project Delivery Approach... 161
6.4 PREPARATION AND BRIEF ... 161
6.4.1 Integrated Project Design ... 164
6.4.2 Commissioning of Owner’s IAQ Project Requirements ... 166
6.4.4 Quality Assurance ... 168
6.5 CONCEPT DESIGN ... 170
6.5.1 Integrated Project Design ... 170
6.5.2 Commissioning of Concept Design ... 172
6.5.3 Scheduling and Sequencing ... 173
6.5.4 Quality Assurance and Documentation ... 175
6.6 DETAILED DESIGN ... 176
6.6.1 Integrated Project Design ... 177
6.6.2 Commissioning of Detailed Design ... 177
6.6.3 Scheduling and Sequencing ... 179
6.7 CONSTRUCTION ... 179
6.7.1 Integrated Project Delivery ... 179
6.7.2 Scheduling and Sequencing ... 180
6.7.3 Commissioning of construction activities and assemblies ... 181
6.8 HANDOVER AND CLOSE OUT... 182
6.8.1 Building Flushout... 182
6.8.2 Training of Client/Occupants ... 183
6.8.3 Operations and Maintenance documentation ... 184
6.8.4 Training and support for facilities managers ... 184
6.9 SUMMARY ... 187
7 CHAPTER 7| VALIDITY AND RELIABILITY ... 189
7.1 WHAT IS VALIDITY AND/OR RELIABILITY? ... 190
7.2 EVALUATION OF QUALITATIVE RESEARCH ... 191
7.2.1 Member Checking ... 191
7.2.2 A thorough description of the research context ... 196
7.2.3 Thorough description of the research methodology ... 196
7.2.4 Rich Description of Research Findings ... 196
7.2.5 Triangulation ... 197
7.2.6 Presenting opposing information ... 197
7.2.7 Examination of previous research findings ... 198
7.3 SUMMARY OF CONTRIBUTIONS OF THE VALIDATION PROCESS TO THE RESEARCH ... 198
8 CHAPTER 8| CONCLUSION AND RECOMMENDATIONS ... 205
8.1 CONCLUSION ... 206
8.2 RESEARCH KEY FINDINGS ... 206
8.3 CONTRIBUTION TO KNOWLEDGE... 210
8.4 RECOMMENDATIONS OF THE RESEARCH ... 210
8.5 FURTHER RESEARCH ... 212
9 REFERENCES ... 214
10 APPENDICES ... 228
APPENDIX 1: DEFINITION OF TERMS ... 229
APPENDIX 3: INTERNATIONAL LABELLING SCHEMES FOR LOW-VOC EMITTING PRODUCTS
... 234
APPENDIX 4: AMBIENT AIR QUALITY FOR RESIDENTIAL AREA IN KUWAIT ... 236
APPENDIX 5: INTERVIEWS QUESTION ... 237
List of Figures
Figure 1.1: Conceptual Framework ... 6
Figure 2.1: Time typically spent indoors and outdoors ... 12
Figure 2.2: Daily time allocation (Source; Jacobs et al., 2007) ... 13
Figure 2.3: Understanding indoor air quality (Brooks and Davis, 1992) ... 13
Figure 2.4: Logarithmical length scale showing size of nanomaterials compared to biological components and definition of 'nano' and 'micro' sizes ... 21
Figure 2.5: Pollution sources for indoor and outdoor air quality (source, EC, 2003) ... 25
Figure 2.6: The Role of ventilation in relation to total air exposure (Source: EC, 2003)... 26
Figure 2.7: Proposed real-time implementation for HVAC control system ... 28
Figure 2.8: Merging the best of natural and mechanical ventilation. Source (EC, 2003) ... 29
Figure 2.9: The three pillars of sustainability suggest that both economy and society are constrained by environmental limits (Cato, 2009) ... 32
Figure 2.10: Scheme of Sustainable Development (Adams, 2006). ... 33
Figure 2.11: Aspects of Sustainable Development (Evans, 2007) ... 33
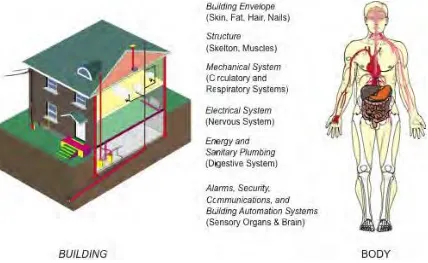
Figure 2.12: The building as an analogue of the human body now forms the contemporary basis of the building as a system concept (Kesik, 2008) ... 36
Figure 2.13: PMV and Thermal Sensation (Source, Atthajariyakul and Leephakpreeda, (2004)... 38
Figure 2.14: Outdoor climate and indoor climate characteristics strongly influence the energy use of buildings ... 40
Figure 2.15: Typical relation between ventilation rate, concentration and the energy use for ventilation ... 42
Figure 2.16: Various performance related aspects of ventilation systems... 45
Figure 2.17: Traditional Approach of Achieving IAQ ... 47
Figure 2.18: Integrated Approach of achieving IAQ ... 49
Figure 2.19: Construction Activities to facilitate good IAQ (Source, ASHRAE, 2009) ... 50
Figure 3.1: Map of the State of Kuwait (Source: KEPA, 2012) ... 65
Figure 3.3: Population age and gender characteristics (source: KEPA, 2012) ... 66
Figure 3.4: Kuwait average monthly temperature, 1962-2008 (source, KEPA, 2012) ... 67
Figure 3.5: Kuwait average monthly rainfall, 1962-2008 (source, KEPA, 2012) ... 68
Figure 3.6: Dust storm approaching Kuwait City on 25 March 2011 (Source: KEPA, 2012) 69 Figure 3.7: Possible local sources of pollutants to Kuwait City (Source: Al-Awadhi, 2014). 72 Figure 3.8: Impact of GHG mitigation option, 1994-2020 (source: KEPA,2012) ... 76
Figure 4.1: Research Onion (Saunders et al., 2009) ... 80
Figure 4.2: Nested Approach of research methodological design (Kagioglou et al., 2000) .... 81
Figure 4.3: Qualitative and quantitative methods and techniques (Source: Ghauri et al., 1995). ... 96
Figure 5.1: Illustrating percentages of the Gender categories ... 103
Figure 5.2: Illustrating percentages of the Age categories ... 104
Figure 5.3: Illustrates education percentages in the study sample ... 105
Figure 5.4: Illustrating percentages of the “Job” Designation categories in the study sample ... 106
Figure 5.5: Illustrating percentages of the years of experience categories ... 107
Figure 5.6: Illustrating percentages of understanding of IAQ ... 109
Figure 5.7: Illustrating percentages of decision maker’s knowledge of IAQ rules in Kuwait ... 110
Figure 5.8: IAQ part of value engineering process ... 111
Figure 5.9: Illustrating percentages of implementing IAQ rules in both design and construction phases ... 114
Figure 5.10: Illustrating percentages of government enforcement of ventilation system and IAQ strategy ... 115
Figure 5.11: Rating of government enforcement of IAQ laws at design ... 116
Figure 5.12: Use of label schemes to ensure good IAQ ... 119
Figure 5.13: Government monitoring and enforcement of ventilation system and IAQ rules during and after construction ... 120
Figure 5.15: Private sector compliance to IAQ rules and standards ... 123
Figure 5.16: Current process of achieving IAQ in Kuwait housing developments ... 126
Figure 5.17: Barriers to achieving IAQ according to respondents ... 134
Figure 5.18: Drivers of good IAQ in Kuwait ... 145
Figure 5.19: The role of the government in creating awareness of good IAQ practices ... 148
Figure 5.20: Mean values representation for each question in the survey ... 151
Figure 6.1: Flowchart of Framework for achievement of Good IAQ in Kuwait Housing Development at pre-construction, construction, and post construction ... 160
Figure 6.2: Decreasing ability to influence Outcomes and Increasing Cost of Action as Project Proceeds (Source: ASHRAE, 2009) ... 169
Figure 6.3: Framework for Good IAQ in Kuwait Housing Development ... 186
Figure 7.1: Final Flowchart for achieving good IAQ in Kuwait Housing Developments ... 201
List of Tables
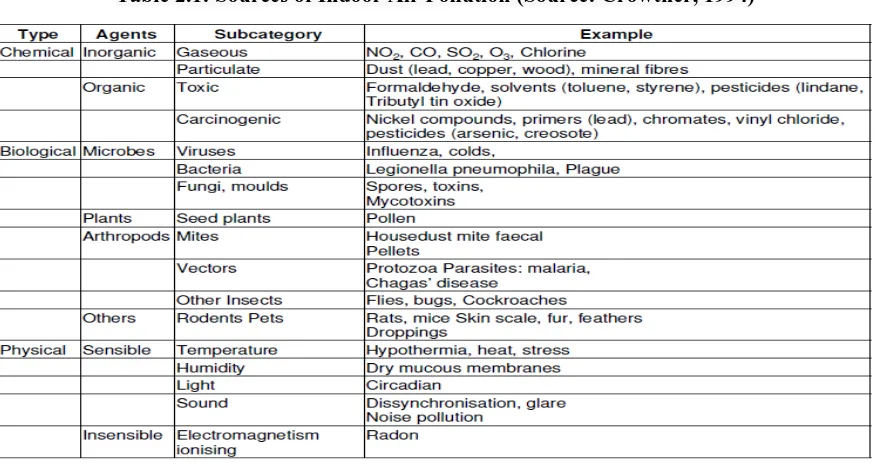
Table 2.1: Sources of Indoor Air Pollution (Source: Crowther, 1994) ... 14
Table 2.2: Sources and Types of Indoor Air Pollution(Crump et al., 2009) ... 19
Table 2.3: Ventilation strategies for better indoor air quality and energy efficiency (Source: Seppanen, 1998) ... 29
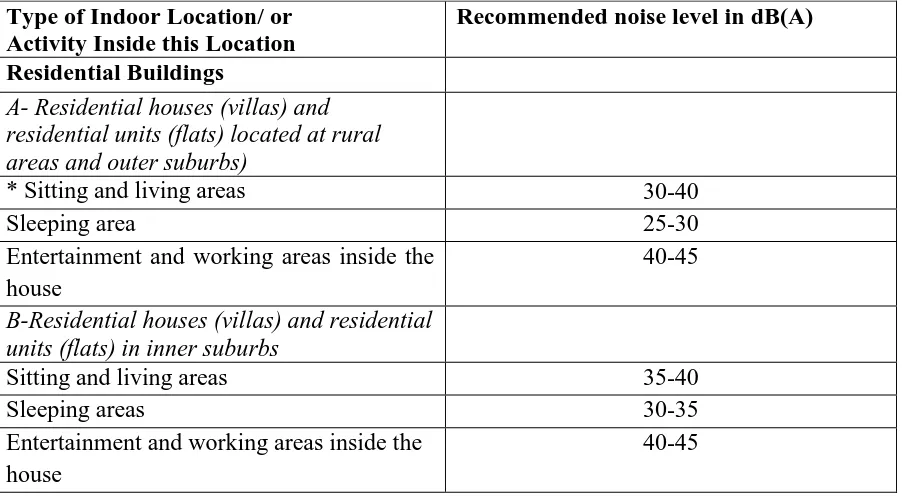
Table 2.4: Maximum limits allowed for indoor noise in residential environments in Kuwait. ... 39
Table 2.5: End Use energy consumption in selected European cities ... 41
Table 2.6: Comparison of air supply requirements in various European countries ... 44
Table 2.7: IEE recommendations for the maintenance of building and ACMV systems ... 52
Table 2.8: Common Indoor Pollutant ... 61
Table 3.1: Total Green House Gas Emission in Kuwait, 1994 (Gg) (source: KEPA,2012) .... 70
Table 3.2: Extent of inundated area and population at risk under the SLR scenerios (source: KEPA,2012) ... 71
Table 3.3: International and Kuwait Standards and Guidelines for Common Indoor Air Pollutants (in ppm) ... 78
Table 4.1: Quantitative and Qualitative research according to their respective natures ... 86
Table 4.2: Research Process ... 90
Table 4.3: Purposeful/Purposive Sampling Strategies ... 95
Table 5.1: Total number of respondents and gender percentages ... 102
Table 5.2: Frequencies and percentages of Age ... 103
Table 5.3: Frequencies and percentages of Education ... 104
Table 5.4: Frequencies and percentages of Designation “Job”... 105
Table 5.5: Frequencies and percentages of years of experience ... 106
Table 5.6: General understanding of IAQ standards at design and construction... 107
Table 5.7:Decision maker’s knowledge of IAQ rules in Kuwait... 109
Table 5.8: Implementing IAQ rules in both design and construction phases ... 112
Table 5.10:Rating of government enforcement of IAQ laws at design ... 115
Table 5.11: Use of label schemes to ensure good IAQ ... 118
Table 5.12: Government monitoring and enforcement of ventilation system and IAQ rules at construction and post construction stages ... 119
Table 5.13: Government monitoring agencies implementation of IAQ standards ... 120
Table 5.14: Private sector compliance to IAQ rules and standards ... 121
Table 5.15: The role of government in creating awareness of good IAQ practices ... 147
Table 5.16: Means and standard deviations for the surveys' questions ... 149
Table 6.1: Project Brief for Design and Construction items ... 163
Table 7.1: Validation exercise participation rate ... 192
List of Acronyms
KEPA Kuwait Environment Public Authority IAQ Indoor Air Quality
EC European Commission
HVAC Heating Ventilation and Air Conditioning
ASHRAE American Society of Heating, Refrigerating, and Air-Conditioning Engineers. ACMV Air Conditioning and Mechanical Ventilation
WHO World health Organization M&E Mechanical and Electrical OAQ Out-door Air Quality
IAQM Indoor Air Quality Management REF Research Ethics Framework
ESRC Economic and Social Research Council
USEPA United States Environmental Protection Agency ROI Return On Investment
ETS Environmental Tobacco Smoke SBS Sick Building Syndrome BRI Building Related Illness
IEE Institute of Environmental Epidemiology VOCs Volatile Organic Compounds
VVOC Very Volatile Organic Compound SVOCs Semi-volatile organic compounds PAHs Polycyclic Aromatic Hydrocarbons MVOCs Microbial Volatile Organic Compounds COPD Chronic Obstructive Pulmonary Disease CVD Cardio-Vascular Disease
SD Sustainable Development PMV Predicted Mean Vote
AC Air Conditioning
EPD Energy Performance Directive HRV Heat Recovery Ventilators
GIS Geographic Information System
ISAAC International Study of Asthma and Allergies in Childhood LEED Leadership in Energy and Environmental Design
IEEE Institute of Electrical and Electronics Engineers KIEM Kuwait Institute of Environmental Management
KISR Kuwait Municipality, Kuwait Institute of Science and Research OPR Owner’s Project Requirements
RIBA Royal Institute of British Architects
BoD Basis of Design
BIM Building Information Modelling CAD Computer Aided Design
Abstract
There are many sources of outdoor pollution in Kuwait which then makes natural ventilation a poor mechanism for good Indoor Air Quality (IAQ). Therefore, a mechanical or hybrid ventilation system is necessary. First of all, Kuwait is situated in the northeast of the Arabian Peninsula in Western Asia with a desert weather climate. The prevailing wind is north and northeast and that causes sand storms. Also most of the towns and cities are situated and constructed within the vicinity of many industrial sites, petroleum downstream/upstream facilities (including Kuwait's three refineries, petrochemical complexes, crude oil production points etcetera) and many small industries. Most housing construction projects, as well as schools, commercial and governmental buildings are built in the downwind of the polluted air emitted from such plants, therefore, there is the potential for consequential health effects related to the ambient air. As a result, there is a prevalence of asthma and rhinitis among the schoolchildren in Kuwait. The estimated prevalence of asthma among school children was 22.4% and that of rhinitis was 23% (Abal et al., 2010).
It was evident from a preliminary study that indoor air quality (IAQ) in Kuwait housing is under-researched and there is a clear lack of awareness amongst building stakeholders (Architects and Designers, M&E Engineers, User, etc.) of the harmful effects of chemicals that exist inside buildings. The risk of poor Indoor Air Quality (IAQ) is increased by a lack of proficient knowledge of how numerous factors can contribute to poor IAQ, both during design, construction and after occupancy. As a result, the study set out to: research previous related research studies in the field of IAQ, identify the current status quo of IAQ in Kuwait, conduct a survey (questionnaires and interviews) with Kuwait construction professionals regarding IAQ issues and to find the barriers to implementing IAQ best practice in all stages of the project, and then finally, to develop a framework for achieving good IAQ in Kuwait housing projects.
stakeholders at the design stage, hence team member’s valuable input on achieving good IAQ at design stage is lost. Furthermore, the process did not emphasize the following at every stage of the project to ensure good IAQ: commissioning of the ventilation design and installation, which includes value engineering, proper sequencing and scheduling of activities to avoid dust or debris from contaminating the ventilation system, proper documentation and reporting to ensure the owner’s project objectives are documented, achieved, checked, and carried over to the next stage.
The findings show that the barriers to achieving good IAQ in Kuwait housing developments are; cost and budget, government enthusiasm, lack of awareness, lack of enforceable codes and standards, lack of design integration, distrust of the competence level of local IAQ companies, habit and age, low level of IAQ education, and lack of training. While, the drivers of good IAQ in Kuwait housing are; the client/end-user, the government, architects, designers, IAQ consultants, construction professional societies, contractors and manufacturers.
1.1
Background to the Research
Kuwait is located in the northeast of the Arabian Peninsula in Western Asia with a desert weather climate. The prevailing wind is north and northeast and that causes sand storms. Also most of the towns and cities are situated and constructed within the vicinity of many industrial sites, petroleum downstream/upstream facilities (including Kuwait's three refineries, petrochemical complexes, crude oil production points etcetera) and many small industries (Al-Salem and Khan, 2008). Most housing construction projects, schools, commercial and governmental buildings are built in the downwind of the polluted air emitted from such plants, therefore, there is the potential for consequential health effects related to the ambient air (Bouhamra, 1996; Bouhamra and Elkilani, 2001; Bouhamra, 2012). This explains the high prevalence of asthma and rhinitis among the schoolchildren in Kuwait. The estimated prevalence of asthma among school children was 22.4% and that of rhinitis was 23% (Abal et al., 2010).
From the literature review, it was evident that indoor air quality (IAQ) in Kuwait buildings is under-researched and there is a clear lack of awareness amongst building stakeholders of the harmful effects of chemicals that exist inside buildings (Khamees and Alamari, 2009). This research proposes a framework that will enable project stakeholders in Kuwait to tackle these issues, because whilst the literature review revealed that there is an abundance of research donw on indoor air quality (IAQ) in developed countries like the USA, the UK, Germany, Canada, and Japan, there is very little research done for the state of Kuwait. Indoor environments consist of seven factors that can impact the health of humans. These factors have been called the "Seven Sisters." The factors comprise of “indoor air quality, lighting,
temperature, sound and vibration (acoustic), electromagnetic fields, flora and fauna, and the psychological and social environment” (Dumont, 2008a).
(IAQ) is increased by a lack of proficiency and knowledge of how the numerous factors can contribute to poor IAQ, both during design and construction and after occupancy (Kibert, 2005, Kibert and Grosskopf, 2007). Bluyssen et al (2010), in a study and consultation with different stakeholders (producers of construction products, architects and housing corporations) from the Netherlands, the UK, Denmark, Sweden, France and the Czech Republic, concluded that “the general awareness of what IAQ is, how to improve it, and who should or can undertake actions, is poor” (Bluyssen et al, 2010). The gaps were as follows:
Lack of awareness of IAQ with all stakeholders (i.e. architects, product producers, general public, representatives of users), but most of all with the user. The end-user needs to acquire a good knowledge of IAQ.
Lack of proper regulation: as long as appropriate regulation is lacking no one feels responsible.
Lack of communication between stakeholders of the building process.
According to Mølhave and Krzyzanowski (2003) the World Health Organisation (WHO) ‘Working Group’ convened in year 2000 to agree on a set of statements on “The right to healthy indoor air”, derived from fundamental principles in the fields of human rights, biomedical ethics and ecological sustainability. These statements inform the individuals and groups responsible for healthy indoor air about their rights and obligations, and empowered the general public by making people familiar with those rights (WHO, 2000a, Mølhave and Krzyzanowski, 2003).
2010). According to a study to assess people’s awareness about indoor air pollutants and the effects on health, the result showed a very low level of awareness among Kuwaiti students, however, teachers did demonstrate more awareness, but the overall result showed a general lack of awareness and knowledge among the participants (Khamees and Alamari, 2009) .
Therefore, it is not only important to create awareness and mitigate against the effects of poor IAQ in existing buildings, it is important to get a ‘heads start’ right from the project level. All project participants that have some influence on IAQ (Architects and Designers, M&E Engineers, User, etc.) must be involved. When projects are managed and controlled in a manner that eliminates or reduce the possibility of moulds growing, dampness occurring, materials emitting toxics gases in building, out door air quality (OAQ) compromising (IAQ), etcetera; then families can be safe, children would avoid unnecessary exposure to toxic gases, and we would have healthy homes.
1.2
Research Rationale
Indoor air quality is a major contributor to the quality of people’s lives and is affected by the presence of many pollutants related to building materials, furnishings, and human activities. This is a very serious problem in most industrial and developed countries around the globe, and Kuwait indoor environment is no exception.
Most Kuwaiti residents are aware that outdoor air pollution can damage their health, but may not know that indoor air pollution can also have significant effects (Khamees and Alamari, 2009). Many people are oblivious about the different indoor generated pollutants that exist within the walls of our homes. Without adequate circulation, humans are exposed to different indoor pollutants that; are trapped within the home, and can cause serious health problems. Kuwait is a hot arid climate, and as such, most people tend to spend a high percentage of their time indoors, thus increasing exposure to indoor air pollutants. In addition, buildings are well sealed from the outside to increase the efficiency of heating and ventilating air conditioning systems (HVAC) for indoor air quality (IAQ) and thermal comfort. This again, increases exposure to built-up indoor air pollutants. IAQ can be defined as the nature of air that affects an occupant’s health and wellbeing (Bauhamra and Elkilani, 2001).
pollutants, preventing them from escaping outside. Additionally, no fresh air supply exists other than insufficient air infiltrating from outside through doors, windows or cracks on wall systems. Therefore, pollutant concentrations could increase to such a level that it is higher than outdoors, adding to this problem there are neither building regulations nor codes which exist to control the pollutants indoors during the architectural design phase nor construction process phase. There are no enforceable indoor air quality standards; therefore, indoor air could be more polluted, indeed many times more than outdoors causing very serious illness and concern (Bouhamra 1996).
Achieving ‘good IAQ’ in Kuwaiti housing through proper design, construction, and maintenance, is the aim of this research. Good IAQ is defined by the absence of harmful or unpleasant constituents (ASHRAE, 2009). Many poor design decisions can lead to poor IAQ. For example; having inadequate space for mechanical equipment, limiting access for inspection and maintenance, and selection of interior finishes that can lead to high levels of volatile organic compound (VOC) emissions (ASHRAE, 2009). Such decisions are usually made in the early stages of design and are difficult to modify or correct later on. Basic, early, design decisions related to site selection, building orientation, and location of outdoor air intakes and decisions on how the building will be heated, cooled, and ventilated are of critical importance to providing good IAQ (ASHRAE, 2009). If all project stakeholders commit to ‘good IAQ’ from the early stages of design, and maintain that level of commitment through construction and occupancy then, we will have more high performing and healthy buildings in Kuwait.
1.3
Research Questions
How do we improve IAQ in Kuwaiti Housing Developments at Design, Construction, and Occupancy Stage?
1.4
Aim
The aim is to develop a framework for improving Indoor Air Quality (IAQ) in Kuwaiti Housing Developments at Design, Construction, and Occupancy Stage.
1.5
Objective
1. To explore previous related research studies in the field of IAQ 2. To identify the current status quo in IAQ in Kuwait
3. To conduct a survey with Kuwait construction professionals regarding IAQ issues and to find the barriers to implementing IAQ best practice in all stages of the project. 4. To develop a framework for achieving good IAQ in Kuwait housing development. 5. To refine and validate the framework.
1.6
Justification and Contribution to Knowledge
Indoor air pollution may cause or aggravate illnesses (Daisey et al., 2003, Mendell, 2007), increase mortality (WHO, 2010), and have a major economic and social impact (Fisk and Rosenfeld, 1997, Fisk, 2011). Most people spend 90% of their time indoors: at home, in school, in shopping malls, in offices (Bouhamra 1996). Indoor air research is a multidisciplinary task, highly skilled teams including scientists from various disciplines such as medicine, chemistry, biology, engineering, architecture, and building sciences are generally required (Maroni, 1995). In Kuwait, outdoor air is regulated by the Kuwait environment authority, and studies conducted in Kuwait showed ambient air is polluted many more times in urban areas than the international standard (Bouhamra 1996; (Bouhamra 2012). Additionally, the Kuwait environment authority have specific guidelines for some pollutants in outdoor air and some guidelines for industrial buildings, but no specific indoor air standards nor guidelines (Bouhamra and Elkilani, 2001).
Pre-Construction, Construction, and Occupancy Stage; and this will be a useful tool for decision makers and key stakeholders on construction projects so that good IAQ can be achieved for the sake of occupants, and owners alike.
1.7
Conceptual Framework
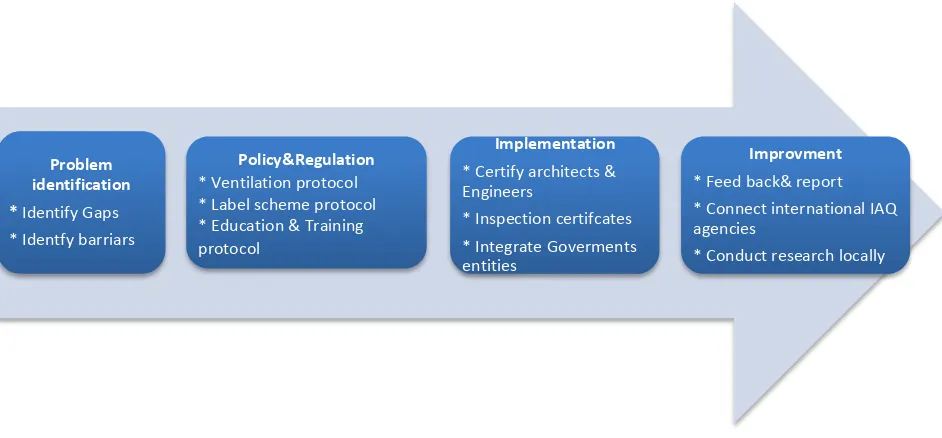
From face value, of the researcher’s industry experience and interaction with professionals in the industry in Kuwait and some literature review on indoor air quality improvements on projects, the below conceptual framework appeared to be the process to achieve IAQ improvements on Kuwaiti Housing developments.
[image:23.595.78.549.519.738.2]Firstly, the research realised that in Kuwait, the problem and barriers of IAQ improvements need to be identified. Secondly, policies and regulations need to be drafted by the Kuwait Municipality, as there is currently no governing document in Kuwait that construction professionals can refer to for standards and regulations. The only accessible documents are international standards such as ASHRAE. Construction professionals in Kuwait need also to be educated and trained in these policy and regulation document so that proper implementation can be achieved. Thirdly, proper implementation would involve inspections from the Kuwait Municipality and also certification of architects and engineers with respect to their knowledge and achievement of good IAQ on their projects. Fourth and lastly, results of good IAQ are documented and fed back into the process as a form of knowledge management for future use.
Figure 1.1: Conceptual Framework
Policy&Regulation * Ventilation protocol * Label scheme protocol * Education & Training protocol
Implementation * Certify architects & Engineers
* Inspection certifcates * Integrate Goverments entities
Improvment * Feed back& report * Connect international IAQ agencies
* Conduct research locally Problem
1.8
Ethical Issues of the study
It is part of academic research to state the ethics that guided the research. The sample group that were chosen to participate came from a pool of construction professionals whose duties or responsibilities on a housing project affected achievement of good IAQ directly or indirectly in Kuwait. For example, architects and designers, contractor, facilities manager, mechanical and electrical (M&E) engineers, IAQ and HVAC specialists, etcetera. The individuals that participated in the research were assured of the confidentiality or their responses and that they both their names and companies will remain anonymous. The invitation letter for participation included anonymity and confidentiality clauses as well as the brief review of the research, the reason why their participation mattered, and that participation was completely voluntary, which meant they could pull-out at anytime if they did were not happy about it. The participants were also given a rough idea of how long the interview or questionnaire will take to complete should they choose to participate or respond. Finally, the respondents or participants were assured that after the research the data collected will be handle according to the Research Ethics Framework (REF) set out in the Economic and Social Research Council (ESRC, 2010).
1.9
Thesis Guide
The researcher intends to affirm the originality of the research study by stating that the study is the first of its kind to be carried out in the area of improving good IAQ in Kuwait housing developments at design, construction and post construction stages.
Chapter 1: Is the introduction to the research background, research justification and rational, the research aims and objective, and research questions. The chapter states the knowledge gap in Kuwait that it intends to fill by developing with the aid of empirical research, a framework for improving the achievement of good IAQ in Kuwait housing developments at design, construction, and post-construction or occupancy stages.
broad overview of household pollutants, and effects, are given and discussion on international standards and regulation are also given.
Chapter 3: This chapter gives an overview of the, geographical, and environmental conditions of Kuwait as a whole. This includes the climatic conditions, and the human main activities (refineries, transportation, industrial, etc.) that contribute to the pollution of the environments especially the ambient air surrounding residential and commercial areas. This is important because to a large extent, good IAQ in Kuwait depends on the cleanliness of the outside air, which is used to clean the inside air, since Kuwait residents also depend on natural ventilation.
Chapter 4: This chapter states the chosen research approach or method which justifies the best way to answer the research question achievement of the aims and objectives. The chapter contributes to the strength and validity of the research study as it states the research’s philosophical position, research approach, research design, sample selection, data collection and analysis techniques.
Chapter 5: This is the chapter that documents the research’s data collection and analysis. Here, the quantitative data (questionnaire information) gathered is presented in the form of tables, graphs, and charts which aided in the understanding and analysis of the data. The qualitative data was coded according to themes, which encapsulates activities the are done at the design, construction, and post-construction stages to improve the achievement of good IAQ on a housing project in Kuwait.
requirements are met, and selecting HVAC systems to improve IAQ and reduce the energy impacts of ventilation.
Chapter 7: After the framework was developed, it was necessary to validate it using member checking to ensure the reliability, credibility, comfirmability, transferability, and generalizability of the framework and findings were achieved. In succinct terms, it is the process by which the accuracy of the findings and the framework was to be assessed, and from which the feedback was used to improve the framework.
2.1
Introduction
The Literature review is structured into sections to include definition of Indoor Air Quality (IAQ), sustainable architecture and urban development, building construction, healthy buildings, indoor air quality and occupant wellbeing, illnesses caused by buildings, indoor contaminates, and relationship between indoor air pollution and health.
2.2
What is indoor air quality (IAQ)?
According to the United States Environmental Protection Agency (USEPA) (2016), “Indoor Air Quality (IAQ) refers to the air quality within and around buildings and structures, especially as it relates to the health and comfort of building occupants.” Contrary to popular belief, indoor air can be even more polluted than outdoor air. Most people think of air pollution as something outside -- smog, ozone, haze hanging in the air, or some smell from a chemical factory nearby. But the truth is, the air inside homes, offices, and other buildings can be more polluted than the air outside (Books and Davis, 1992). Common pollutants found in the air inside homes are: lead (in house dust), formaldehyde, fire-retardants, radon, microscopic dust mites from moulds, even volatile chemicals from fragrances used in conventional cleaners. According to Books and Davis (1992), some pollutants are tracked into the home via a new mattress or furniture, carpet cleaners, or a coat of paint on the walls. Poor Indoor Air Quality (IAQ) is among the top five environmental risks (USEPA, 2016). Improving IAQ in buildings can greatly improve the wellbeing of occupants. Pollutants in a building’s air can cause dizziness and headaches as well as aggravate allergies and asthma. While cleaning and vacuuming can improve indoor air, cleaning alone will not solve IAQ problems. Good IAQ carries numerous, valuable benefits. It helps improve the health, productivity of employees and happiness of occupants, decreases absenteeism, increases learning and student performance levels and creates a more positive customer experience (Lennox, 2016). Benefits of good IAQ has also been tied to greater return on investment (ROI) and bottom-line economics (ASHRAE, 2009).
century, the awareness and concerns about IAQ issues has steadily come into the lime light and is a strong factor when designing and constructing any habitable structure. However, according to ASHRAE (2009), “in most cases IAQ is still not a high-priority design or
building management concern compared to function, cost, space, aesthetics, and other attributes such as location and parking.”
2.3
Indoor Air Quality and Occupants’ Wellbeing
Indoor allergens and irritants need particular attention in this decades and going forward because we're spending more time indoors, and because modern homes are airtight, these irritants can't easily escape (Books and Davis, 1992). Most people spend about 90% of their time indoors every day – at home, at work or school (Klepeis et al., 2001, Jacobs et al., 2007). This means that a level of occupant’s wellbeing, in relation to the indoor air quality, thermal, visual and acoustical comfort has to be achieved.
Figure 2.1: Time typically spent indoors and outdoors
Source: European Commission (2003)
Figure 2.2: Daily time allocation (Source; Jacobs et al., 2007)
The rapid development of new building materials, furnishings, and consumer products over the past 50 years has resulted in a subsequent increase in new chemicals in the built environment (Weschler, 2009). Weschler found that there has been a sudden increase in the number of chemicals manufactured and used in household and building products, including construction materials, interior finishing materials, cleaning agents, furnishings, computers and office equipment, printers and supplies.
People exposed to indoor air pollutants for long periods of time become more susceptible to the effects of indoor air pollution than those who are not. The reality of the types of illness and the amount of fear felt by people is shown in the following figure.
The people most susceptible include; the young, the elderly, and the chronically ill, especially those suffering from respiratory or cardiovascular disease.
There have been many definitions provided for appropriate indoor air quality (IAQ), one definition describes the absence of air contaminants which may impair the comfort or health of building occupants (Rousseau, 2003). Contaminants can also be defined as chemical, physical or biological contaminants in the breathable air inside a habitable structure or conveyance, including workplaces, schools, offices, homes, and vehicles (Jacobs et al., 2007). Exposure to pollutants may cause a variety of effects ranging in severity from perception of unwanted odours to cancer (EC, 2003). Examples of health effects are dispersal of airborne infectious disease, micro-organisms in air humidifiers causing pneumonia and humidifier fever, mould increasing risk of allergy, and an increased risk of lung cancer through exposure to environmental tobacco smoke (ETS) and radon (Crump et al., 2009; ASHRAE, 2009). Sensory effects include:
Adverse health effects on sensory systems
Adverse perceptions such as annoyance reactions and triggering of hypersensitivity reactions
Sensory warnings of harmful factors such as irritation due to formaldehyde.
[image:31.595.80.520.507.741.2]It can be seen that there are significant and serious implications of poor IAQ. The sources of indoor air pollution are shown in Table 2.1 below.
Poor indoor air quality is not a new phenomenon. There is more than enough documented evidence from century ago on the issues concerning IAQ. Waterfurnace (2016) reiterates the statement made by the Health Reformer in 1871: “In the construction of buildings, whether
for public purposes or as dwellings, care should be taken to provide good ventilation and plenty of sunlight… school rooms are often faulty in this respect. Neglect of proper ventilation is responsible for much of the drowsiness and dullness that make the teacher’s work toilsome and ineffective.” In addition, learning becomes difficult for pupils. The above quotation by the Health Reformer captures the rationale of this research – the need for better design and monitoring during construction to ensure effective and efficient IAQ systems within residential buildings.
Needless to say, there are great economic impacts of poor indoor air quality (IAQ) on countries that fail to do something about it. Such impacts include direct medical costs and lost earnings due to major illness, as well as increased employee sick days and lost productivity while on the job (EC, 2003). However, knowing the exact costs, in terms of money, to the government is complex to calculate. In most cases, it is just estimation because of the difficulty in measuring costs related to social health and behavioural studies in general not only with regards to IAQ. Calculations of the social costs of poor IAQ would need to consider the costs for IAQ induced illness, direct medical costs and disabilities, reduced working efficiency, secondary costs related to discomfort and annoyance caused by deteriorated IAQ as well as the loss of productivity and material and equipment damages (EC, 2003). All these variables make it really hard to ascertain the exact economical cost of poor IAQ to society. The European Commission defined the ‘total social cost’ of poor IAQ on society as “a quantitative expression of the impact of deteriorated IAQ on economic
activity, health and well being.” But this figure is still very hard and complex to calculate or estimate. However, the figure is said to be immense (EC, 2003). ASHRAE gives an example of the high cost of poor IAQ in their 2009 guidance document. The example can be seen below.
“The costs of poor IAQ can be striking. There have been many lawsuits associated with IAQ
problems, though most are settled with no financial details released. However, some publicly disclosed cases have involved legal fees and settlements exceeding $10 million. For example:
insurer), due to moisture and mold associated with building envelope problems. The original construction cost for the building was $35 million, but $45 million was spent to replace the entire building envelope, clean up the mold, and relocate the court system.
Occupants of a courthouse in Suffolk County, Massachusetts, received a $3 million settlement in 1999 following a series of IAQ problems associated with a combination of inadequate ventilation and fumes from a waterproofing material applied to the occupied building
Numerous IAQ problems have also occurredin private-sector buildings, but these tend to be settled out of court and are therefore not in the public record. As in public buildings, the causes of the problems vary and the settlement costs can be very expensive. A conservative estimate puts the lower bound of litigation costs during the early 2000s well over $500 million annually.”
It is alleged that due to some ill-advice and poor judgment on cost-saving exercises in the design, construction, layout and operation of many new builds and retrofits, employers suffer far greater costs from employee’s ill health and reduced productivity. The European Commission states that the benefits of good IAQ should be as clear as day, yet, many owners allow their buildings to be plagued with indoor pollutants (poor IAQ) all caused “by a
senseless energy-saving policy, bad HVAC design or malfunctioning installations due to poor maintenance or lack of commissioning. ‘Low cost buildings’ can cost society and business life much more than they gain from energy or other savings… Improving the indoor air quality in domestic and non-industrial commercial buildings is probably one of the most profitable investment society and the business world can make.” There are many low cost measures that can improve IAQ in residential and work environments. However, most buildings especially office and commercial buildings would require increased energy use to operate the HVAC systems, and also increased maintenance cost to monitor and control IAQ problems effectively and efficiently.
2.4
Buildings Illnesses
Two expressions have been associated with illnesses caused by poor indoor air quality, such as sick building syndrome (SBS), building related illness (BRI) and environmental sensitivity. These will now be addressed in the next section. SBS varies in a number of ways from building related illness. The symptoms of sick building syndrome are predominantly non-specific, that is they are not readily identifiable to one illness, or one contaminant source. While, BRI as illnesses arising from exposure to indoor contaminants that cause a specific clinical syndrome (Samet, 1993; Spengler and Sexton, 1983)
2.4.1 Sick Building Syndrome
The Institute of Environmental Epidemiology (IEE) (1996) refers to sick building syndrome as an excess of work-related irritations of the skin and mucous membranes and other symptoms (including headache and fatigue) reported by occupants in residences or modern office buildings. The World Health Organisation (WHO) (2010), listed the following symptoms as those most commonly attributed to sick building syndrome:
• Eye, nose and throat irritation;
• Sensation of dry mucous membranes and skin;
· Absence from work, from workstation; unavailable on telephone
· Health costs, including sick leave, accidents, injuries
· Observed downtime, interruptions
· Controlled independent judgments of work quality, mood, etc.
· Self-assessments of productivity
· Component skills, task measures, speed, slips, accuracy
· Output form pre-existing work-groups
· Total unit cost per product or service
· Output change in response to graded reward
· Voluntary overtime or extra work
· Cycle time from initiation to completion of discrete process
· Multiple measures at all organizational levels
· Individual measures of performance, health and well being at work
• Erythematic; • Mental fatigue; • Headaches;
• High frequency of airway infection and coughs;
• Hoarseness, wheezing, itching and unspecified hypersensitivity; • Nausea and dizziness.
Characteristically, the symptoms of sick building syndrome are prevalent in 20% or more of the building’s occupant population, as opposed to building related illness which normally only affects a few occupants (Spengler and Sexton, 1983, Samet, 1993).
2.4.2 Building Related Illnesses
2.5
Indoor Contaminants
Table 2.2: Sources and Types of Indoor Air Pollution(Crump et al., 2009)
Crump et al, (2009) outline a number of indoor contaminants and their definitions. They are the following:
Volatile Organic Compounds (VOCs) are emitted over periods of weeks or years from construction and furnishing products and have the potential to cause poor air quality. There is a growing interest in release of VOCs from consumer products including electrical goods such as computers and printers as well as cleaning products and air fresheners. ETS contains a complex mixture of organic compounds and while smoking is banned in the workplace and public buildings in many countries, it remains a significant source of airborne pollution in many homes (ASHRAE, 2009).
Formaldehyde: is a very volatile organic compound (VVOC) that has been widely studied because of its release from a range of building and consumer products. Semi-volatile organic compounds (SVOCs) have a relatively low vapour pressure and therefore tend to occur at lower concentrations in indoor air than the more volatile VOCs. They include plasticisers used in polymeric materials such as vinyl floorings and paints, pesticides such as DDT and pentachlorophenol, and polycyclic aromatic hydrocarbons (PAHs) produced during fuel combustion and present in coal tar and in tobacco smoke.
Source Main pollutants
Outdoor air SO2, NOx, ozone, particulates matters, biological particulates, benzene
Combustion of fuel CO, NOx, VOCs, particulates matters
Tobacco smoke CO, VOCs, particulates matters
People CO2, organic compounds
Building materials VOCs, formaldehyde, radon, fibres, other particulates, ammonia
Consumer products VOCs, formaldehyde, pesticides
Furnishings VOCs, formaldehyde
Office equipment, including HVAC VOCs, ozone, particulates
Bacteria and fungi VOCs, biological particulates
Contaminated land Methane, VOCs, contaminated dusts eg metals
Ground Radon, moisture
Washing and cleaning Moisture
CO2 is a natural constituent of air and only in exceptional circumstances is it present in sufficient amounts to be a danger to health. It can be present in buildings as a result of respiration of people and animals, as a product of combustion and as a component of soil gas. It is widely used as an indicator of ventilation rate and, effectively, as a proxy for body odour. CO is a colourless, odourless gas, produced by the incomplete combustion of most fuels. Incomplete combustion can occur, e.g. when there is inadequate ventilation to an appliance. Nitrogen dioxide (NO2) is emitted from gas-fuelled cookers, fires, water heaters and oil fired space heaters.
Sulphur dioxide (SO2) is produced by burning sulphur-containing fuels such as coal and oil. Ozone is primarily a pollutant of ambient air produced by photochemical reaction. It undergoes reaction indoors with surfaces and airborne pollutants to produce new organic compounds and particles. Water vapour is produced by people during activities such as cooking, cleaning and washing, as well as through normal respiration. The amount of water vapour in the air has direct effects on health and comfort and is also important in relation to the occurrence of biological pollutants.
Particle Pollution refers to a mix of very tiny solid and liquid particles that are found in the air, both indoors and outdoors, and which can be harmful to health. It is difficult to assess particle pollution because the particles themselves are different sizes, some are one-tenth the diameter of a strand of hair. Many are even tinier; some are so small they can only be seen with an electron microscope. Because of their size, individual particles cannot be seen, but together they appear as a haze which forms when millions of particles blur the spread of sunlight. This means that humans do not know when particles are being breathed, yet it is so dangerous it can shorten life. The differences in size make a big difference in how they affect health, natural defenses help humans to cough or sneeze larger particles out of our bodies, but those defences don’t keep out smaller particles (those that are smaller than 10 microns in diameter, or about one-seventh the diameter of a single human hair). These particles get trapped in the lungs, while the smallest are so minute that they can pass through the lungs into the blood stream.
Ultrafine particles are smaller than 0.1 micron in diameter and are small enough to pass through the lung tissue into the blood stream, circulating like the oxygen molecules themselves. No matter what the size, particles can be harmful to health, although the smaller particles are able to penetrate deeper into the organs (Al-Salem and Khan, 2010).
PM0.1 – particulate matter having a diameter smaller than 0.1 microns (100 nm). PM10 – particulate matter having a diameter smaller than 10 microns.
PM2.5 – particulate matter having a diameter smaller than 2.5 microns.
[image:38.595.93.502.309.626.2]The figure below shows sizes of particles as well as sizes of organic or biological components such as sizes of bacteria and viruses.
Figure 2.4: Logarithmical length scale showing size of nanomaterials compared to biological components and definition of 'nano' and 'micro' sizes
Recent epidemiological studies have shown a strong correlation between particulate air pollution levels, respiratory and cardiovascular diseases, various cancers, and mortality (Buzea et al., 2007).
There is extensive scientific studies on the sources of indoor pollution including a number of reviews (Crump et al., 2004a, Pluschke, 2004, Fernandes de Oliveira E, 2009, Maroni, 1995, Morawska and Salthammer, 2003, Salthammer, 1999b, Crump, 2002, Bruinen de Bruin et al., 2005, Mendell, 2007), below in the table, showing the most common. Because most people spend most of their time indoors, the health effects due to exposure of both pollutants generated outdoors and those released indoors can be significant. It has been estimated that air pollution reduces the life expectancy of every person in the UK by an average of 7-8 months, with estimated equivalent health costs of up to £20 billion each year (Crump et al., 2004b). According to WHO (2000a), poor IAQ is believed to have an important causative or aggravating influence on the following diseases:
Allergic and asthma symptoms
Lung cancer
Chronic obstructive pulmonary disease (COPD)
Airborne respiratory infections
Cardiovascular disease (CVD)
Odour and irritation (SBS symptoms)
Stress
Health effects from indoor air pollution vary greatly, depending on the types of pollution present, the concentration of each pollutant, and the relative susceptibility of the person. Some affects are acute such as asthma, hypersensitivity pneumonitis, and headaches; while others are chronic such as cancer, heart disease, COPD (Chronic Obstructive Pulmonary Disease), and others (Waterfurnace, 2016). These will now be explored in more detail.
Allergic and asthma symptoms
interaction between genetic and environmental factors. For example asthmatic patients are sensitive to allergens present in the indoor environment and are often hyperactive to a number of gasses and particles. 30 to 50% increase respiratory and asthma related illnesses have been associated with building dampness and mould.
Lung cancer
Lung cancer is the most common cause of death from cancer globally. Most are due to bad lifestyle such as - smoking. But it is estimated that 9% are due to radon exposure in the home and 0.5% in males and 4.6% in females are due to exposure to environmental tobacco smoke (ETS). Also evidence suggests some risks have been associated with combustion particles including ultrafine and fine particles in ambient air, diesel exhaust and indoor cooking oil and coal burning (Lewtas, 2007).
COPD
COPD is a chronic respiratory disorder that is usually progressive and associated with an inflammatory response of the lungs to noxious particles or gases (WHO, 2004). It is estimated that the prevalence of clinically relevant COPD in Europe is between 4 and 10% of the adult population. About 70% of COPD related mortality is attributed to cigarette smoking. ETS, biomass combustion fumes, particles in ambient air and long-term exposure to mould/dampness are also attributed to COPD (Burden, 2003).
Airborne infectious diseases
Airborne infectious diseases include Legionnaire’s disease, tuberculosis, flu and SARS (Severe Acute Respiratory Syndrome). Reservoirs of aquatic systems such as cooling towers, evaporative condensers, and humidifiers, have been the source of airborne agents in spread of Legionella and pneumonia. Symptoms of these diseases can be irritated by exposure to ETS and combustion particles (Carrer, 2008, Oliveira Fernandes et al., 1995).
2.6
Benefits of good IAQ
2.7
Ventilation in Relation to Pollution Sources
According to European Commission (EC) (2003), indoor air pollution is mainly determined by the outdoor pollution levels, and the ventilation system in relation to the pollution levels.
“The outdoor pollution level; That is,
The amount of outdoor air ‘imported’ to the buildings by the different forms of ventilation
The indoor pollution sources related to the occupants and their activities (cooking, copying,
etc)
The pollution from the building itself (building materials, energy systems…)
The degree of cleaning of incoming outdoor and return indoor air
The role of ventilation in relation to the pollution levels is substantial:
· Advance the health and well-being of building occupants
· Optimise energy use and save cost with comfort and productivity
· Minimize indoor and outdoor exposures to pollutants and other agents with adverse health effects
· Decrease life-cycle costs by avoiding adverse health effects, energy waste and unnecessary costs for operation, maintenance and rehabilitation of buildings
· Avoid the use of rare materials and encouraging a sensible recycling of other materials
· Avoid the use of materials and substances hazardous to the environment
· Not cause unwanted side-effects like noise, draught, added air pollutants, or spreading indoor or outdoor generated pollutants
· Help to maintain building and city designs and structures that are vital to social and economic values and social networks among individuals
· Help to preserve historical buildings and environments as well as respecting local architectural traditions in a cautious and aesthetic balance with new building and system
designs
As far as the indoor pollution levels are concerned, ventilation is on the one hand bringing the outdoor pollutants into the building but on the other hand it is lowering the concentrations of pollutants indoors due to indoor pollution sources.
[image:42.595.82.522.262.505.2] Ventilation has also an impact on the outdoor pollution level. Building related pollution sources represent about 40% of the total pollution. Due to the increased thermal insulation levels of buildings, including envelope tightness, the importance of the ventilation related energy use is increasing and may represent up to 50% of the total energy use of a building, particularly for certain typologies such as office buildings”
Figure 2.5: Pollution sources for indoor and outdoor air quality (source, EC, 2003)
Figure 2.6: The Role of ventilation in relation to total air exposure (Source: EC, 2003)
2.8
Ventilation Systems
Ventilation can be classified into two types; natural ventilation, mechanical ventilation, and the hybrid ventilation systems. The latter is a ventilation system that is a combination of the former two. Natural form of ventilation is the most common type of ventilation found around the world. It is as simple as ventilating a room through openings, where air enters and exits the building or space through envelops; windows and doors. The quality of the indoor air, temperature of the air, and flow rate, depend entirely on the weather condition and of course, outdoor air characteristics. If there is high-pressure wind outside, the flow rate of natural ventilation increases, similarly, if it is summer or winter, the temperature will differ accordingly.
2.8.1 Natural Ventilation systems
ventilation rates dues to buildings with small openings, could result in build up of pollutants that may make the building inhabitable by humans.
2.8.2 Mechanical Ventilation Systems
On the flip side, mechanical ventilation make use of fan powered air supply into the rooms and exhaust fan that takes the air out of the room. The ventilation supply air is sometimes heated by the exhaust air through the aluminium strip found within the HVAC system. These systems are mostly found in countries that do not need cooling systems as much because they are in cold climates. However, cooling and humidification are not possible. Other ventilation systems have heating, cooling and humidifying capability. On the other hand, these ventilation systems are found in countries in hot climate that need systems with cooling capability in order to ensure thermal comfort. Although, mechanical ventilation systems (HVACs) have a lot of advantages, they do have some risks. These include but not limited to; noise generation caused by the fans and pressured air generated by the fans, possible growth of micro bacteria if there is condensed moisture in the system, the components of the systems may become dirty or contaminated over the years of operation and the system may start to release pollutants and smells into the rooms, it is also possible that the dirt could come from unprotected ducts during construction and installation. If the mechanical ventilation system does not have cooling system, the kind found in European countries due their cold climates, at times when temperatures get hotter than usual, such as in unusual summers days, then thermal comfort is not attained using the HVAC system. According to the European Commission (2003) mechanical ventilations systems have been shown to cause adverse effects on residents. The commission states, that the reasons are not well known but could be linked to, but not limited to the following reason; “air handling system is a source of pollution, moisture in air handling system causes the mould growth, system generates and transfers noise, ventilation air supply is poorly controlled, occupants cannot influence the ventilation.” As a result, surveys have found a puzzling fact in some instances, “that people report themselves more satisfied with natural ventilation than with air conditioning and mechanically ventilated buildings this is the issue which may have major effect on the whole building design as natural ventilation has to be integrated into the architectural design from the beginning of the design process.”
air condition, supply air condition and outdoor air condition to the optimizer. The optimizer then uses the values supplied at every interval to update the values of the controlled variables for the reference of the controller. A hold device is used to feed the updating values obtained from the optimizer in every holding time. Practically, the duration of the sampling time and holding time should be chosen to be short enough to catch up the dynamics of the indoor-air condition.”
Figure 2.7: Proposed real-time implementation for HVAC control system
Source: Atthajariyakul and Leephakpreeda, (2004)
2.8.3 Hybrid Ventilation Systems
This ventilation system is an optimal combination of both natural and mechanical ventilation systems to achieve the best indoor air quality possible. Heiselberg, (1998) defined hybrid ventilation systems as: “as systems providing a comfortable internal environment using
Figure 2.8: Merging the best of natural and mechanical ventilation. Source (EC, 2003)
As earlier mentioned, the decision on which ventilation system to choose depends on a number of factors and characteristics of air quality, flow rate, source control, air cleanliness, etc. However, Seppanen (1998) gave a number of strategies and ventilation technologies along side some parameters to aid in the selection of the right ventilation system for given buildings based on their estimated energy savings or use. Table 2.3 gives these strategies and technologies.
Table 2.3: Ventilation strategies for better indoor air quality and energy efficiency (Source: Seppanen, 1998)
Strategy or Technology Phase of the technology
Indoor air quality Estimated energy savings in ventilation Target values for
indoor climate
Available Improved Up to 60% depending
on climate Particulate filtration of
intake air
Available Improved Minor effect on fan
power
Chemical air cleaning Developing Improved Up to 100% in ventilation, increase in fan power
Balancing of air flows Available Improved 10-20% Better ventilation
efficiency
Available/developing Improved Up to 50%
Location of air intakes Available Improved No effect Heat recovery for large
buildings Houses
Available Available
No effect No effect
Upto 70% in heating Up to 50% in heating
[image:46.595.68.531.536.772.2]