The 12th International Conference of
International Association for Computer Methods and Advances in Geomechanics (IACMAG)
1-6 October, 2008 Goa, India
The Effect of External Wings on the Behavior of Suction Anchor
H. Monajemi, H. Abdul Razak
Dept. of Civil Engineering, University of Malaya, 50603 Kuala Lumpur, Malaysia
Keywords: Suction anchor, finite element modeling
ABSTRACT:
Suction anchors may be subjected to quasihorizontal, quasivertical or inclined loading depending on the type of structure and the water depth. The loading conditions can give rise to horizontal and vertical loads, and moments. To achieve the best performance, suction anchors may be used in different ways. A single cylindrical unit is normally used for typical floaters, and to achieve higher load resistance a cluster of several attached cylinders may be installed. They may also be used with external wings to optimize the horizontal holding capacity by an enlarged projected area. The behaviour of the suction anchor subjected to lateral and pullout loading is presented in this paper. This is to observe the effects of the external wings on the failure mechanism and ultimate capacity of the foundation. The general-purpose finite element program DIANA is being used for this study. A nonlinear analysis was performed on a three dimensional model formed using eight- node isoparametric solid brick elements. The soil was modelled as an elastic perfectly plastic material with von Mises yield criterion for saturated clay. Both load control and displacement control analyses were used for this study.1 Introduction
Suction caisson is a novel type of foundation used increasingly for different types of offshore structures. It is a hollow cylinder, open at the bottom and closed at the top. It is installed to the seabed initially with the self weight to provide a seal between the foundation’s skirt tip and the soil, and then later by pumping out the water from within the skirt. This creates a differential pressure at the top of the caisson and pushes it into the soil.
In different type of structures, suction caisson can be seen with different aspect ratios. The skirt length to the diameter ratio (L/D) is generally less than one for the fixed structures like jacket platforms or wind turbines and more than one for the suction caissons which are used as anchors in tension leg platforms (TLPs) or floating structures (Byrne, 2000).
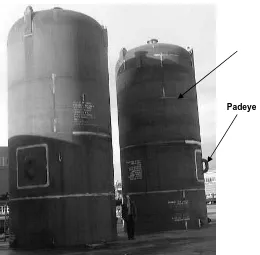
In the case of using suction caisson as an anchor (suction anchor), the foundation is subjected to a horizontal, vertical or inclined loading through a cable which is connected to the load attachment point (call padeye) on the skirt (Figure 1).
Padeye depth and cable’s angle are important parameters which affect the ultimate capacity of the foundation. As mentioned previously, the load angle is generally dependent on the system of the structure and water depth. For example the application of quasivertical loading such as on the Snorre tension leg platform (Stφve et al., 1992), or quasi-horizontal loading such as on the Nkossa (Colliat et al., 1996), while taut wire moorings are being used increasingly currently for water depth more than 1000m (Supachawarote et al., 2004).
The finite element modeling and plastic limit analysis of normal circular suction anchor under combined V-H-M loading has been presented and discussed previously by the authors (Monajemi and Abdul Razak, 2007a and b). In this paper, pullout and lateral capacity of suction anchors with external wings based on a finite element study will be elaborated. This is to observe the efficiency of external wings on the pullout and lateral capacities as a result of increasing the interface area and the projected area, respectively.
2 Lateral and pullout capacity of suction anchor
Figure 1.Suction anchor and padeye on the skirt
Figure 2.Suction anchor’s reaction mechanism under different load conditions. (a) Anchor under lateral loading, (b) Pullout loading with no soil plug, (c) Pullout loading with soil plug
Figures 2b and 2c illustrate the suction anchor subjected to pullout loading. In this case, the suction anchor may have two different forms of reaction within the soil. If there is no soil plug inside the skirt, there is side resistance between skirt and the soil on both sides (Figure 2b). But if a soil plug is present inside the skirt, there is side resistance only on the outside of the skirt as well as tension at the tip between soil plug and the surrounding soil. Normally for suction anchors, a soil plug is provided because the length to diameter ratio is large compared to suction caisson so that the soil–anchor friction is much higher that the soil weight and tip resistance. On the other hand soil under the sea is saturated and pulling out the anchor causes a vacuum inside the skirt, and the soil plug helps to retain the soil inside the anchor.
Padeye
F
HF
VF
V3 Finite element model and material properties
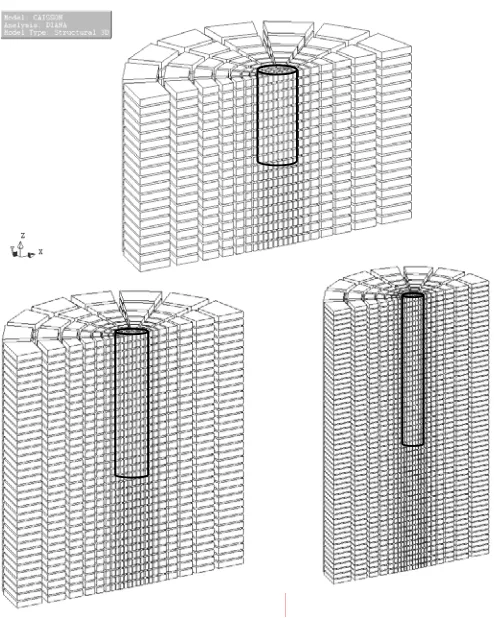
In this study, finite element analysis was carried out using DIANA release 9. Three sizes of suction anchors, 5m in diameter and 10, 20 and 30 meter in length were modeled within cylindrical soil blocks, 35m in diameter and 20,35 and 55 meter in depth (Figure 3). Eight-node isoparametric solid brick elements (HX24L) were used to model the soil, and four-node quadrilateral isoparametric shell elements (Q20SH) to model the anchor. The soil response was taken as elastic perfectly plastic using von Mises failure criterion. Three different soil shear strength profiles were selected as given in Table 1. A value of soil’s modulus ratio was adopted, with E/Su of 500,
[image:3.612.181.428.227.536.2]and Poisson’s ratio was taken as 0.49. Foundation and surrounding soil were assumed weightless. The selected soil was assumed to be normally consolidated and therefore no gap occurs on the backside of the anchor and it can provide tensile resistance. The soil-foundation interaction was considered fully rough and thus the adhesion factor α=1 was selected. Due to symmetry, only half the problem geometry was modeled and a zero displacement boundary condition adjusted to the front face of the mesh and normal to the surface.
Figure 3.Finite element model of the anchor within the soil block
Table 1.Soil shear strength profile
Soil Profile Region Shear Strength
Profile 1 Benchmark Su = 1 kPa
Profile 2 Gulf of Mexico Su = 1.25z kPa
Profile 3 North Sea Su =10(kPa), z < 5m
[image:3.612.154.460.610.708.2]4 Suction anchor subjected to lateral loading
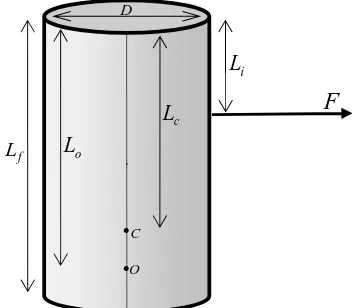
Figure 4 shows a suction anchor subjected to lateral loading. The load attachment point called padeye is at the depth Li from the top and the optimum load point (point C) is at the depth Lc. If the load path goes through point C
(Li = Lc), the suction anchor moves horizontally. Otherwise it rotates around the centre of rotation at the depth Lo.
The effect of the value of Li on the ultimate capacity of the foundation will be investigated in this study. This is
conducted by applying a gradually increasing force for different values of Li in finite element model and
determining the ultimate capacity for each case. The relationships between the values of Lc and soil profile and
[image:4.612.217.393.173.327.2]the values of Lo and Li have been described briefly in earlier studies (Monajemi and Abdul Razak, 2007a and b).
Figure 4.Suction anchor subjected to lateral loading
5 Suction anchor enhanced with external wings
Figure 5 shows a suction anchor enhanced with external wings. It is circular and has two flanges with a width of b
on two opposite sides. These external flanges can improve the horizontal and vertical loading capacity of the anchor, with more significant improvement on the horizontal (and moment) capacity as opposed to the vertical capacity. This can be explained by considering how the suction anchor provides resistance against different type of loadings which has been described before. External wings can improve the vertical capacity of the anchor by increasing the soil-anchor interface area, while the horizontal (and moment) capacity is enhanced through an increase in the projected area.
It should be mentioned that modeling of the external plates itself is not the subject of this study. The main aim is determine the reaction of the soil on the foundation under different loading. Therefore regardless of the design details of the wings both the foundation and external wings are assumed to be totally rigid compared to the surrounding soil. Two sizes of wings i.e. b = 60 and 90cm, have been modeled for all L/D ratios and soil profiles
[image:4.612.174.441.563.703.2]and subsequently 18 different conditions were considered. Both displacement control and load control analysis were used in this model.
Figure 5.Suction anchor with external wings
f L
c L
C
•
D b
b
f L
D
b
b
F
fL
c
L
i
L
o
L
D
C
O
F
6 Results
and
discussion
6.1 Displacement control analysis
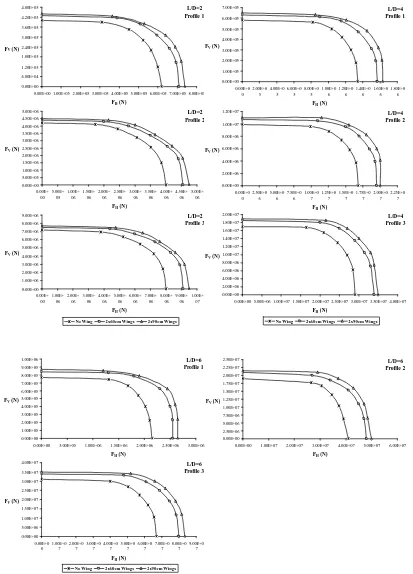
Displacement control analysis was used to find the ultimate horizontal and vertical capacities of suction anchor and their envelopes. This was achieved by applying the pure horizontal and vertical displacements and different combinations of both displacements into the model and finding the reaction load for each case. The ultimate horizontal and vertical capacities and the horizontal-vertical load interaction diagrams of anchors with and without external wings are shown in Table 2 and Figure 6 respectively.
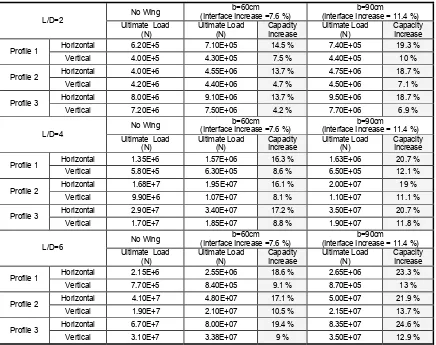
[image:5.612.90.526.285.630.2]Referring to Table 2, the horizontal capacity of the anchor increases about 14 to 18 percent for b=60cm and 19 to 24 percent for b=90cm., while for vertical capacity this increment is about 5 to 9 percent for b=60cm and 8 to 12 percent for b=90cm. It is apparent that the interface area increased by 7.6 and 11.4 percent for b=60 and 90cm respectively, by providing the external wings. This percentage increase is representative of the extra material which is required to fabricate the anchor. Thus a comparison between the extra materials used for the wings and the increase in ultimate capacity shows that using external wings do not significantly contribute to the vertical capacity, since the vertical capacity increment and the interface increment is almost similar. However, there is a significant gain in the horizontal capacity of the anchor.
Table 2.Comparison between the ultimate capacity of the anchors with and without external wings
No Wing (Interface Increase =7.6 %) b=60cm (Interface Increase = 11.4 %) b=90cm
L/D=2
Ultimate Load
(N) Ultimate Load (N) Capacity Increase Ultimate Load (N) Capacity Increase
Horizontal 6.20E+5 7.10E+05 14.5 % 7.40E+05 19.3 %
Profile 1
Vertical 4.00E+5 4.30E+05 7.5 % 4.40E+05 10 %
Horizontal 4.00E+6 4.55E+06 13.7 % 4.75E+06 18.7 %
Profile 2
Vertical 4.20E+6 4.40E+06 4.7 % 4.50E+06 7.1 %
Horizontal 8.00E+6 9.10E+06 13.7 % 9.50E+06 18.7 %
Profile 3
Vertical 7.20E+6 7.50E+06 4.2 % 7.70E+06 6.9 %
No Wing (Interface Increase =7.6 %) b=60cm (Interface Increase = 11.4 %) b=90cm
L/D=4
Ultimate Load
(N) Ultimate Load (N) Capacity Increase Ultimate Load (N) Capacity Increase
Horizontal 1.35E+6 1.57E+06 16.3 % 1.63E+06 20.7 %
Profile 1
Vertical 5.80E+5 6.30E+05 8.6 % 6.50E+05 12.1 %
Horizontal 1.68E+7 1.95E+07 16.1 % 2.00E+07 19 %
Profile 2
Vertical 9.90E+6 1.07E+07 8.1 % 1.10E+07 11.1 %
Horizontal 2.90E+7 3.40E+07 17.2 % 3.50E+07 20.7 %
Profile 3
Vertical 1.70E+7 1.85E+07 8.8 % 1.90E+07 11.8 %
No Wing (Interface Increase =7.6 %) b=60cm (Interface Increase = 11.4 %) b=90cm
L/D=6 Ultimate Load
(N) Ultimate Load (N) Capacity Increase Ultimate Load (N) Capacity Increase
Horizontal 2.15E+6 2.55E+06 18.6 % 2.65E+06 23.3 %
Profile 1
Vertical 7.70E+5 8.40E+05 9.1 % 8.70E+05 13 %
Horizontal 4.10E+7 4.80E+07 17.1 % 5.00E+07 21.9 %
Profile 2
Vertical 1.90E+7 2.10E+07 10.5 % 2.15E+07 13.7 %
Horizontal 6.70E+7 8.00E+07 19.4 % 8.35E+07 24.6 %
Profile 3
Figure 6.Horizontal-vertical failure envelopes for normal anchor and anchor with 60 and 90 cm external wings
It should be noted that there are two major parameters which limit the size of the external wings. The first one is that as the width of the wings increases, it becomes less rigid. Thus for larger wings, the plate’s thickness has to be increased or use any other technique to provide the required stiffness. Consequently it will cost more and perhaps reduces the benefit of using them. On the other hand increasing the size without maintaining the stiffness within reasonable limits causes bigger deformation of the plates which reduces the projected area and
L/D=2 Profile 1 0.00E+00 6.00E+04 1.20E+05 1.80E+05 2.40E+05 3.00E+05 3.60E+05 4.20E+05 4.80E+05
0.00E+00 1.00E+05 2.00E+05 3.00E+05 4.00E+05 5.00E+05 6.00E+05 7.00E+05 8.00E+05 FH (N)
FV (N)
No Wing 2x60cm Wings 2x90cm Wings L/D=2 Profile 2 0.00E+00 5.00E+05 1.00E+06 1.50E+06 2.00E+06 2.50E+06 3.00E+06 3.50E+06 4.00E+06 4.50E+06 5.00E+06 0.00E+ 00 5.00E+ 05 1.00E+ 06 1.50E+ 06 2.00E+ 06 2.50E+ 06 3.00E+ 06 3.50E+ 06 4.00E+ 06 4.50E+ 06 5.00E+ 06 FH (N)
FV (N)
No Wing 2x60cm Wings 2x90cm Wings L/D=2 Profile 3 0.00E+00 1.00E+06 2.00E+06 3.00E+06 4.00E+06 5.00E+06 6.00E+06 7.00E+06 8.00E+06 9.00E+06 0.00E+ 00 1.00E+ 06 2.00E+ 06 3.00E+ 06 4.00E+ 06 5.00E+ 06 6.00E+ 06 7.00E+ 06 8.00E+ 06 9.00E+ 06 1.00E+ 07 FH (N)
FV (N)
No Wing 2x60cm Wings 2x90cm Wings
L/D=4 Profile 1 0.00E+00 1.00E+05 2.00E+05 3.00E+05 4.00E+05 5.00E+05 6.00E+05 7.00E+05 0.00E+0 0 2.00E+0 5 4.00E+0 5 6.00E+0 5 8.00E+0 5 1.00E+0 6 1.20E+0 6 1.40E+0 6 1.60E+0 6 1.80E+0 6 FH (N)
FV (N)
No Wing 2x60cm Wings 2x90cm Wings L/D=4 Profile 2 0.00E+00 2.00E+06 4.00E+06 6.00E+06 8.00E+06 1.00E+07 1.20E+07 0.00E+0 0 2.50E+0 6 5.00E+0 6 7.50E+0 6 1.00E+0 7 1.25E+0 7 1.50E+0 7 1.75E+0 7 2.00E+0 7 2.25E+0 7 FH (N)
FV (N)
No Wing 2x60cm Wings 2x90cm Wings L/D=4 Profile 3 0.00E+00 2.00E+06 4.00E+06 6.00E+06 8.00E+06 1.00E+07 1.20E+07 1.40E+07 1.60E+07 1.80E+07 2.00E+07
0.00E+00 5.00E+06 1.00E+07 1.50E+07 2.00E+07 2.50E+07 3.00E+07 3.50E+07 4.00E+07 FH (N)
FV (N)
No Wing 2x60cm Wings 2x90cm Wings
L/D=6 Profile 1 0.00E+00 1.00E+05 2.00E+05 3.00E+05 4.00E+05 5.00E+05 6.00E+05 7.00E+05 8.00E+05 9.00E+05 1.00E+06
0.00E+00 5.00E+05 1.00E+06 1.50E+06 2.00E+06 2.50E+06 3.00E+06 FH (N)
FV (N)
No Wing 2x60cm Wings 2x90cm Wings L/D=6 Profile 3 0.00E+00 5.00E+06 1.00E+07 1.50E+07 2.00E+07 2.50E+07 3.00E+07 3.50E+07 4.00E+07 0.00E+0 0 1.00E+0 7 2.00E+0 7 3.00E+0 7 4.00E+0 7 5.00E+0 7 6.00E+0 7 7.00E+0 7 8.00E+0 7 9.00E+0 7 FH (N)
FV (N)
No Wing 2x60cm Wings 2x90cm Wings
L/D=6 Profile 2 0.00E+00 2.50E+06 5.00E+06 7.50E+06 1.00E+07 1.25E+07 1.50E+07 1.75E+07 2.00E+07 2.25E+07 2.50E+07
0.00E+00 1.00E+07 2.00E+07 3.00E+07 4.00E+07 5.00E+07 6.00E+07 FH (N)
the advantages on their behavior. The effect of plate deformation on the behaviour is not taken into account in this study since it is assumed to be rigid. In the reality there is a certain value of deformation which affects the ultimate capacity and can be an important factor for future studies.
The other parameter which limits the size of the wings is their resistance during anchor installation. As mentioned earlier, a suction anchor is installed by subjecting it to differential pressure at the top, by sucking out the water from within the skirt. This differential pressure is limited by the soil behaviour and if the applied suction exceeds a certain value or a certain rate (depending on the type of the soil) the soil under the anchor starts to liquefy. Instead of the differential pressure at the top, water and liquefied soil starts to flow into the skirt. Therefore for anchors with large wing sizes or large aspect ratios, the resistance forces might be higher than the maximum penetration force which suction can provide.
6.2 Load control analysis
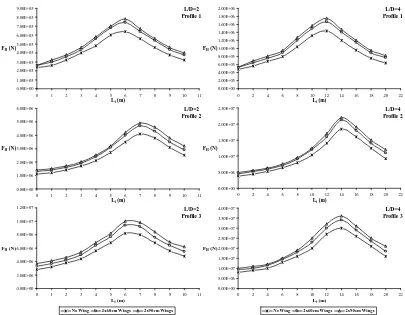
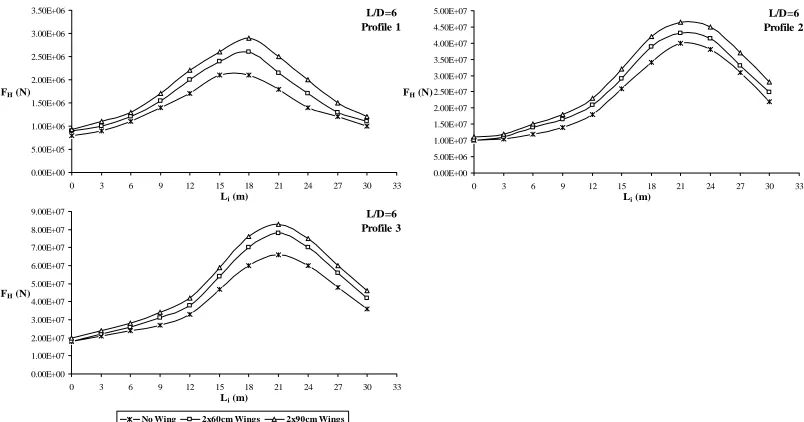
Load control analysis was used to apply lateral loadings to the model and to find the ultimate capacity of the anchor for different load attached depths. For this reason, a gradually increasing lateral force was applied to the foundation for different load attach points until failure occurred. Figure 7 shows the ultimate capacity of the anchor for different load attached depths. Each diagram shows and compares the results of the anchors with and without wings. Referring to the diagrams, for the soil profile 1, 2 and 3, optimum ultimate capacity is achieved when Li/Lf
is approximately 0.55, 0.75 and 0.65 respectively. This occurs when the load path goes through the point C and
[image:7.612.104.509.307.622.2]no rotation occurs (Monajemi and Abdul Razak 2007b).
Figure 7.Ultimate capacity of the suction anchor for different values of Li
L/D=2 Profile 1
0.00E+00 1.00E+05 2.00E+05 3.00E+05 4.00E+05 5.00E+05 6.00E+05 7.00E+05 8.00E+05 9.00E+05
0 1 2 3 4 5 6 7 8 9 10 11 Li (m)
FH (N)
No Wing 2x60cm Wings 2x90cm Wings L/D=2 Profile 2
0.00E+00 1.00E+06 2.00E+06 3.00E+06 4.00E+06 5.00E+06 6.00E+06
0 1 2 3 4 5 6 7 8 9 10 11 Li (m)
FH (N)
No Wing 2x60cm Wings 2x90cm Wings L/D=2 Profile 3
0.00E+00 2.00E+06 4.00E+06 6.00E+06 8.00E+06 1.00E+07 1.20E+07
0 1 2 3 4 5 6 7 8 9 10 11 Li (m)
FH (N)
No Wing 2x60cm Wings 2x90cm Wings
L/D=4 Profile 1
0.00E+00 2.00E+05 4.00E+05 6.00E+05 8.00E+05 1.00E+06 1.20E+06 1.40E+06 1.60E+06 1.80E+06 2.00E+06
0 2 4 6 8 10 12 14 16 18 20 22 Li (m)
FH (N)
No Wing 2x60cm Wings 2x90cm Wings L/D=4 Profile 2
0.00E+00 5.00E+06 1.00E+07 1.50E+07 2.00E+07 2.50E+07
0 2 4 6 8 10 12 14 16 18 20 22 Li (m)
FH (N)
No Wing 2x60cm Wings 2x90cm Wings L/D=4 Profile 3
0.00E+00 5.00E+06 1.00E+07 1.50E+07 2.00E+07 2.50E+07 3.00E+07 3.50E+07 4.00E+07
0 2 4 6 8 10 12 14 16 18 20 22 Li (m)
FH (N)
Figure 7.Ultimate capacity of the suction anchor for different values of Li (continue)
7 Conclusion
• Finite element simulation of suction anchors enhanced with external wings has been presented and described in this paper. Both load and displacement control analyses were used to determine the ultimate capacity.
• Horizontal-vertical displacement control analysis shows that efficiency of the wings in pure horizontal loading is about two times more than vertical loading.
• Load control analysis shows that using rectangular external wings does not change the optimum load depth and that the shapes of the FH vs. Li diagrams are the same for both anchors with and without
wings. However if the width of the wings changes along the depth or the wings are installed at some other position along the anchor’s length, it is expected that the position of the optimum load and the shape of the diagram would change significantly.
8 References
Byrne, B.W. 2000. Investigations of suction caissons in dense sand. PhD thesis, University of Oxford, UK.
Colliat, J-L., Boisand, P., Gramet, J-C. Sparrevik, P. 1996. Design and installation of suction anchor piles at a soft clay site in the Gulf of Guinea. Proc. Annual Offshore Technology Conference, Houston, Paper 8150.
Fotopoulou M., Kotsanopoulos P., Gazetas G., Tassoulas J.L. 1989. Rocking damping of arbitrarily shaped embedded foundations, Journal of Geotechnical Engineering, Vol. 115, No. 4, 473-490
Gerolymos N., Gazetas G. 2006. Winkler model for lateral response of rigid caisson foundations in linear soil, Soil Dynamics and Earthquake Engineering 26, 347-361
Stφve, O.J., Bysveen, S. and Christophersen, H.P. 1992. New foundation systems for the Snorre development. Proc. Annual
Offshore Technology Conference, Houston, Paper 6882.
Supachawarote, C., Randolph, M.F., Gourvenec, S. 2004. Inclined pull-out capacity of suction caissons. Proceedings of the 14th International Offshore and Polar Engineering Conference, Toulon, France.
Monajemi H., Abdul Razak H. 2007a. Modeling & simulation of suction caisson: a study of plastic analysis theory. 6th
Int.Congress on Industrial and Applied Mathematics, 16-20 July. Zurich (Switzerland)
Monajemi H., Abdul Razak H. 2007b. 3-D finite element modeling of suction caisson foundations under combined V-H-M
loading. Proc. 3rd Int. Conf. on Structural Engineering, Mechanics and computation, Cape Town (South Africa) 799-800
L/D=6 Profile 1
0.00E+00 5.00E+05 1.00E+06 1.50E+06 2.00E+06 2.50E+06 3.00E+06 3.50E+06
0 3 6 9 12 15 18 21 24 27 30 33 Li (m)
FH (N)
No Wing 2x60cm Wings 2x90cm Wings L/D=6 Profile 3
0.00E+00 1.00E+07 2.00E+07 3.00E+07 4.00E+07 5.00E+07 6.00E+07 7.00E+07 8.00E+07 9.00E+07
0 3 6 9 12 15 18 21 24 27 30 33 Li (m)
FH (N)
No Wing 2x60cm Wings 2x90cm Wings
L/D=6 Profile 2
0.00E+00 5.00E+06 1.00E+07 1.50E+07 2.00E+07 2.50E+07 3.00E+07 3.50E+07 4.00E+07 4.50E+07 5.00E+07
0 3 6 9 12 15 18 21 24 27 30 33 Li (m)