R E S E A R C H
Open Access
Digital expression profiling of novel diatom
transcripts provides insight into their biological
functions
Uma Maheswari
1,2, Kamel Jabbari
1,3, Jean-Louis Petit
3, Betina M Porcel
3, Andrew E Allen
1,4†, Jean-Paul Cadoret
5†,
Alessandra De Martino
1†, Marc Heijde
1†, Raymond Kaas
5†, Julie La Roche
6†, Pascal J Lopez
1†,
Véronique Martin-Jézéquel
7†, Agnès Meichenin
1†, Thomas Mock
8,9†, Micaela Schnitzler Parker
8†, Assaf Vardi
1,10†,
E Virginia Armbrust
8, Jean Weissenbach
3, Michaël Katinka
3, Chris Bowler
1*Abstract
Background:Diatoms represent the predominant group of eukaryotic phytoplankton in the oceans and are responsible for around 20% of global photosynthesis. Two whole genome sequences are now available.
Notwithstanding, our knowledge of diatom biology remains limited because only around half of their genes can be ascribed a function based onhomology-based methods. High throughput tools are needed, therefore, to associate functions with diatom-specific genes.
Results:We have performed a systematic analysis of 130,000 ESTs derived fromPhaeodactylum tricornutumcells grown in 16 different conditions. These include different sources of nitrogen, different concentrations of carbon dioxide, silicate and iron, and abiotic stresses such as low temperature and low salinity. Based on unbiased statistical methods, we have catalogued transcripts with similar expression profiles and identified transcripts differentially expressed in response to specific treatments. Functional annotation of these transcripts provides insights into expression patterns of genes involved in various metabolic and regulatory pathways and into the roles of novel genes with unknown functions. Specific growth conditions could be associated with enhanced gene diversity, known gene product functions, and over-representation of novel transcripts. Comparative analysis of data from the other sequenced diatom,Thalassiosira pseudonana, helped identify several unique diatom genes that are specifically regulated under particular conditions, thus facilitating studies of gene function, genome annotation and the molecular basis of species diversity.
Conclusions:The digital gene expression database represents a new resource for identifying candidate diatom-specific genes involved in processes of major ecological relevance.
Background
In the current catalogue of eight major groups of eukar-yotic taxa [1], the majority of well explored model organisms belong to the plant (Archaeplastida) and the animal (Opisthokonta) groups, which both evolved from primary endosymbiotic events that generated chloro-plasts and mitochondria. The heterokonts, on the other hand, probably evolved from serial secondary
endosymbiosis events in which a heterotrophic eukar-yote engulfed both autotrophic red and green eukaryotic algae [2-4]. As a consequence, these organisms derive from the combination of three distinct nuclear genomes. The group includes highly diverse, ecologically impor-tant photosynthetic groups, such as diatoms, as well as non-photosynthetic members, such as oomycetes (for example, Phytophthora infestans, the causative agent of potato late blight).
Diatoms typically constitute a major component of phytoplankton in freshwater and marine environments. They are involved in various biogeochemical cycles,
* Correspondence: [email protected]
†Contributed equally
1
Institut de Biologie de l’Ecole Normale Supérieure, CNRS UMR 8197 INSERM U1024, Ecole Normale Supérieure, 46 rue d’Ulm, 75005 Paris, France Full list of author information is available at the end of the article
most notably those involving carbon, nitrogen and sili-con, and contribute 30 to 40% of marine primary pro-ductivity [5,6]. Consequently, they are responsible for approximately one-fifth of the oxygen that is generated through photosynthesis on our planet. Morphologically, they exhibit different shapes and symmetries, the centric diatoms being radially symmetric and the pennates dis-playing bilateral symmetry. In spite of their tremendous ecological importance, the molecular mechanisms that enable them to succeed in a range of diverse environ-ments remain largely unexplored.
Results from the first diatom genome projects from
Thalassiosira pseudonanaandPhaeodactylum
tricornu-tum showed the presence of various genes needed for efficient management of carbon and nitrogen - for example, encoding urea cycle components [7,8]. However, these studies could only predict the functions of around 55% of diatom genes. The comparative study of the two diatom genomes [8] revealed that only 57% of genes are shared between the two diatoms, and that horizontal gene transfer from prokaryotes is pervasive in diatoms. Thus, the necessity for functional genomics and reverse genetics approaches to further explore dia-tom gene repertories is clear.
P. tricornutum is a pennate diatom that has been
extensively studied physiologically and phylogenetically. In addition, it does not have an obligate requirement for silicic acid like other diatoms, and can undergo morpho-logical transitions between three possible morphotypes [9]. The organism harbors a small genome (27.4 Mb) [8], it can be routinely transformed with efficiencies superior to those reported for other diatoms [10-13], and gene silencing is now possible using RNA interfer-ence [14]. For these reasons P. tricornutumis emerging as a model species for dissecting diatom molecular and cellular biology [15-20].
In a pilot study of theP. tricornutum genome using 1,000 cDNAs, only 23.7% of sequences could be func-tionally defined using homology-based methods [21]. This study was later expanded to 12,136 cDNAs [22], which facilitated comparative genomic studies ofP.
tri-cornutumwith available genomes from the green alga
Chlamydomonas reinhardtii [23], the red alga
Cyani-dioschyzon merolae[24], and the centric diatomT.
pseu-donana [7]. A number of interesting observations were
made from such analyses about the evolutionary origins of individual genes [25]. This encouraged us to expand the EST repository by generating cDNA libraries from cells grown under different conditions of ecological rele-vance to increase the probability of obtaining unique gene expression profiles and to study the conditions in which they are induced. We describe herein statistical methods as well as comparative and functional studies to identify genes that are differentially expressed in 16
different conditions based on 132,547 cDNAs cloned and sequenced from P. tricornutum. These resources permit a systematic understanding of the molecular mechanisms underlying acclimation of this diatom to different nutrient conditions and its responses to various biotic and abiotic stresses, and should aid our under-standing of the function of diatom-specific genes.
Results
Gene expression diversity across different cDNA libraries To add to the previous 12,136 ESTs generated from cells grown in standard growth conditions (here denoted the‘OS library’ for original standard [22], 15 non-nor-malized cDNA libraries were generated to explore the responses ofP. tricornutumto a range of growth condi-tions, including different nutrient regimes of Si, N, Fe, and dissolved inorganic carbon (DIC), stress (hyposali-nity and low temperature), and blue light. We also gen-erated libraries from each of the three P. tricornutum
morphotypes, and from cells exposed to the pro-grammed cell death-inducing aldehyde decadienal [20]. The libraries were generated from three different eco-types whose phylogenetic relationships and general char-acteristics have been previously described [26]. Furthermore, three different culturing regimes were used batch, semicontinuous, and chemostats -depending on the treatment being performed. A comprehensive description of culturing conditions is provided in Materials and methods and Additional file 1, and is summarized in Table 1. To facilitate compari-sons, all cells were harvested in mid-late exponential phase, and the libraries were made using the same RNA extraction and cDNA library construction methodolo-gies (see Materials and methods).
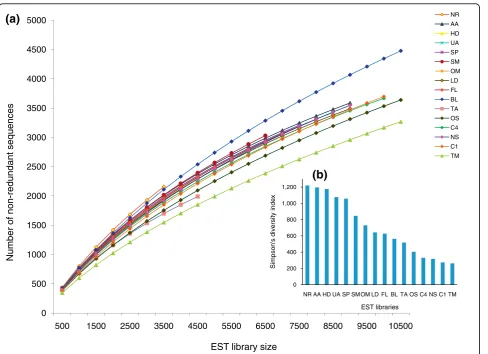
To determine whether the abundance of transcripts was evenly distributed, that is, to check if the libraries have fewer sets of more abundant cDNAs (lower diver-sity) or several sets of evenly abundant cDNAs (higher diversity), we calculated the Simpson’s reciprocal diver-sity index [28], which takes into account both the rich-ness and evenrich-ness of transcripts in the libraries (the higher the index the higher the library diversity). Across the libraries we found the diversity index to vary from 1,218 to 268 (Figure 1b), with the nitrate replete (NR), ammonium adapted (AA), urea adapted (UA) and high decadienal (HD) libraries showing the highest diversity, and the nitrate starved (NS) and high CO2 (C1, C4)
libraries showing the least diversity along with the most redundant triradiate morphotype (TM) library.
Clustering of libraries and genes based on expression We obtained a set of non-redundant transcriptional units (TUs) by aligning the 132,547 cDNAs with the 10,402P. tricornutumpredicted gene models using the
BLAST program. A total of 11,513 sequences lacked predicted gene models and were clustered instead using CAP3 [29]. These represented a further 1,968 TUs in addition to the 8,944 TUs that aligned to the gene mod-els [8]. In total, we obtained 9,145 transcripts present more than once across different libraries and 3,225 sin-gle copy transcripts, thereby comprising 12,370 TUs.
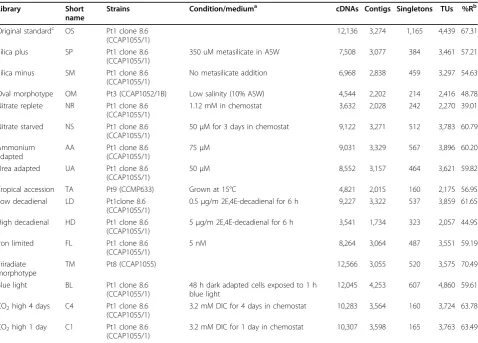
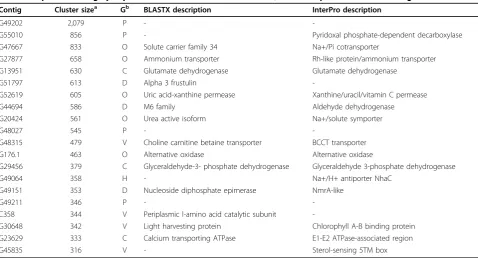
[image:3.595.60.539.98.441.2]The top 20 most abundant transcripts are represented by cDNAs varying from 2,079 to 316 copies in all the 16 libraries (Table 2). The most abundant transcript (G49202), with 2,079 copies, belongs to a P. tricornu-tum-specific gene family (family ID 4628) with 9 mem-bers [8]. All nine encoded proteins contain predicted signal peptides and transcripts for them were detected in one or more cDNA libraries. They do not show any homology with known proteins (e-value cutoff = 10-5) with the exception of G49297, which shows some simi-larity to a bacterial protein containing a carbohydrate binding domain. When the above nine transcripts were subjected to PSI-Blast, we found a few transcripts Table 1 List of different libraries and culture conditions together with library statistics
Library Short
name
Strains Condition/mediuma cDNAs Contigs Singletons TUs %Rb
Original standardc OS Pt1 clone 8.6 (CCAP1055/1)
12,136 3,274 1,165 4,439 67.31
Silica plus SP Pt1 clone 8.6 (CCAP1055/1)
350 uM metasilicate in ASW 7,508 3,077 384 3,461 57.21
Silica minus SM Pt1 clone 8.6 (CCAP1055/1)
No metasilicate addition 6,968 2,838 459 3,297 54.63
Oval morphotype OM Pt3 (CCAP1052/1B) Low salinity (10% ASW) 4,544 2,202 214 2,416 48.78 Nitrate replete NR Pt1 clone 8.6
(CCAP1055/1)
1.12 mM in chemostat 3,632 2,028 242 2,270 39.01
Nitrate starved NS Pt1 clone 8.6 (CCAP1055/1)
50μM for 3 days in chemostat 9,122 3,271 512 3,783 60.79
Ammonium adapted
AA Pt1 clone 8.6 (CCAP1055/1)
75μM 9,031 3,329 567 3,896 60.20
Urea adapted UA Pt1 clone 8.6 (CCAP1055/1)
50μM 8,552 3,157 464 3,621 59.82
Tropical accession TA Pt9 (CCMP633) Grown at 15°C 4,821 2,015 160 2,175 56.95 Low decadienal LD Pt1clone 8.6
(CCAP1055/1)
0.5μg/m 2E,4E-decadienal for 6 h 9,227 3,322 537 3,859 61.65
High decadienal HD Pt1 clone 8.6 (CCAP1055/1)
5μg/m 2E,4E-decadienal for 6 h 3,541 1,734 323 2,057 44.95
Iron limited FL Pt1 clone 8.6 (CCAP1055/1)
5 nM 8,264 3,064 487 3,551 59.19
Triradiate morphotype
TM Pt8 (CCAP1055) 12,566 3,055 520 3,575 70.49
Blue light BL Pt1 clone 8.6 (CCAP1055/1)
48 h dark adapted cells exposed to 1 h blue light
12,045 4,253 607 4,860 59.61
CO2high 4 days C4 Pt1 clone 8.6
(CCAP1055/1)
3.2 mM DIC for 4 days in chemostat 10,283 3,564 160 3,724 63.78
CO2high 1 day C1 Pt1 clone 8.6
(CCAP1055/1)
3.2 mM DIC for 1 day in chemostat 10,307 3,598 165 3,763 63.49
a
All cells grown in artificial seawater media, except chemostat cultures, which were grown in Walne medium [54].b
Percent redundancy of sequences in each library.c
showing low homology (e-value cutoff = 10-3, iterations = 3) to murine-like glycoprotein most typically asso-ciated with animal viruses. Eight of the genes belonging to the above gene family are localized on chromosome 21. The absence of this gene family inT. pseudonana
and its high level of expression across various cDNA libraries may indicate that it represents a P. tricornu-tum-specific expanded glycoprotein gene family.
By comparing all of these highly expressed transcripts with those in 14 other eukaryotic genomes (see Materi-als and methods), we found that many are either present only in the two available diatom genomes or only in
P. tricornutum (Table 2). Expression studies therefore represent a valuable resource for gene annotation in dia-tom and related genomes. Within the top 20 most abundant transcripts, some also encode highly conserved proteins such as glutamate dehydrogenase and glyceral-dehyde-3-phosphate dehydrogenase, as well as others found in higher plants but not in animals (for example, ammonium transporter, light harvesting protein and alternative oxidase) (Table 2).
[image:4.595.58.547.86.440.2]transcripts. Overall expression patterns of each class are similar (Additional file 2A), supporting the hypothesis that the diatom-specific genes do indeed represent bona fide genes. Furthermore, when expression patterns in individual libraries were explored, expression of these three classes of genes was seen to vary greatly (Addi-tional file 2B). As an example, the aldehyde treated libraries (LD, HD) share a common pattern of expressed transcripts representing diatom-specific gene families (Additional files 2A and 3). A recurrent signature within this class of transcripts are stress-related protein domains associated with cell wall and membrane com-ponents, as well as proteases, lipases, glucanase, and eli-citin. Expression analysis can therefore be used as a basis to explore the function of diatom-specific genes by comparing expression of the two diatom-specific classes of genes with the expression patterns of core genes. This comparison also demonstrates that the expression of core genes is generally higher when compared to the
P. tricornutum-specific genes.
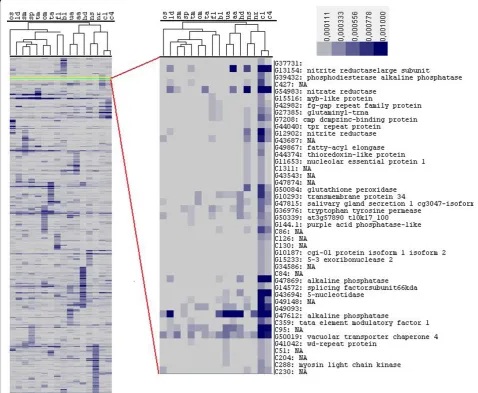
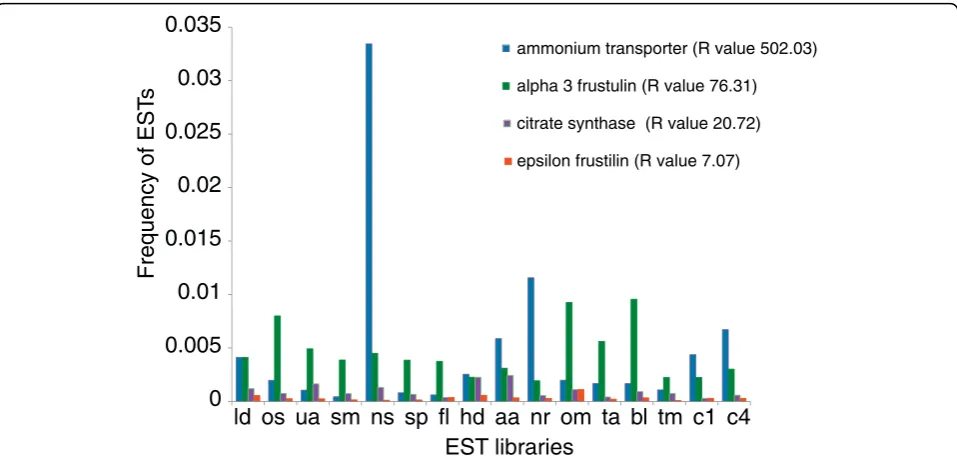
While hierarchical clustering reveals the correlations and differences in patterns of gene expression across libraries, to identify transcripts that are differentially expressed, we used a statistical method based on log-likelihood [32]. For each TU we computed the log-like-lihood ratio (R) and compared it with a randomly gen-erated set (Additional file 4). Based on this comparison we considered TUs with R-values greater than 12 to be
[image:5.595.58.537.97.355.2]differentially expressed (see Materials and methods). On average, we detected between 200 and 450 differentially expressed transcripts per library (8 to 12%), the varia-tion of which was mostly due to differences in library size (Additional file 5). Figure 3 shows examples of transcripts that are expressed across all 16 conditions and that have different R-values. An ammonium trans-porter encoding gene with an R-value of 502 was cata-logued as being differentially expressed in the nitrate starved (NS) library, an alpha-3-frustulin encoding gene was catalogued as differentially expressed in the oval morphotype (OM) and blue light (BL) libraries, and a citrate synthase encoding gene was upregulated in the high decadienal (HD) and ammonium adapted (AA) libraries. By contrast, a gene encoding an epsilon-frustu-lin was not catalogued as being differentially expressed (R-value below 12). Seventy-one transcripts were expressed at least once across all the libraries (Addi-tional file 6) and most of them were classified as being differentially expressed. Fifty-two of them also contained a known domain, and the majority fell into our category of core transcripts (30 sequences, against 15 diatom-specific transcripts, and 13 P. tricornutum-specific transcipts). These genes encode putative transporters (for bicarbonate and ammonium), some transcription factors, transposable elements, and the mitochondrial alternative oxidase, which has been proposed to be a central actor in diatom metabolism [33].
Table 2 Top 20 most highly expressed cDNAs across all the libraries, and their presence in different genomes
Contig Cluster sizea Gb BLASTX description InterPro description
G49202 2,079 P -
-G55010 856 P - Pyridoxal phosphate-dependent decarboxylase
G47667 833 O Solute carrier family 34 Na+/Pi cotransporter
G27877 658 O Ammonium transporter Rh-like protein/ammonium transporter G13951 630 C Glutamate dehydrogenase Glutamate dehydrogenase
G51797 613 D Alpha 3 frustulin
-G52619 605 O Uric acid-xanthine permease Xanthine/uracil/vitamin C permease
G44694 586 D M6 family Aldehyde dehydrogenase
G20424 561 O Urea active isoform Na+/solute symporter
G48027 545 P -
-G48315 479 V Choline carnitine betaine transporter BCCT transporter
G176.1 463 O Alternative oxidase Alternative oxidase
G29456 379 C Glyceraldehyde-3- phosphate dehydrogenase Glyceraldehyde 3-phosphate dehydrogenase
G49064 358 H - Na+/H+ antiporter NhaC
G49151 353 D Nucleoside diphosphate epimerase NmrA-like
G49211 346 P -
-C358 344 V Periplasmic l-amino acid catalytic subunit
-G30648 342 V Light harvesting protein Chlorophyll A-B binding protein G23629 333 C Calcium transporting ATPase E1-E2 ATPase-associated region
G45835 316 V - Sterol-sensing 5TM box
a
Based on our R-value criteria, only 7 genes could be defined as being constitutively expressed across all 16 libraries and these included frustulins and genes involved in cell division. This set of transcripts repre-sents a valuable resource for promoter analysis, espe-cially to identify constitutive promoters for reverse genetics studies.
Gene Ontology term enrichment analysis
To further explore the functional significance of the library clusters and the differentially expressed genes in each library, functional annotation was performed using sequence and domain conservation analysis. For the transcripts showing sequence level similarity to‘known’ proteins (Blastp, e-value <10 -5), Gene Ontology (GO)
[image:6.595.57.536.91.484.2]term enrichment analysis was performed using blast2GO [34]. The GO terms of all the expressed transcripts were compared to the genes that are differentially expressed in each library. Additional file 7 shows the list of GO terms that are over-represented in each library (P < 0.001). In Additional file 7 we also show over-repre-sented GO terms shared between libraries. The urea adapted (UA) and ammonium adapted (AA) libraries show over-representation of genes involved in nitrogen, amino acid, nucleotide and organic acid metabolism (Additional file 7), which is consistent with our knowl-edge of nitrogen metabolism. The blue light (BL) library contains the highest number of over-represented GO terms, and shares several categories related to photo-synthesis and pigment biophoto-synthesis with the iron limited Figure 2Hierarchical clustering showing the expression pattern of transcripts expressed more than once in any of the 16 different growth conditions. The blowup shows some of the genes differentially expressed in the high CO2libraries (C1 and C4). Expression levels are
(FL) library, such as porphyrin and tetrapyrrole bio-synthesis. The significance of these shared terms with respect to metabolic management in iron starved cells has been discussed previously [33]. Additionally, the blue light library also has some unique GO terms, related to sugar and isoprenoid metabolism, transcrip-tion and translatranscrip-tion, that likely reflect a general activa-tion of metabolism stimulated by light exposure of dark-adapted cultures. These terms are not shared with other libraries.
The high decadienal (HD) library displays GO terms related to steroid metabolism as well as uncharacterized proteins involved in responses to biotic stimuli. These transcripts might provide insight into mechanisms of programmed cell death in diatoms because decadienal has been implicated in regulating the process [20,35]. The nitrate libraries (NR, NS) share a group of transpor-ters and the nitrate replete (NR) library shows over-representation of nucleoside phosphate metabolic pro-cesses, specifically purine nucleoside triphosphate meta-bolism. The oval morphotype (OM) library, which is a salt stress library, shows over-representation of lipid metabolism classes whereas the triradiate morphotype (TM) library is over-represented in genes encoding active transport processes. In the high CO2 after 1 day
(C1) library, COPI-vesicle-coat-related GO terms are over-represented, and in the high CO2after 4 days (C4)
library, inorganic anion transporters are over-repre-sented. Perhaps surprisingly, in spite of clustering together in the hierarchical clustering analysis (Figure 2), the two high CO2 libraries (C1, C4) do not share any
particular pathway terms. The over-representation of novel genes may be the reason for not finding any known GO terms between these two libraries, which illustrates our present ignorance of diatom biology, in spite of studying responses to a stimulus of significant ecological relevance.
InterPro domain analysis
As an additional approach to examine the functional significance of differentially expressed transcripts, we explored domain content using InterPro [36]. We first classified putative proteins into two groups, those con-taining InterPro domains were denoted ‘proteins with defined functions’(PDFs), and those with no recogniz-able domains were denoted ‘proteins with obscure func-tions’ (POFs) [37,38]. Comparisons with other organisms showed that most PDFs have orthologs in other heterokonts, particularlyT. pseudonana, and that a significant number are also found in Viridiplantae and Opisthokonta (Additional file 8). Notwithstanding, a sig-nificant number of PDFs (1,011 out of 3,693) were not found in these 14 organismal groups compared, indica-tive of the highly chimeric nature of diatom genomes.
[image:7.595.59.538.88.318.2]composition statistics of the POFs and PDFs present in theP. tricornutum genome. We do not see higher varia-tion in the length, amino acid composivaria-tion and percen-tage of putative proteins with trans-membrane domains, indicating that the higher percentage of POFs is not likely to reflect pseudo-genes or transcripts that are not translated. We therefore propose that the majority encodebona fidegenes.
Most of the differentially expressed transcripts encode PDFs; in particular, the blue light (BL) library contained more than 75% of proteins with defined domains, con-sistent with the fact that the BL library has the highest number of over represented GO terms (Additional file 5). This is possibly because we can infer a lot more about photosynthesis in diatoms by extrapolation of knowledge from plants and other algae than we can about other processes such as diatom responses to nutrients, which may therefore be rather novel. As a case in point, the most highly represented IPR domains in the blue light (BL) library included domains for bicar-bonate transport, carbon fixation, light harvesting, and photosynthetic electron transport (Additional file 9), all of which are known to be key processes of photosynthesis.
As an example of using domain analysis to obtain functional information, the top 15 InterPro domains found in the high CO2libraries (C1 and C4) are shown
in Figures 4a,b. As a reference, Figure 4c shows the 30 most highly represented domains in the P. tricornutum
genome, corresponding to gene families expanded in diatoms, such as protein kinases and heat shock tran-scription factors [8]. In the CO2 libraries we detected
domains involved in pH maintenance and nitrogen metabolism, as well as a decarboxylase domain, found in just one gene. The function of this gene in diatom responses to high CO2 will be well worth exploring. The
enlarged region in Figure 2 shows some of the other transcripts that are shared in the high CO2 conditions,
including genes encoding nitrogen metabolism compo-nents. Genes involved in phosphate metabolism are also evident, suggesting that P. tricornutum responds to higher CO2 levels by up-regulating primary metabolic
pathways.
The top 20 IPR domains in each of the other libraries are shown in Additional file 9. The data both confirm the validity of the culture conditions used for library generation (for example, the nitrogen libraries are over-represented in IPR domains related to nitrogen meta-bolism) and provide a new resource for exploring unanticipated aspects of diatom responses to specific sti-muli. For example, the observed over-representation of IPR domains from heat shock transcription factors in these same libraries infers the importance of this class of transcription factors in regulating nitrogen metabolism.
Correlations between libraries
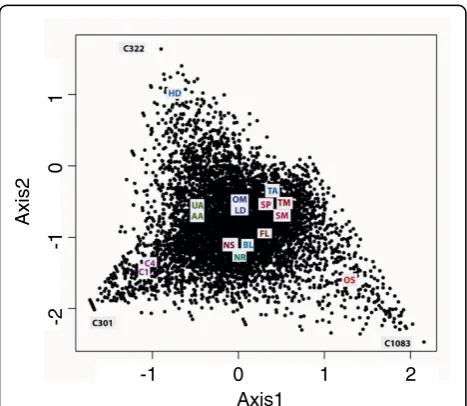
Correspondence analysis (CA) was conducted with the 9,145 transcripts to identify correlated growth condi-tions. In this method, the frequencies of possibly corre-lated expression patterns are split into smaller components of un-correlated variables, and these com-ponents can be represented in multidimensional space using an axis for each transformed component. The first two components (axis) showing the maximum variance (least correlated) in expression are plotted in Figure 5. We found that the high decadienal (HD), original stan-dard (OS) and high CO2 (C1, C4) libraries showed the
maximum variance from the rest of the libraries. The dissimilarity of the OS library was not unexpected because it was created using different protocols com-pared to the other 15 libraries. It was therefore not con-sidered further in this analysis. Comparative and functional analysis of the 100 genes showing maximum variance in expression in the other three conditions indicated that these transcripts mainly represent novel transcripts expressed in specific conditions and not pre-dicted by conventional gene prediction programs or by other homology-based methods (data not shown). An example is shown in Figure 5, in which transcript C322 is unique to the high decadienal (HD) library and resembles a diatom-specific retrotransposon [39]. Con-versely, transcript C301 is highly expressed uniquely in high CO2 conditions (C4 library), but does not have a
predicted gene model. It does not show clear homology to any known sequence in other organisms, but its best BLAST hit is to a proteophoshphoglycan from Leishma-nia(data not shown). Interestingly, recent analyses have shown that this gene is also heavily methylated, unlike the majority ofP. tricornutumgenes (unpublished infor-mation Florian Maumus, Leila Tirichine and CB). Methylation of DNA is currently receiving attention as a mechanism controlling gene expression [40], so gene C301 is likely to be of great interest for future studies.
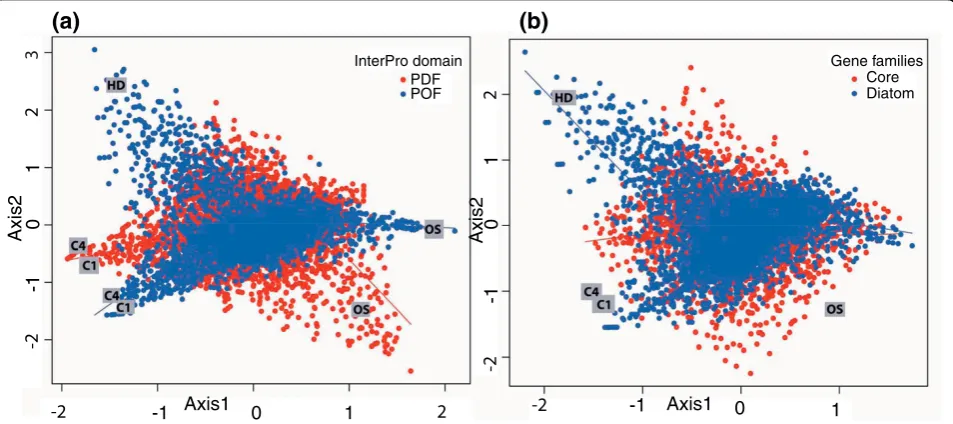
[image:8.595.57.291.112.199.2]To further examine the contribution of known and unknown genes in each library, we repeated the corre-spondence analysis after classifying the transcripts based on the presence and absence of domains. Figure 6a Table 3 Average properties of encoded POF and PDF
proteins inP. tricornutum
Protein property POF PDF
Length 440.6 477.4
Residue weight 110.9 110.8
Charge 11.4 10.8
Isoelectric point 7 6.9
shows that among the four libraries with maximum var-iation in expression, the high decadienal (HD) library displayed considerably more transcripts without a defined domain (POFs). The high CO2 (C1, C4) libraries
have a roughly equal number of PDF and POF
transcripts. Similar trends were seen when the analysis was repeated for diatom-specific transcripts (present in at least one of the two diatoms under study; e-value cut-off 10-5) or core transcripts also present in 14 other eukaryotic genomes (described in Materials and meth-ods) (Figure 6b). We observed that the largest number of diatom-specific transcripts was found in the high dec-adienal (HD) library, followed by the high CO2(C1, C4)
libraries. These differences may imply that proteins with no recognizable homologs or domains may exhibit pre-ferential involvement in species-specific regulatory and signaling networks [37]. As a case in point, the high decadienal treatment is known to induce programmed cell death and may be involved in regulating diatom population sizes [20,35].
Expression analysis of diatom orthologous genes
The above described cDNA libraries fromP. tricornu-tum are accessible through the diatom EST database, together with seven libraries fromT. pseudonana[41]. Because two of the conditions were examined in both species (iron limitation (FL) and nitrogen starvation (NS) [42]), we could make a comparative analysis of the response of each diatom. A total of 346 and 278 tran-scripts were found to be differentially expressed in
[image:9.595.57.543.89.338.2]P. tricornutumunder iron limitation (FL) and nitrogen starvation (NS) conditions, respectively. Among these transcripts, around 50% (174 in FL and 163 in NS) have Figure 4InterPro domain representation of transcripts expressed in the high CO2conditions.(a)High CO2after 1 day (C1);(b)high CO2
after 4 days (C4).(c)The 30 most highly represented InterPro domains across all the predicted gene models in theP. tricornutumgenome shown for comparison.
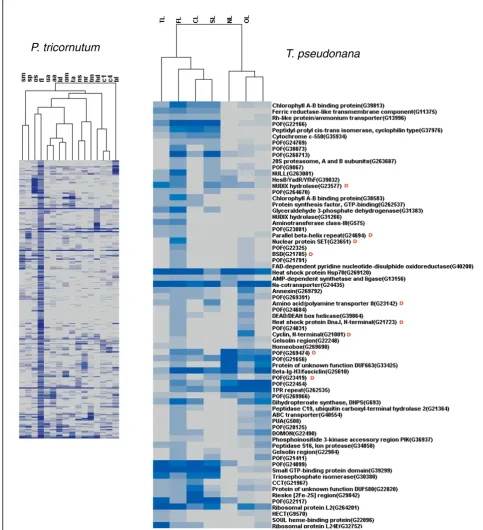
[image:9.595.57.291.479.682.2]orthologs in T. pseudonana(e-value cutoff 10-5) and a significant number of these are also responsive to the same treatment in this second diatom. Figure 7 shows hierarchical clustering of the 346 P. tricornutum FL transcripts together with 71 T. pseudonana putative orthologs that are also expressed under iron limitation (FL). Within this set we can find diatom-specific POFs as well as transcripts with recognizable domains such as transcription factors (Figure 7). We can also find genes encoding photosynthetic components and putative cell wall proteins (fasciclin, gelsolin, annexin), implying that the global reprogramming of cellular metabolism observed in P. tricornutum [33] may be common to other diatoms as well. In a similar analysis performed with the 163 T. pseudonana orthologs of the nitrate starvation responsive P. tricornutum genes, 46 were found to be differentially expressed in the same condi-tion in T. pseudonana (Additional file 10). These include genes encoding components of nitrogen meta-bolism, regulatory pathways, and a range of POFs. Only one of the genes expressed in response to nitrate starva-tion in both diatoms is diatom-specific, whereas nine of the iron responsive genes were classified as being dia-tom-specific (compare Figure 7 and Additional file 10). This could suggest that diatom responses to iron have evolved specifically in diatoms, whereas nitrate starva-tion responses may constitute a more general organis-mal response.
Whole-genome expression profiling using a tiled array inT. pseudonana led to the identification of previously
un-annotated TUs [42]. Among these 3,470 TUs, 1,458 were also found in the P. tricornutum genome (e-value cutoff 10-5), and of these, 1,086 were expressed under various conditions in P. tricornutum. Additional file 11 shows the expression patterns of these genes and it is apparent that many of these TUs are highly expressed in the high decadienal (HD) cDNA library. This result is consistent with the previous observations revealing the unique expression patterns of diatom-specific gene families and ‘unknown’ genes in the HD library (for example, Figure 6).
Expression patterns of bacterial genes
[image:10.595.60.537.90.302.2]The functional significance of these bacterial genes was explored with reference to their orthologs in other bac-terial genomes using the COG database of bacbac-terial orthologous gene clusters [44]. The set of bacterial genes identified inP. tricornutum were found to repre-sent 19 different COG classes (Additional file 10), with genes belonging to ‘energy production and conversion’ being the most highly expressed. By contrast, genes belonging to the categories of intracellular trafficking, secretion, cell motility, and chromatin structure were under-expressed.
Gene composition and expression
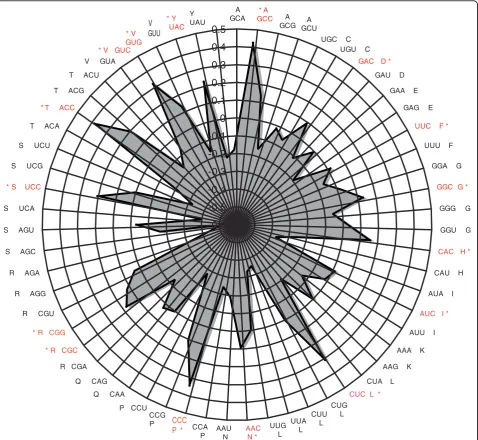
In a pilot analysis with the 12,136 cDNAs from the OS library, it was shown that transcripts that are repre-sented by higher numbers of ESTs show higher levels of guanine and cytosine nucleotides at the third codon position (GC3) [25]. To examine the significance of cor-relation between expression level and codon usage bias, we derived a codon usage table using the predicted gene models for P. tricornutum, which is available at [45]. We applied correspondence analysis to study the relative synonymous codon usage [46] in the highly expressed genes across all the libraries. Codon Adaptation Index values were then calculated using CodonW [47]. Corre-spondence analysis allowed the identification of the first four axes (components) that explain the majority of the variance (30.6%) in codon usage amongP. tricornutum
putative coding sequences (CDSs). The principal axis (F1) contributes 15.5% to the total variance, while the second axis (F2) explains only 6%. Consequently, we can conclude that F1 is the main factor driving codon usage heterogeneity inP. tricornutum. We therefore chose the projection of points (the 59 codons) along F1 and used these coordinates as an estimator of the relative usage of degenerate codons within each CDS (Figure 8). The preferred codons are generally C-ending, in agreement with previous reports [25]. Therefore, C-ending codons are likely to be translationally optimal. An additional interesting feature ofP. tricornutumCDSs is the relative lack of G3 ending codons among quartets.
Discussion
TheP. tricornutumcDNAs described in this report were obtained from cells grown in 16 different conditions of ecological relevance, and are publicly available in a digi-tal gene expression database [48]. In todigi-tal, they corre-spond to 86% of the predicted genes in the genome, and are therefore a useful basis for exploring gene expres-sion patterns. As demonstrated here they can also be used to probe the function of genes that do not show significant homology to transcripts in other sequenced genomes. How many of the remaining 14% ofP.
tricor-nutum gene models that lack EST support actually
representbona fidegenes is unknown [8]. The fact that we could detect an additional 1,968 TUs that lack gene models shows the limitations of current gene prediction programs to detect diatom genes, and sets an upper limit of 12,370 genes in P. tricornutum, in the same range as the upper count of 14,862 genes predicted by expression analysis inT. pseudonana[42]. The number of diatom genes that encode small RNAs rather than proteins is also unclear at this time, although the expressed P. tricornutumgenes that lack homology to known sequences do appear in general to encode pro-teins with the typical biochemical characteristics of
P. tricornutumproteins (Table 3).
Due to the phylogenetic distance of diatoms from most of the eukaryotes for which whole genome sequences are available, comprehensive cDNA collec-tions also provide an important resource to improve gene prediction. For example, in P. tricornutum only 28% of the gene models could be predicted by homol-ogy-based methods; the others were predicted using the cDNAs reported here as a training set for ab initio
methods [8]. This data set will also be of importance for the growing number of diatom genome projects, for example, fromPseudo-nitzschia multiseries and Fragilar-iopsis cylindrus, as well as for other heterokont sequen-cing projects.
An important aspect of the current study is that 15 of the libraries were generated from non-nomalized mRNA populations and using the same methodologies (the ori-ginal library (OS) described previously in [21] was gen-erated using a different method). The gene expression patterns in each culture condition can therefore be com-pared and contrasted with the other conditions. To facilitate this, we converted EST counts to frequencies in each library, examined redundancy by rarefaction, and diversity using Simpson’s index. Although all libraries were clearly under-saturated, there was wide variation in redundancy and diversity (Figure 1). Some libraries were characterized by having several sets of evenly abundant cDNAs - for example, the nitrate replete (NR) library - while others had fewer sets of highly abundant cDNAs - for example, the nitrate starved (NS) library. These results therefore provide information about how P. tricornutumresponds to the different conditions examined.
demonstrate clearly the biological significance of the measured transciptional outputs - for example, the nitrogen limited libraries show clear effects in genes involved in nitrogen metabolism.
Our analyses are especially valuable for the explora-tion of diatom genes with undefined funcexplora-tions because expression profiling can shed light on their functional significance [49]. Many of these genes encode proteins that lack recognizable InterPro domains, and have been classified as encoding POFs. Diatom genomes encode higher numbers of POFs than have been observed in other genomes (see Results). In rice and Arabidopsis, such genes are thought to contribute to ecological
differences and species diversity [37,38]. The predicted biochemical characteristics of these putativeP. tricornu-tum proteins suggest that they represent functional proteins. Approximately half of them are also found in
T. pseudonana, and interestingly can be seen in many
cases to be specifically induced by high decadienal treat-ment (Figure 6; Additional file 11). This aldehyde is of interest because it has been implicated in regulating dia-tom population densities [20,50], so these genes deserve attention as being of potential importance in the control of population density and programmed cell death.
[image:13.595.60.539.89.529.2]proposed on the basis of experimental observations; for example, the commonalities of nitrate, ammonium and urea assimilation [7,43] can be seen in the similar expression profiles of the NS, AA, and UA libraries, and the reprogramming of diatom photosynthesis in response to iron limitation [33] is reflected in the com-mon gene expression profiles between the FL library and the blue light (BL) library (Figure 2). Conversely, the two abiotic stress libraries - low temperature (TA) and low salinity (OM) - display similar expression pro-files (Figure 2), in agreement with the known overlap in the response to these stresses in other organisms [8]. These expected results are satisfying, but more impor-tantly they increase confidence that the methodologies used can help resolve other less well understood pro-cesses involved in each individual response. For exam-ple, when hierarchical clustering is done using only the small set of 177 expressed transcription factors inP. tri-cornutum, the relationships observed between the differ-ent libraries are essdiffer-entially the same as can be seen when using all 9,145 TUs [17] (Figure 2). Hence, the methodologies reported here can help identify transcrip-tion factors associated with differential expression in the different growth conditions. Conversely, genes of unknown function can be recruited to a specific response, for example, those induced in response to high decadienal. Such correlations provide a reasonable basis to explore the function of such genes.
Finally, our studies have helped to understand better the roles in diatoms of genes of probable bacterial ori-gin. These acquired bacterial genes have undergone modifications, such as gene fusions and novel domain reorganizations [8]. The observed diversity of their phy-logenetic origins, derived from a wide range of different bacterial groups, is reflected in their functional diversity in that they belong to 19 different COG categories. Many are expressed in different conditions (Additional file 12), which may reflect the functional adaptation of acquired bacterial genes to important metabolic and regulatory processes. In other cases, they are not strongly expressed - for example, genes in the intracellu-lar trafficking, cell motility, secretion, and chromatin structure categories - which may indicate that genes derived from the secondary endosymbiotic parents have been retained for these functions.
Although there can be no substitute for laboratory-based exploration of gene function, the sheer numbers of diatom-specific genes of unknown function necessi-tates the availability of high throughput in silico
approaches that can allow diatom researchers to identify interesting candidate genes that likely play key func-tions. We believe that the resources described here represent a significant step forward for characterizing diatom genes, as highlighted by PtTU G49202, a
P. tricornutumgene of unknown function that is extre-mely highly expressed (Table 2), and PtTU G55010, a carboxylase of unknown function that we have linked to the diatom response to high CO2. Reverse genetics
approaches such as RNA interference [14] can now be directed towards genes such as these in order to define their precise functions experimentally and to help understand the specific innovations that have led to the dominance of diatoms in contemporary ecosystems.
Conclusions
The unbiased statistical methods used in the current study to analyze diatom gene expression profiles in dif-ferent conditions can provide insights of biological rele-vance for understanding how diatoms respond to their environment, and in particular can pinpoint genes with unassigned functions for targeted studies. The digital gene expression database that we have established [48] represents a new resource for identifying candidate dia-tom-specific genes involved in processes of major ecolo-gical relevance.
Materials and methods Library conditions
A total of 15 cDNA libraries were constructed to explore the molecular responses ofP. tricornutumto a range of conditions, in addition to the previously reported library [21]. The different libraries are summar-ized in Table 1 and Additional file 1, and the rationale for choosing each condition is summarized below. All libraries are derived from cells in mid-late exponential phase.
Geographically widely distributed strains of P. tricor-nutumshow interesting intra-species genetic and pheno-typic diversity [26] and undergo morphological transitions between three possible morphotypes [9]. To explore the functional adaptations of different morpho-types, we made libraries from each of them. The triradi-ate morphotype (TM) library was constructed from mRNAs extracted from cells grown by repeated subcul-turing of the Pt8 accession under gentle agitation (80 rpm) in order to obtain a culture with 70% of triradiate cells. The oval morphotype (OM) library was made using the Pt3 accession grown at low salinity, and the tropical accession (TA) library was obtained from Pt9 cells grown at low temperature (15°C), treatments that both induce the formation of oval cells [26]. Cells were obtained from cultures either following a shift to hypo-salinity 10% in Brown’s artificial sea water (ASW) [26] for Pt3 or after a shift from 28°C to 15°C for Pt9.
shown to trigger stress responses and may control bloom dynamics in phytoplankton populations [20]. Two libraries, low decadienal (LD) and high decadienal (HD), were constructed to explore the genes expressed in response to sublethal (0.5μg/ml) and lethal (5 μg/ml) concentrations of decadienal after 6 h treatment, respectively.
All other libraries were derived from cultures of the Pt1 8.6 accession grown under different nutrient regimes that contained predominantly the fusiform mor-photype. Iron bioavailability is a major factor limiting photosynthetic biomass in the ocean [51] and Fe fertili-zation experiments have shown that diatoms show greater sensitivity to iron compared to other phyto-plankton [52]. The iron limited (FL) library was designed to study genes expressed at low concentrations of iron [33].
Diatoms also play a major role in nitrogen-based bio-geochemical cycles, and the diatom genome has been shown to encode various nitrate and ammonium trans-porters as well as the full complement of urea cycle enzymes [7,43]. cDNA libraries were therefore con-structed from cells grown under various nitrogen regimes to help understand the complexities of nitrogen metabolism in diatoms. We constructed four such libraries from nitrate-starved (NS) cells grown in 50μM of nitrate for 3 days, nitrate-replete (NR) cells grown in 1.12 mM nitrate, and from ammonium adapted (AA) and urea adapted (UA) cultures. The NS and NR cul-tures were grown under continuous light (120μmol.m-2. s-1). Walne medium [53] was used for the NR condition and NO3-concentration was reduced to 50 μM for the
NS condition. Cultures were sampled at both steady state (NR and NS) as well as during the N-depletion period.
Additionally, cDNAs obtained from cells grown in the presence and absence of silicic acid (SP and SM, respec-tively), formed a useful data set for studies of the silicifi-cation process [54].
To examine light-responsive gene expression, a cDNA library was generated from cultures grown in 12 h light-dark cycles to a concentration of 0.5 × 10⁶ cells per milliliter, subsequently dark adapted for 60 hours, and then exposed to blue light. Cells were harvested after 1 h induction by centrifugation for 15 minutes at 3,000g
and conserved at -80°C until RNA extraction.
Diatoms are responsible for about 20% of global car-bon fixation and many studies are underway to explore how diatoms may be affected by climate change. We therefore constructed cDNA libraries from cells grown under high carbon dioxide concentrations for one (C1) and 4 days (C4). The study of adaptation to such condi-tions is of particular interest in the light of increasing CO2 levels in the Earth’s atmosphere. For these
experiments cells were initially grown at 2.8 mM DIC with a dilution rate of 0.5 d-1(temperature and pH were kept constant at 20°C and 8.0, respectively), and high CO2conditions were obtained by increasing DIC to 3.2
mM by bubbling carbon dioxide into the cultures until the pH reached 7.0.
Moreover, we used three different culture methods; the NS, NR, C1 and C4 libraries were all grown in che-mostat cultures, whereas the OM, AA, UA, TA, FL, and other libraries were from batch cultures. For the carbon dioxide chemostat experiments the cells were grown at 20°C under continuous light (120 μmol.m-2.s-1) with an operating speed of 100 rpm. The cultures were run at 20% dilution rates and sampled at steady state at pH 8.0 and pH 7.0 as well as during the adjusting period between these two levels, that is, within 24 h after pH modification.
The above libraries can therefore be used to study growth conditions and gene expression in response to different stimuli of ecological relevance. Although the cDNA library that we originally characterized [21] was also incorporated into the current analyses, certain com-parisons with the other libraries should be viewed with caution because this cDNA library was constructed using different methodologies.
Library construction
The non-normalized cDNA libraries were constructed from poly(A)+ RNA purified from total extracted diatom RNA using the CloneMiner cDNA library construction kit (Invitrogen, Cergy-Pontoise, France) following the supplier’s instructions with minor modifications. Fifteen different conditions (Table 1) were used to maximize the detection of genes expressed with specific condition-enriched profiles. Sequencing was performed mostly from the 5′ end of the insert but for some of the libraries an attempt was made to sequence each clone at both the 5′and the 3′ends. When both EST reads over-lapped, the two sequences were fused into a consensus sequence using PHRAP [55].
Sequence analysis
transcripts contributed by each individual library to cluster size was also counted for all the TUs. An initial functional annotation of the non-redundant transcripts was done using blast2GO [34]. A more advanced anno-tation, such as the assignment of InterPro domains and KEGG pathways, was obtained from the P. tricornutum
genome annotation performed at the JGI.
The P. tricornutum and T. pseudonana sequences
were also compared by BLASTX to those in 14 other eukaryotic genomes, specificallyPhytophthora ramorum,
Phytophthora sojae,Chlamydomonas reinhardtii, Ostreo-coccus lucimarinus,Ostreococcus tauri,Cyanidioschyzon merolae,Monosiga brevicollis,Dictyostelium discoideum,
Ciona intestinalis, Caenorhabditis elegans, Aspergillus niger,Pichia stipitis,Arabidopsis thalianaand Saccharo-myces cerevisiae.
Library richness and diversity
The richness and diversity of cDNAs sampled from each cDNA library was estimated by statistical methods. Richness was estimated by rarefaction using the Analy-tic Rarefaction 1.3 program [58] to plot the rarefaction curve. Diversity was estimated using Simpson’s Recipro-cal Index and was Recipro-calculated using the formula (1/D), where D is Simpson’s index calculated using the for-mula [28]:
D n n
N N
= ∑ −
−
( )
( )
1 1
where n is the cluster size (the number of cDNAs of each TU in each library) and N is the library size (the total number of cDNAs sequenced in each library).
Data normalization and clustering
The count of cDNAs in each library and for each cluster (TU) was normalized to the library size by calculating the frequency (the EST count divided by the library size). This normalized data facilitated the comparisons of expression across different libraries in spite of the dif-ferences in library sizes. The frequency distribution of 9,145 TUs that are expressed more than once across one or more libraries were used for principal compo-nent analysis. Principal compocompo-nent analysis was done using R version 2.5.0 [59]. The same data set was used to identify genes and libraries with similar expression patterns using two-way hierarchical clustering. The hier-archical clustering was done using the program cluster 2.11 [30] and was visualized using‘Java Treeview’[31].
Differential gene expression
To study the distribution of transcripts across different libraries and to identify clusters that were significantly over-represented in certain growth conditions, we
examined the expression patterns of the 9,145 clusters. To eliminate differences in distribution caused by the differences in library size, the counts were normalized by converting them to frequency. To determine whether the differences in frequency distribution were due to statistically significant differential gene expression or to a random distribution, we calculated the log likelihood ratio, R-value [32], for each cluster. To define a cutoff R-value, we calculated the R-value for 9,145 random clusters generated from a Poisson distribution whose parameter is equal to the expected cluster size for that library 1,000 times. Additional file 4 shows the R-values of the actual 9,145 clusters and in the randomized data set. The probability of having an R-value above 23 was zero in all randomized clusters. We considered an R-value cutoff of 12, corresponding to 0.96 probability (that is, with 96% chance that it is not a random event), providing a useful basis to define genes displaying differ-ential mRNA levels in our cDNA libraries. The 8,402 transcripts with R-values above 12 were analyzed and catalogued as differentially expressed in the libraries having the top two highest frequencies. Transcripts represented by three or fewer cDNAs were removed.
Gene Ontology and COG annotation
The expressed TUs were subjected to GO annotation [60] and GO term enrichment analysis was done using the Blast2GO program [34]. COG annotation was done by RPS-BLAST [61] with the TUs as query using the Conserved Domain Database (CDD) [62]. COG identi-ties were assigned to any TU with a BLAST e-value below 10-3.
Codon usage analysis
The codon usage table for P. tricornutumwas obtained using the CDSs from JGI and using the EMBOSS pro-gram [63]. Codon Adaptation Index values were calcu-lated using CodonW [47]. This analysis was performed using all the CDSs starting with ATG, and the maxi-mum number or the sum of cDNAs across all the libraries was taken as an expression level index. Genes represented by more than 30 cDNAs were used as a reference set for highly expressed genes to study codon usage bias and its relation to expression level.
Additional material
Additional file 1: Supplementary Table S1. A comprehensive description of culturing conditions of the libraries.
expression levels are shown in an increasing scale from grey to dark blue, and are based on frequencies of ESTs in each library (see Materials and methods). For two-letter library codes, see Table 1.
Additional file 3: Supplementary Table S2. Diatom-specific genes expressed in both high and low decadienal libraries (HD and LD).
Additional file 4: Supplementary Table S3. R-values of the actual 9,145 clusters and that of the randomized data set.
Additional file 5: Supplementary Figure S2. Percentage of differentially expressed transcripts in primary y-axis, normalized to number of non-redundant transcripts (TUs) across the EST libraries and the percentage of transcripts with defined InterPro domains (PDFs) in the differentially expressed transcripts in the secondary y-axis. The arrow in the secondary y-axis at 56% corresponds to the percentage of PDFs found in all the putative proteins predicted in theP. tricornutumgenome (5,825 out of 10,402 protein models). For two-letter library codes, see Table 1.
Additional file 6: Supplementary Table S4. The 71 transcripts that were expressed at least once across all the libraries.
Additional file 7: Supplementary Table S5. GO terms that are over-represented in each library (P< 0.001). In this table we also show over-represented GO terms shared between libraries.
Additional file 8: Supplementary Figure S3. Distribution ofP. tricornutumPDFs in other organismal groups. Numbers in parentheses indicate the number of genes with defined protein domains (PDF) and the number outside the parentheses represent the total number of genes in each organismal group.
Additional file 9: Supplementary Table S6. The top 20 IPR domains expressed across all the libraries and the number of ESTs for each domain.
Additional file 10: Supplementary Figure S4. Hierarchical clustering of transcripts defined as being differentially expressed under the nitrate starved condition (NS) inP. tricornutumalong with the hierarchical clustering of corresponding orthologs expressed in the nitrate limited condition (NL) inT. pseudonana. Expression levels are shown in an increasing scale from grey to dark blue, and are based on frequencies of ESTs in each library (see Materials and methods). For two-letter library codes, see Table 1 and the Figure 7 legend.
Additional file 11: Supplementary Figure S5. Hierarchical clustering showing the expression patterns ofP. tricornutumorthologs of the novel genes identified by tiling array inT. pseudonana[42]. Expression levels are shown in an increasing scale from grey to dark blue, and are based on frequencies of ESTs in each library (see Materials and methods). For two-letter library codes, see Table 1.
Additional file 12: Supplementary Figure S6. Expression of bacterial orthologous genes inP. tricornutum. (A) Plot showing the number of transcripts of bacterial origin expressed across the 16 different growth conditions. The primary y-axis shows the number of transcripts and the secondary y-axis shows the average frequency of these expressed transcripts.(B)Expression profiling of the genes of putative bacterial origin along with their COG categories. The gradient of blue shows the level of expression, with the darker colors being the highly expressed genes. The red color shows the lack of expressed transcripts. For two-letter library codes, see Table 1.
Additional file 13: Supplementary Table S7. Bacterial genes and their expression across different libraries along with the domain and genomic location.
Abbreviations
AA: ammonium adapted; ASW: artifical sea water; BL: blue light; C1: high CO21 day; C4: high CO24 days; CDS: coding sequence; DIC: dissolved
inorganic carbon; EST: expressed sequence tag; FL: iron limited; GO: Gene Ontology; HD: high decadienal; JGI: Joint Genome Institute; LD: low decadienal; NR: nitrate replete; NS: nitrate starved; OM: oval morphotype; OS: original standard; PDF: protein with defined function; POF: protein with
obscure function; SM: silicate minus; SP: silicate plus; TA: tropical accession; TM: triradiate morphotype; TU: transcriptional unit; UA: urea adapted.
Acknowledgements
Funding for the Diatom Digital Gene Expression Database was from the European Union-funded Diatomics project and the Agence Nationale de la Recherche (France). cDNA construction and DNA sequencing was funded by Genoscope (France). We are grateful to Pierre Vincens, Jean-Pierre Roux and Edouard Bray for managing the server and the software and for their help in web interface creation, Ikhlak Ahmed for his help with statistical analysis using R statistical language, as well as Igor Grigoriev and Alan Kuo from JGI. We would also like to thank Patrick Wincker, Julie Poulain and the technical staff of Genoscope for their essential contribution to the experimental part of the work, as well as Franck Anière and the entire system network team at Genoscope. The database is freely available on the web at [48]. TheP. tricornutumcDNAs have been submitted to the NCBI dbEST (GenBank accession numbers [GenBank:CD374840] to [GenBank:CD384835] and [GenBank:BI306757] to [GenBank:BI307753]).
Author details
1Institut de Biologie de l’Ecole Normale Supérieure, CNRS UMR 8197 INSERM
U1024, Ecole Normale Supérieure, 46 rue d’Ulm, 75005 Paris, France.2Current
address: EMBL - European Bioinformatics Institute, Wellcome Trust Genome Campus, Hinxton, Cambridge CB10 1SD, UK.3CEA - Institut de Génomique,
Genoscope and CNRS UMR 8030, 2 rue Gaston Crémieux CP5706, 91057 Evry, France.4Current address: J Craig Venter Institute, 11149 N. Torrey Pines
Rd, Suite 220, La Jolla, CA 92037, USA.5Physiologie et Biotechnologie des Algues, IFREMER, BP 21105, 44311 Nantes, France.6Marine Biogeochemistry,
IFM-GEOMAR Leibniz-Institut für Meereswissenschaften, Düsternbrooker Weg 20, D-24105 Kiel, Germany.7Université de Nantes, EA 2160, Laboratoire‘Mer,
Molécule, Santé’, Faculté des Sciences et Techniques, 2 rue de la Houssinière, 44322, BP 92208, 44322 Nantes Cedex 3, France.8School of Oceanography,
University of Washington, 616 NE Northlake Place, Seattle, WA 98105, USA.
9
University of East Anglia, School of Environmental Sciences, Norwich Research Park, Norwich NR4 7TJ, UK.10Department of Plant Sciences,
Weizmann Institute of Science, Rehovot 76100, Israel .
Authors’contributions
UM performed the bioinformatics analyses and prepared the manuscript, KJ performed codon usage analysis and provided advice on data interpretation, JLP, BMP, JW, and MK perfected RNA extraction and library construction, and performed DNA sequencing, assembly and annotation, AEA, JPC, ADM, MH, RK, JLR, PJL, VMJ, AM, TM, MSP and AV prepared cultures and provided critical advice on analysis outputs, EVA helped in data interpretation, CB coordinated the work and finalized the manuscript. All authors have read and approved the manuscript.
Received: 23 October 2009 Revised: 11 May 2010 Accepted: 25 August 2010 Published: 25 August 2010
References
1. Baldauf S:An overview of the phylogeny and diversity of eukaryotes.J Systematics Evol2008,46:263-273.
2. Yoon HS, Hackett JD, Ciniglia C, Pinto G, Bhattacharya D:A molecular timeline for the origin of photosynthetic eukaryotes.Mol Biol Evol2004,
21:809-818.
3. Patron NJ, Rogers MB, Keeling PJ:Gene replacement of fructose-1,6-bisphosphate aldolase supports the hypothesis of a single photosynthetic ancestor of chromalveolates.Eukaryot Cell2004,
3:1169-1175.
4. Moustafa A, Beszteri B, Maier UG, Bowler C, Valentin K, Bhattacharya D:
Genomic footprints of a cryptic plastid endosymbiosis in diatoms.
Science2009,324:1724-1726.
5. Nelson DM, Treguer P, Brzezinski MA, Leynaert A, Queguiner B:Production and dissolution of biogenic silica in the ocean - Revised global estimates, comparison with regional data and relationship to biogenic sedimentation.Global Biogeochem Cycles1995,9:359-372.
6. Raven JA, Waite AM:The evolution of silicification in diatoms: inescapable sinking and sinking as escape?New Phytologist2004,
7. Armbrust EV, Berges JB, Bowler C, Green BR, Martinez D, Putnam NH, Zhou S, Allen AE, Apt KE, Bechner M, Brzezinski MA, Chaal BK, Chiovitti A, Davis AK, Demarest MS, Detter JC, Glavina T, Goodstein D, Hadi MZ, Hellsten U, Hildebrand M, Jenkins BD, Jurka J, Kapitonov VV, Kröger N, Lau VVY, Lane TW, Larimer FW, Lippmeier JC, Lucas S,et al:The genome of the diatomThalassiosira pseudonana: Ecology, evolution, and
metabolism.Science2004,306:79-86.
8. Bowler C, Allen AE, Badger JH, Grimwood J, Jabbari K, Kuo A, Maheswari U, Martens C, Maumus F, Otillar RP, Rayko E, Salamov A, Vandepoele K, Beszteri B, Gruber A, Heijde M, Katinka M, Mock T, Valentin K, Verret F, Berges JA, Brownlee C, Cadoret JP, Chiovitti A, Choi CJ, Coesel S, De Martino A, Detter JC, Durkin C, Falciatore A,et al:The Phaeodactylum genome reveals the evolutionary history of diatom genomes.Nature
2008,456:239-244.
9. Borowitzka MA, Volcani BE:Polymorphic diatomPhaeodactylum tricornutum- ultrastructure of its morphotypes.J Phycol1978,14:10-21. 10. Apt KE, KrothPancic PG, Grossman AR:Stable nuclear transformation of
the diatomPhaeodactylum tricornutum.Mol Gen Genet1996,252:572-579. 11. Dunahay TG, Jarvis EE, Roessler PG:Genetic transformation of the diatoms
Cyclotella crypticaandNavicula saprophila.J Phycol1995,31:1004-1012. 12. Falciatore A, Casotti R, Leblanc C, Abrescia C, Bowler C:Transformation of
nonselectable reporter genes in marine diatoms.Mar Biotechnol (NY)
1999,1:239-251.
13. Poulsen N, Chesley PM, Kroger N:Molecular genetic manipulation of the diatomThalassiosira pseudonana(Bacillariophyceae).J Phycol2006,
42:1059-1065.
14. De Riso V, Raniello R, Maumus F, Rogato A, Bowler C, Falciatore A:Gene silencing in the marine diatomPhaeodactylum tricornutum.Nucleic Acids Res2009,37:e96.
15. Harada H, Nakajima K, Sakaue K, Matsuda Y:CO2sensing at ocean surface
mediated by cAMP in a marine diatom.Plant Physiol2006,142:1318-1328. 16. Kilian O, Kroth PG:Identification and characterization of a new conserved motif within the presequence of proteins targeted into complex diatom plastids.Plant J2005,41:175-183.
17. Falciatore A, d’Alcala MR, Croot P, Bowler C:Perception of environmental signals by a marine diatom.Science2000,288:2363-2366.
18. Siaut M, Heijde M, Mangogna M, Montsant A, Coesel S, Allen A, Manfredonia A, Falciatore A, Bowler C:Molecular toolbox for studying diatom biology inPhaeodactylum tricornutum.Gene2007,406:23-35. 19. Tanaka Y, Nakatsuma D, Harada H, Ishida M, Matsuda Y:Localization of
soluble beta-carbonic anhydrase in the marine diatomPhaeodactylum tricornutum. Sorting to the chloroplast and cluster formation on the girdle lamellae.Plant Physiol2005,138:207-217.
20. Vardi A, Formiggini F, Casotti R, De Martino A, Ribalet F, Miralto A, Bowler C:
A stress surveillance system based on calcium and nitric oxide in marine diatoms.PLoS Biol2006,4:e60.
21. Scala S, Carels N, Falciatore A, Chiusano ML, Bowler C:Genome properties of the diatomPhaeodactylum tricornutum.Plant Physiol2002,
129:993-1002.
22. Maheswari U, Montsant A, Goll J, Krishnaswamy S, Rajyashri KR, Patell VM, Bowler C:The Diatom EST Database.Nucleic Acids Res2005,33:D344-347. 23. Merchant SS, Prochnik SE, Vallon O, Harris EH, Karpowicz SJ, Witman GB,
Terry A, Salamov A, Fritz-Laylin LK, Marechal-Drouard L, Marshall WF, Qu LH, Nelson DR, Sanderfoot AA, Spalding MH, Kapitonov VV, Ren QH, Ferris P, Lindquist E, Shapiro H, Lucas SM, Grimwood J, Schmutz J, Cardol P, Cerutti H, Chanfreau G, Chen CL, Cognat V, Croft MT, Dent R,et al:The
Chlamydomonasgenome reveals the evolution of key animal and plant functions.Science2007,318:245-251.
24. Matsuzaki M, Misumi O, Shin-I T, Maruyama S, Takahara M, Miyagishima SY, Mori T, Nishida K, Yagisawa F, Yoshida Y, Nishimura Y, Nakao S, Kobayashi T, Momoyama Y, Higashiyama T, Minoda A, Sano M, Nomoto H, Oishi K, Hayashi H, Ohta F, Nishizaka S, Haga S, Miura S, Morishita T, Kabeya Y, Terasawa K, Suzuki Y, Ishii Y, Asakawa S,et al:Genome sequence of the ultrasmall unicellular red algaCyanidioschyzon merolae10 D.Nature
2004,428:653-657.
25. Montsant A, Jabbari K, Maheswari U, Bowler C:Comparative genomics of the pennate diatomPhaeodactylum tricornutum.Plant Physiol2005,
137:500-513.
26. De Martino A, Meichenin A, Shi J, Pan K, Bowler C:Genetic and phenotypic characterization ofPhaeodactylum tricornutum
(Bacillariophyceae) accessions.J Phycol2007,43:992-1009.
27. Chao A:Estimating the population-size for capture recapture data with unequal catchability.Biometrics1987,43:783-791.
28. Simpson EH:Measurement of diversity.Nature1949,163:688-688. 29. Huang X, Madan A:CAP3: A DNA sequence assembly program.Genome
Res1999,9:868-877.
30. Eisen MB, Spellman PT, Brown PO, Botstein D:Cluster analysis and display of genome-wide expression patterns.Proc Natl Acad Sci USA1998,
95:14863-14868.
31. Saldanha AJ:Java Treeview - extensible visualization of microarray data.
Bioinformatics2004,20:3246-3248.
32. Stekel DJ, Git Y, Falciani F:The comparison of gene expression from multiple cDNA libraries.Genome Res2000,10:2055-2061.
33. Allen AE, Laroche J, Maheswari U, Lommer M, Schauer N, Lopez PJ, Finazzi G, Fernie AR, Bowler C:Whole-cell response of the pennate diatomPhaeodactylum tricornutumto iron starvation.Proc Natl Acad Sci USA2008,105:10438-10443.
34. Conesa A, Gotz S, Garcia-Gomez JM, Terol J, Talon M, Robles M:Blast2GO: a universal tool for annotation, visualization and analysis in functional genomics research.Bioinformatics2005,21:3674-3676.
35. Vardi A, Bidie KD, Kwityn C, Hirsh DJ, Thompson SM, Callow JA, Falkowski P, Bowler C:A diatom gene regulating nitric-oxide signaling and
susceptibility to diatom-derived aldehydes.Curr Biol2008,18:895-899. 36. Mulder NJ, Apweiler R, Attwood TK, Bairoch A, Bateman A, Binns D, Bork P,
Buillard V, Cerutti L, Copley R, Courcelle E, Das U, Daugherty L, Dibley M, Finn R, Fleischmann W, Gough J, Haft D, Hulo N, Hunter S, Kahn D, Kanapin A, Kejariwal A, Labarga A, Langendijk-Genevaux PS, Lonsdale D, Lopez R, Letunic I, Madera M, Maslen J,et al:New developments in the InterPro database.Nucleic Acids Res2007,35:D224-D228.
37. Gollery M, Harper J, Cushman J, Mittler T, Girke T, Zhu JK, Bailey-Serres J, Mittler R:What makes species unique? The contribution of proteins with obscure features.Genome Biol2006,7:R57.
38. Gollery M, Harper J, Cushman J, Mittler T, Mittler R:POFs: what we don’t know can hurt us.Trends Plant Sci2007,12:492-496.
39. Maumus F, Allen AE, Mhiri C, Hu H, Jabbari K, Vardi A, Grandbastien MA, Bowler C:Potential impact of stress activated retrotransposons on genome evolution in a marine diatom.BMC Genomics2009,10:624. 40. Roudier F, Teixeira FK, Colot V:Chromatin indexing in Arabidopsis: an
epigenomic tale of tails and more.Trends Genet2009,25:511-517. 41. Maheswari U, Mock T, Armbrust EV, Bowler C:Update of the Diatom EST
Database: a new tool for digital transcriptomics.Nucleic Acids Res2009,
37:D1001-1005.
42. Mock T, Samanta MP, Iverson V, Berthiaume C, Robison M, Holtermann K, Durkin C, BonDurant SS, Richmond K, Rodesch M, Kallas T, Huttlin EL, Cerrina F, Sussmann MR, Armbrust EV:Whole-genome expression profiling of the marine diatomThalassiosira pseudonanaidentifies genes involved in silicon bioprocesses.Proc Natl Acad Sci USA2008,105:1579-1584. 43. Allen AE, Vardi A, Bowler C:An ecological and evolutionary context for
integrated nitrogen metabolism and related signaling pathways in marine diatoms.Curr Opin Plant Biol2006,9:264-273.
44. Tatusov RL, Fedorova ND, Jackson JD, Jacobs AR, Kiryutin B, Koonin EV, Krylov DM, Mazumder R, Mekhedov SL, Nikolskaya AN, Rao BS, Smirnov S, Sverdlov AV, Vasudevan S, Wolf YI, Yin JJ, Natale DA:The COG database: an updated version includes eukaryotes.BMC Bioinformatics2003,4:41. 45. ThePhaeodactylum tricornutumDigital GeneExpression Database.[http://
www.diatomics.biologie.ens.fr/EST/Pt-GM.cod].
46. Sharp PM, Li WH:The Codon Adaptation Index - a measure of directional synonymous codon usage bias, and its potential applications.Nucleic Acids Res1987,15:1281-1295.
47. CBRG, Oxford University.[http://www.molbiol.ox.ac.uk/CBRG_home.shtml]. 48. ThePhaeodactylum tricornutumDigital GeneExpression Database..
[http://www.diatomics.biologie.ens.fr/EST3/].
49. Horan K, Jang C, Bailey-Serres J, Mittler R, Shelton C, Harper JF, Zhu JK, Cushman JC, Gollery M, Girke T:Annotating genes of known and unknown function by large-scale coexpression analysis.Plant Physiol
2008,147:41-57.
50. Ianora A, Miralto A, Poulet SA, Carotenuto Y, Buttino I, Romano G, Casotti R, Pohnert G, Wichard T, Colucci-D’Amato L, Terrazzano G, Smetacek V:
51. Behrenfeld MJ, Bale AJ, Kolber ZS, Aiken J, Falkowski PG:Confirmation of iron limitation of phytoplankton photosynthesis in the equatorial Pacific Ocean.Nature1996,383:508-511.
52. Tsuda A, Takeda S, Saito H, Nishioka J, Nojiri Y, Kudo I, Kiyosawa H, Shiomoto A, Imai K, Ono T, Shimamoto A, Tsumune D, Yoshimura T, Aono T, Hinuma A, Kinugasa M, Suzuki K, Sohrin Y, Noiri Y, Tani H, Deguchi Y, Tsurushima N, Ogawa H, Fukami K, Kuma K, Saino T:A mesoscale iron enrichment in the western Subarctic Pacific induces a large centric diatom bloom.Science2003,300:958-961.
53. Walne PL:The effects of colchicine on cellular organization in Chlamydomonas. I. Light microscopy and cytochemistry.Am J Bot1966,
53:908-916.
54. Vartanian M, Descles J, Quinet M, Douady S, Lopez PJ:Plasticity and robustness of pattern formation in the model diatomPhaeodactylum tricornutum.New Phytol2009,182:429-442.
55. Documentation for Phrap and cross_match..[http://bozeman.mbt. washington.edu/phredphrap/phrap.html].
56. JGI Genome Portal.[http://genome.jgi-psf.org/phatr2/phatr2home.html]. 57. Altschul SF, Madden TL, Schaffer AA, Zhang JH, Zhang Z, Miller W,
Lipman DJ:Gapped BLAST and PSI-BLAST: a new generation of protein database search programs.Nucleic Acids Res1997,25:3389-3402. 58. Analytic Rarefaction 1.3.[http://www.uga.edu/strata/software]. 59. The R Project for Statistical Computing..[http://www.R-project.org]. 60. Harris MA, Clark J, Ireland A, Lomax J, Ashburner M, Foulger R, Eilbeck K,
Lewis S, Marshall B, Mungall C, Richter J, Rubin GM, Blake JA, Bult C, Dolan M, Drabkin H, Eppig JT, Hill DP, Ni L, Ringwald M, Balakrishnan R, Cherry JM, Christie KR, Costanzo MC, Dwight SS, Engel S, Fisk DG, Hirschman JE, Hong EL, Nash RS,et al:The Gene Ontology (GO) database and informatics resource.Nucleic Acids Res2004,32:D258-D261. 61. Altschul S, Madden T, Schaffer A, Zhang JH, Zhang Z, Miller W, Lipman D:
Gapped BLAST and PSI-BLAST: A new generation of protein database search programs.Nucleic Acids Res1997,25:3389-3402.
62. Marchler-Bauer A, Anderson JB, Cherukuri PF, DeWweese-Scott C, Geer LY, Gwadz M, He SQ, Hurwitz DI, Jackson JD, Ke ZX, Lanczycki CJ, Liebert CA, Liu CL, Lu F, Marchler GH, Mullokandov M, Shoemaker BA, Simonyan V, Song JS, Thiessen PA, Yamashita RA, Yin JJ, Zhang DC, Bryant SH:CDD: a conserved domain database for protein classification.Nucleic Acids Res
2005,33:D192-D196.
63. Peers G, Price NM:Copper-containing plastocyanin used for electron transport by an oceanic diatom.Nature2006,441:341-344. doi:10.1186/gb-2010-11-8-r85
Cite this article as:Maheswariet al.:Digital expression profiling of novel diatom transcripts provides insight into their biological functions. Genome Biology201011:R85.
Submit your next manuscript to BioMed Central and take full advantage of:
• Convenient online submission
• Thorough peer review
• No space constraints or color figure charges
• Immediate publication on acceptance
• Inclusion in PubMed, CAS, Scopus and Google Scholar
• Research which is freely available for redistribution