ICT expenditure and trends in the UK
construction industry in facing the
challenges of the global economic crisis
Underwood, J and Khosrowshahi, F
Title
ICT expenditure and trends in the UK construction industry in facing the
challenges of the global economic crisis
Authors
Underwood, J and Khosrowshahi, F
Type
Article
URL
This version is available at: http://usir.salford.ac.uk/22598/
Published Date
2012
USIR is a digital collection of the research output of the University of Salford. Where copyright
permits, full text material held in the repository is made freely available online and can be read,
downloaded and copied for noncommercial private study or research purposes. Please check the
manuscript for any further copyright restrictions.
www.itcon.org - Journal of Information Technology in Construction - ISSN 1874-4753
ICT EXPENDITURE AND TRENDS IN THE UK CONSTRUCTION
INDUSTRY IN FACING THE CHALLENGES OF THE GLOBAL
ECONOMIC CRISIS
SUBMITTED: July 2011.
PUBLISHED: March 2012 at http://www.itcon.org/2012/2 EDITOR: Amor R.
Jason Underwood, Dr,
School of the Built Environment, University of Salford, M5 4WT, United Kingdom; j.underwood@salford.ac.uk
Farzad Khosrowshahi, Professor,
School of the Built Environment and Engineering, Leeds Metropolitan University, , LS1 3HE, United Kingdom;
f.khosrowshahi@leedsmet.ac.uk
SUMMARY: The role of ICT has evolved from a tool and utility to become a strategic asset for any organisation towards delivering business improvement and value. Furthermore, the importance of ICT-based innovation is recognized in bringing productivity improvements and sustainable competitive advantage to industry. Construction is an extremely information-intensive and knowledge-based industry. Therefore organisations need to fully embrace ICT in order to remain competitive. The construction industry has invested heavily in ICT; however expenditure still remains relatively low when compared to other sectors. Economic conditions strongly affect ICT investment and the recent worldwide financial crisis has led to organisations taking urgent measures as they review all aspects of their business overheads and expenditure, which ICT represents a significant proportion. This paper presents a study that was undertaken at the heart of the economic downturn to investigate the current ICT operating and capital expenditure, coping strategies, and forecasting trends for the UK construction industry. Analysis of the responses from within the top 200 UK contractor and consultant organisations suggest that managers of companies consider ICT as a driver for process efficiency and an imperative enabler to facilitate flexible information processing and communications infrastructure through which the company can collaborate and transact business with its clients, consultants, and supply-chain partners. This is despite persisting problems associated with value chain integration. However, the impact of the current economic downturn requires restraining of operational and capital budgets, which in turn, requires radical optimization of ICT resources leading to ‘more for less’.
KEYWORDS: Construction Industry, ICT, Economic Downturn, Expenditure, Cost Reduction and Measures, ICT Budget, ICT Trends.
REFERENCE: Jason Underwood, Farzad Khosrowshahi (2012) ITC expenditure and trends in the UK construction industry in facing the challenges of the global economic crisis, Journal of Information Technology in Construction (ITcon), Vol. 17, pg. 25-42, http://www.itcon.org/2012/2
COPYRIGHT: © 2012 The authors. This is an open access article distributed under the terms of the Creative
1.
INTRODUCTION
Information and communications technology (ICT) has evolved to become a major asset for any organisation to deliver business efficiency and value in the 21st century. Today, the importance of the strategic value of ICT to deliver competitive advantage is now widely recognized at the board and senior management levels of businesses (Alshawi, et al 2008). There have been significant increases in ICT investments over the last two decades. The UK Office for National Statistics report on e-Economy (2007) identified business investment in ICT goods and services doubled from 1992 to 2004 and outpaced growth in total investment. From 1992 to its peak in 2004, investment in ICT grew by 165% to £34.9 million. Growth between 1992 and 2004 was 117% compared to a steady growth of 101% in total investment over the same period. This was despite investment in ICT flattening in the run up to 2000 and slightly dipping in 2003 as a result of the burst of the ‘dot-com’ bubble and post ‘Millennium Bug/Y2K’.
Moreover, ICT innovations are increasingly having important implications beyond business to socioeconomic development and growth due to their role in introducing and diffusing the concepts of knowledge sharing, community development and through the promotion of equality (Bhatnagar 2005, Kodakanchi et al 2006, van der Wiel 2000). Colecchia and Shreyer (2002) found through a comparative study of nine OECD countries that ICT contributed between 0.2 and 0.5 percentage points per year to economic growth over the 1980s and 90s. This contribution was found to rise to a range from 0.3 to 0.9 percentage points per year during the second half of the 1990s. The importance of ICT based innovation in bringing productivity improvements and competitive advantage to industry is also highlighted in a recent European task force study on ICT sector competitiveness and uptake (European Commission 2006).
On the other hand, the economic climate strongly impacts on investments in ICT with organisations being more inclined to cut ICT budgets during a period of economic recession or uncertainty (Computer Economics 2007). The world declined into recession in Q4 of 2008 as it witnessed the worst economic crisis since the great depression of the 1930’s (Bivens 2010). Recovery across the globe is forecast to be slow and drawn out. This is expected to be further exasperated in the UK by the election of the coalition government to office in 2010 and their policies on addressing the country’s huge national debt through significant and rapid cuts on public spending (IMF 2009, is4profit 2010, Williams 2010). Businesses are faced with the predicament of making essential economies in terms of their ICT investments. At the same time organisations need to ensure operating performance while also enabling some essential ICT development and modernization activities, which are imperative in preparing the organisation for the eventual economic recovery.
2.
ICT INVESTMENT IN CONSTRUCTION
The construction industry is one of the largest contributors of wealth creation to Europe’s business economy, accounting for 9.7% of gross domestic product (GDP) and almost 60% of gross fixed capital formation (European Commission 2006). The industry is extremely information-intensive and knowledge-based and therefore construction organisations need to fully embrace ICT if they are to remain competitive (BERR 2008). The industry is traditionally renowned for low margins, low levels/barriers to market entry, poor investment in R&D, etc. (Bew and Underwood 2009) On the one hand, ICT has continued to receive significant levels of investment (NCC 2009, CICA 1982). However, when compared to other sectors construction still ranks relatively low in terms of ICT expenditure as a percentage of turnover and ICT spend per head. The National Computing Centre Benchmark of IT Spending (NCC 2009) ranked construction as the second lowest for both ICT expenditure indicators. The study gave a median value of 0.96% of turnover for the construction sector. This was just above the lowest ranked industry sector – manufacturing - at 0.79% and compared to 2.35% for all sectors. Education was ranked the highest industry sector with a median value of 4.59% of turnover followed by Business Services at 4.09%. The median value for construction for ICT spend per head was £1,786 with the lowest ranked sector – Health – at £1,364 and compared with an overall value of £3,277. In contrast, the highest ranked sector with a median value of £10,305 was Finance followed by Transport and Utilities at £4,800.
3.
ECONOMIC AFFECTS ON ICT INVESTMENT
Investment in ICT is strongly affected by overall economic conditions. Organisations are more inclined to invest in ICT during periods of economic prosperity. During a period of economic recession or uncertainty organisations tend to tighten their expenditure on new development with a shift in focus to cutting ICT budgets (Computer Economics 2007). An economic crisis emerged on a worldwide scale in late 2007 and early 2008, which was described as “the most serious financial crisis since the Great Depression” (eRollover 2009). The effect of the ensuing rapidly shrinking economy led to a drastic decline in construction output. The prognosis for the UK construction industry in the short term (2009 to 2010) was poor with the industry expected to contract in terms of construction output by at least 8% and potentially as high as 12% in 2009, followed by a more marginal decline of around 2% in 2010 (CSN 2010). The Office for National Statistics reported that the construction sector output declined by 4.9% in Q4 2008 compared with Q3, with the total economic output of the UK contracting by 1.6% (ONS 2009). Economic forecasts were for output in the UK construction sector to contract by 5.9% in 2009 and by 1.4% in 2010. This was expected to outpace that of the total economy (Oxford Economics 2009). Jones Lang LaSalle reported a 14.7% decline in construction output during 2009 (Jones Lang LaSalle 2009).
4.
RESEARCH METHODOLOGY
The study presented adopted an online survey targeting the top 200 organisations in the UK construction industry including the construction services business domains of civil engineering and building contractors, professional and design services, and house building and property development. A survey questionnaire was designed comprising a total of 34 questions grouped across eight areas as presented below. The questions and groupings are designed to identify the nature of the companies followed by an understanding of their plan for ICT expenditure, ICT budget trends, and cost reduction measures and technology trends.
1. Company size: Group/Division annual turnover and number of permanent staff (ICT users) 2. Construction activities: type of construction business activities undertaken in relation to civil and
building contracting/construction management; engineering, environmental and architectural professional services, quantity surveying, and project management; specialist and trade contracting; house building and building development; construction products manufacturing and distribution; other.
3. ICT operations/revenue budget - trend: total group or ICT budget in relation to current and previous financial years; expected best and worst case percentage change for the next financial year; Group or Division ICT budget for the current year as a % of turnover and per ICT user.
4. ICT operations/revenue budget - % breakdown: percentage of current budget that falls under ICT personnel, infrastructure – hardware/systems software, applications software, data networking, telephony (fixed line), mobile telephony, ICT department overheads, other(s).
5. Capital expenditure budget – trends: total capital expenditure budgets for the current and previous years; expected best and worst case percentage change on current financial year.
6. Cost reduction/effectiveness measures: expected percentage change on next year’s budget and the cost reduction/effectiveness measures currently being consider or that have been implemented in terms of staff costs and expenses, hardware and infrastructure, software applications, networking, and telephony (fixed line and mobile); the technology changes that are in use or being considered to provide more effective computing such as server and storage virtualization, virtual PC, cloud data storage, etc.
7. Managed services and outsourcing: next year’s expected percentage expenditure change; currently used managed services and outsource provides along with the expected level of expenditure change; the active issues or constraints relevant to the business and which affect decision making related to accelerated ICT changes in response to the economic climate in relation to capital expenditure limits, impending support end-of-life milestones, lack of staff, skills loss, evaluation timescales/resources, vendor and/or technology lock-in, other(s).
8. Coping strategies for changes in business directives for ICT services: priority objectives and coping strategies adopted to minimize the impact of budgetary constraints during the economic downturn on current services and future ICT-related developments.
FIG. 1: Distribution of survey respondents for contractors and professional services/ designers by size of organisation.
In order to enable comparisons with results from other benchmark surveys, the key financial performance indicators of total ICT expenditure either as a percentage of turnover or fee income (which includes the effect of the differing levels of turnover per employee characteristic of the different types of construction business) and total ICT expenditure per head (excluding non-ICT asset users from the number of staff used in calculating this) were used. In similarly facilitating comparisons with results from other surveys, ICT capital (Capex) and operational (Opex) expenditure were treated separately, while also providing key insights into ICT investment plans. The data was analysed through descriptive statistical techniques. The key findings from the study are presented in the subsequent sections in terms of the aforementioned three aspects, namely ICT expenditure, ICT budget trends, and cost reduction measures and technology trends.
5.
ICT EXPENDITURE
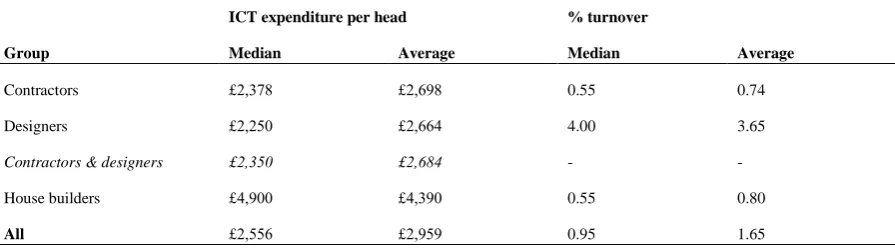
The study firstly explored the ICT expenditure in each of the business services domains expressed as a percentage of company turnover (% T.O.) and as an amount ‘per head’ (for ICT asset users only) (Table 1). Large contractors were found to spend more while in contrast, design firms spend less. Also, the level of expenditure for contractors increases with the size of organisation above £500M. Contractor organisations with a turnover larger than £1,000M report a median value of £3,258 per head which is 37% higher than the median value of £2,378 per head for all contractors. On the other hand, the average expenditure expressed as % T.O. for these two groups is approximately the same with 0.76% and 0.74%, respectively. The converse was found to be true for designers and professional services organisations in that those with a turnover in excess of 100M on average have lower levels of expenditure per head than those with a turnover of less than £100M (£1,475 and £2,807, respectively). The levels of ICT expenditure per head for contractors and professional services/designers were found to be almost identical at £2,695 and £2,665, respectively. However, the corresponding figure for house builders and developers is approximately two-thirds higher at £4,390 per head. Comparing the current survey findings with the values recorded in the Building on IT survey carried out in the 1990s (CICA, 1982) spending on ICT as a proportion of turnover (for contractors) has increased by 60% from 0.46% to 0.74%.
TABLE 1: UK construction ICT expenditure per head and % turnover/fee income.
Group
ICT expenditure per head % turnover
Median Average Median Average
Contractors £2,378 £2,698 0.55 0.74
Designers £2,250 £2,664 4.00 3.65
Contractors & designers £2,350 £2,684 - -
House builders £4,900 £4,390 0.55 0.80
[image:6.595.69.517.601.725.2]5.1
Standard ICT budget breakdown
[image:7.595.69.535.324.468.2]Next, the survey analyzed the ICT budgets of respondents in relation to seven main categories: staff, hardware/infrastructure, software applications, data networking, telephones, mobile, ICT overheads and ‘other’ costs. As shown in Table 2 the study found staff costs to represent just under one-third of typical ICT budgets, which average 30% for all-firms. Hardware and software each represent approximately a further 20% and the combination of data networking, mobile and other telephony costs represent a further 25% of budget totals. Other costs amount to 5%. The only significant differences found between the groups occur in the percentages for staff and data networking. The percentage of staff costs for contractors is approximately 50% higher than in professional services companies with the former recording an average of 34% compared with 24% in professional services organisations. This may be due to the differences in the numbers of supported sites in that the ICT user base in contracting organisations will, generally, be more widely dispersed across multiple project sites and thereby requiring a relatively higher number of ICT technicians to provide local support. Professional services staff will tend to be more concentrated in a smaller number of offices and therefore may be able to achieve higher levels of ICT staff efficiency. Data networking costs for professional services were found to be 33% higher than for contractors. This is likely to be due to the need for higher bandwidth connections to link multiple offices for efficient exchange of large CAD files. Counterbalancing this, professional services organisations spend about one-third less on telephony compared with the contractors group. Overall the aggregate share of the budget covering data networking, mobile and other telephone costs are almost identical between the two groups with 24.9% for contractors and 24.6% for professional services organisations.
TABLE 2. Average breakdown of construction ICT budgets.
S ta ff Ha rd w a re In fr a st ru ct u re A p p li ca ti o n S o ft w a re D a ta N et w o rk in g T el ep h o n y M o b il e IT O v er h ea d s Ot h er
Contractors 34.1% 20.6% 17.3% 12.6% 6.2% 6.1% 2.9% 0.3%
Designers 23.6% 23.8% 21.7% 16.4% 5.0% 3.2% 5.3% 0.9%
Developers 30.4% 23.2% 22.6% 10.8% 3.2% 6.0% 2.0% 1.8%
All firms 30.4% 21.8% 19.2% 13.4% 5.6% 5.3% 3.6% 0.8%
5.2
UK construction expenditure on ICT
It is possible for an estimate to be made for the total expenditure on ICT in the industry by establishing the average ICT expenditure based on turnover for the different groups in construction based on annual UK construction GDP of £100BN. Therefore, applying the average percentage of turnover for each group (i.e. professional services ICT expenditure of 3.6% and contractors, house builders and property developers ICT expenditure of 0.74% - Table 1) to the appropriate proportion of the construction GDP value indicates (i.e. professional services in construction of 17% total fee income and contractors, house builders and property developers turnover of 83%) that the total ICT expenditure in the UK is £1.2 billion.
An ICT expenditure survey carried out by the National Computing Centre (NCC) (NCC, 2009) identified median values for ICT expenditure in construction of £1,786 per head and 0.96% of turnover. These align with the results of the survey presented of £2,556 per head and 0.90% of turnover. This confirmation in findings positions the construction industry second from bottom in the all-sector industry rankings for ICT expenditure, as identified in the NCC 2009 survey, based on spend per head. However, interestingly house builders and developers would be second only to the finance sector when ranked on the same basis with a median spend of £4,900 per head. An all-industry median level of expenditure of £3,227 per end-user was recorded by NCC which compares with the equivalent whole-sample median value recorded by the study of £2,556 per head for construction, i.e. 20% less than the all-industry level.
lower values indicating a higher proportion of capital expenditure which is usually taken to be a positive indicator. However, this rule of thumb may no longer be strictly relevant as organisations begin to make more use of managed services incorporating rental components for hardware and software.
TABLE 3: Ratio of Opex to total ICT expenditure.
Company size
(No. of staff) ICT budget (Opex) Capex budget Total ICT expenditure Ratio: Opex/ Total
Above 2000 £9,004 £1,500 £10,504 86%
1000 – 2000 £4,500 £778 £5,278 85%
Up to 1,000 £1,471 £471 £1,942 76%
All £4,413 £833 £5,246 84%
6.
ICT BUDGETS TRENDS
The majority of respondents predict a fall in ICT budgets for 2010 in responding to the challenges of the current economic climate. Only 27% of firms predict an increase in ICT revenue budgets for next year in the ‘Best case’ scenario for the sample of contractors. 32% predicted that budgets would reduce and 41% predicted no change for 2010. Therefore nearly three-quarters of the sample are predicting either reducing or no change in ICT budgets in 2010. In the ‘Worst case’ scenario for contractors the proportions are 14% increase, 59% decrease, and 27% no change. The indicated changes would result in overall reductions in ICT expenditure in 2010 of between -0.8% (‘Best case’) and -3.6% (‘Worst case’) when applied across the whole sample.
Only 23% predict an increase in ICT revenue budgets for next year in the ‘Best case’ scenario for professional services organisations. 31% predicted that budgets would reduce while 46% predicted no change for 2010. These results are almost identical to the results found for the contractors group. The proportions are 9% increase, 73% decrease, and 18% no change for the ‘Worst case’ scenario. The indicated changes result in a neutral position for ICT expenditure change in 2010 (aggregate 0.0%) for the professional services group ‘Best case’ but a reduction of 6% in the ‘Worst case’ scenario when applied across the whole sample. Professional services organisations appear to be marginally more optimistic in the likely extent of budget reductions in the ‘Best case’ scenario but are indicating more severe cut-backs than the contractors group for ‘Worst case’ (Table 4).
TABLE 4: Summary of predicted aggregate changes in ICT revenue budgets in 2010 for Contractors, Professional Services/Design organisations and All organisations (inclusive of house building and property development organisations).
Best case ICT revenue budget change Worst case ICT revenue budget change
Contractors -0.8% -3.6%
Professional Services 0.0% -6.0%
All 0.0% -4.1%
6.1
Capital expenditure cut-backs
[image:8.595.62.521.496.565.2]6.2
Changes to expenditure
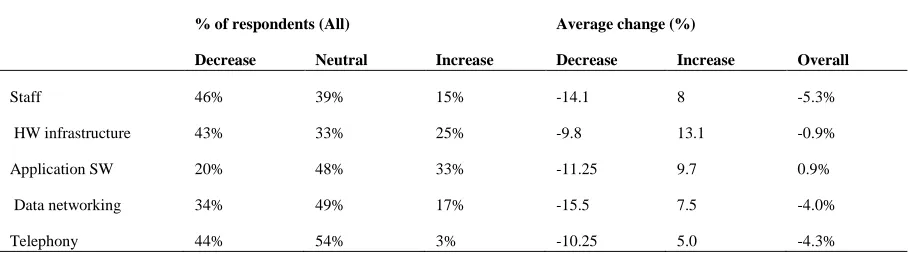
[image:9.595.66.522.168.295.2]The study examined how organisations’ expenditure on staff, hardware/infrastructure, software applications, data networking and telephony are likely to change in the next financial period. Table 5 shows that staff budgets are predicted to fall on aggregate by 5.3% and data networking and telephony costs by 4.0% and 4.3%, respectively. Reductions in hardware/infrastructure budgets are also predicted to fall but to a smaller extent (-0.9%). Application software is the only ICT budget category where the expenditure trend is for an increase of 0.9%.
TABLE 5: Forecast changes in ICT expenditure by budget category (All).
% of respondents (All) Average change (%)
Decrease Neutral Increase Decrease Increase Overall
Staff 46% 39% 15% -14.1 8 -5.3%
HW infrastructure 43% 33% 25% -9.8 13.1 -0.9%
Application SW 20% 48% 33% -11.25 9.7 0.9%
Data networking 34% 49% 17% -15.5 7.5 -4.0%
Telephony 44% 54% 3% -10.25 5.0 -4.3%
When these percentage changes are applied to the relevant proportions of the standard ICT budget breakdown (Section 5.1, Table 2), the calculated aggregate change for the group as a whole would be a reduction of 2.6%. This ‘predicted’ reduction of 2.6% in ICT spending would mean a loss to the ICT sector of at least £30M. The amount of this loss would increase to £50M when using the 'Worst case' forecast value of 4% reduction (based on the predicted aggregate ICT expenditure changes for all-firms).
7.
COST REDUCTION MEASURES & TECHNOLOGY TRENDS
One of the key objectives of the survey was to identify the full range of measures adopted by the sample group in response to the current economic climate. This included those actions that had already been undertaken and those that were being considered for the future. The survey also aimed to establish what newer technologies are being considered by organisations as a means of seeking permanent reductions in ICT costs for the longer term.
7.1
Staffing
As highlighted previously, staffing represents 30% of ICT budgets on average and in some cases as high as 45%. Therefore this is a prime area for organisations to seek budget efficiencies. In terms of organisations’ intentions on staff cost savings measures, a total of 63% had already actioned reductions in permanent staff. House builders, developers and professional services organisations appear to have taken the most decisive action in considering permanent staff reductions with 77% of professional services companies and 83% of house builders having already made reductions in permanent staff. In contrast, only 50% of organisations in the contractors group that have undertaken similar actions.
However, reducing the use of contractors was the most widely adopted measure overall with 68% of the survey sample having taken this step with very few organisations (5%) considering this for the future. 61% of organisations reported that they had left vacancies unfilled, while a further 15% of the sample were considering this.
FIG. 2: Staffing cost reduction measures.
7.2
Hardware & infrastructure
Organisations reported responding to the downturn in relation to hardware and infrastructure in the first instance by carrying out reviews and re-negotiating better deals on a wide range of support contracts for hardware and applications maintenance, data communications and telephony. 60% of organisations are taking this action with a further 15–20% considering it. Desktop and other hardware replacement projects have also been affected with 60% of organisations claiming that plans had been put on hold for the time-being. However, 30% of organisations mentioned the ‘purging of older equipment’ as their preferred choice with a view to reducing support costs. 25% had considered using some form of outsourcing or managed service arrangement in connection with their hardware replacement plans. This confirms that this is seen as an increasingly attractive proposition. Data centre consolidation was also identified as a popular strategy. 30% of organisations are planning to take advantage of increases in efficiency that can be achieved by concentrating server processing power in highly managed, secure and power efficient environments rather than in conventional, locally managed computer rooms which are widely dispersed across the organisation and are more costly to support. There were very few, if any, significant differences between the responding groups in their approaches to seeking cost reductions on hardware and infrastructure.
FIG. 3: Hardware and infrastructure longer-term cost reduction measures.
7.3
Networking
The combined costs of data networking and voice (mobile and fixed line) account for an average of 25% of total construction ICT budgets making this the second largest area of the budget (after Staff) and therefore a key target for cost reduction measures (Fig 4). The need for a sound networking strategy is key to the exploitation of newer networking technologies. Just less than 60% of all organisations reported that they had recently undertaken work in this area with a further 20% considering it.
58% of contractors had either recently changed or were in the process of changing service providers for data networking and telephones. 73% of contractors and 62% of professional services organisations either already had or were currently considering renegotiating tariffs on these contracts. There was a small sample interested in the new secure ‘Direct’ remote access facilities available within Microsoft’s Windows 7 as an alternative to other VPN client approaches.
[image:11.595.94.409.485.686.2]7.4
Telephony
There was also high activity in the area of telephony. The survey responses broadly mirror those for data networking whereby about two-thirds of organisations are making or considering changes in service providers to get better deals, equipment standardization and extending the use of VoIP as part of an integrated voice and networking strategy. 40% of those organisations sampled have implemented some form of call charge monitoring as a way of controlling telephone expenses and 20% report that that they are interested in using telephone expense management consultancy and monitoring software as a way of making further in-roads into potential cost savings.
7.5
Software
The range of efficiency and cost savings measures taken for software include almost 30% of organisations actively planning to retire older applications. A similar proportion are considering bringing application support in-house, possibly as a more cost effective way of managing the maintenance services cost ‘tail’ sometimes associated with legacy applications being phased out. However, the immediate impact of the recession has been to put many software application projects on hold with 60% reporting this (Fig. 5). Organisations are renegotiating better terms with their suppliers, reviewing their volume license agreements and considering plans for improved software asset management, e.g. license pooling.
[image:12.595.93.420.344.594.2]Software as a Service (SaaS) is being investigated by 20% of companies in relation to newer approaches. This builds on a similar proportion that is already using some form of SaaS. The use of Open Source software is also showing renewed signs of interest although only a small proportion of companies make any significant use of this.
FIG 5: Software cost reduction measures and strategy.
7.6
Managed services
reprographics and telephony recorded levels of 44% and 41% for managed service usage respectively. However, both were set to decline as organisations indicate a strong preference to bring these services back in house or integrate them within networking support contracts.
TABLE 6: Trends in the use of managed services.
All firms
Current usage Change (Increase/decrease) Trend
No. firms % total firms No of firms
% current users
% total firms
Networks 27 66% 11 41% 27% +1
Application maintenance & support 25 61% 8 32% 20% +2
Application development 21 51% 12 57% 29% -2
Server infrastructure management 20 49% 6 30% 15% +4
Server hosting 18 44% 8 44% 20% +2
Printing & reprographics 18 44% 7 39% 17% -7
Telephony 17 41% 8 47% 20% -6
Help desk 15 37% 3 20% 7% +1
Database administration 15 37% 3 20% 7% +1
PC support 14 34% 5 36% 12% -1
Training 12 29% 4 33% 10% -4
Some noticeable differences were also identified in the general trends established for the three main analysis groups (Table 7). For example, contractors are more positively inclined to the use of managed services with over 50% of organisations reporting arrangements in place for networks, application maintenance and support, server hosting and management, help desk, and database administration. The established trend for professional services/design organisations is away from the use of managed services with the exception of server infrastructure management, server hosting and help desk. Training, telephony, print and reprographics, and application development all show consistent trends for reductions in managed services that are evident for all groups. The trend towards a reduced reliance on third parties for application development services is of particular interest considering that organisations also indicated that software is the only area of the ICT budget that they are minded to increase the level of expenditure. The reasons for this are not exactly clear and this could be the subject of further investigation.
TABLE 7: Group comparisons of trends in managed services.
Net change in use by group
Managed services category Contractors Prof. Services
House Builders &
Developers All firms
Networks +3 -2 0 +1
Application maintenance & support +4 -1 0 +2
Application development -2 -1 +2 -2
Server infrastructure management +4 +1 -1 +4
Server hosting +3 0 -1 +2
Printing & reprographics -4 -3 0 -7
[image:13.595.66.531.548.722.2]Help desk +1 0 0 +1
Database administration 0 - +1 +1
PC support +1 -2 0 -1
Training -3 -1 0 -4
7.7
Key issues facing IT managers
Finally, the study identified that IT Managers are facing a variety of issues and challenges during the current economic climate and associated with severe funding constraints. The tight limits imposed by organisations on capital expenditure were unsurprisingly cited by over two-thirds of all ICT managers. Problems such as systems ‘end-of life’ (EOL) may become serious issues when capital is no longer available to push through essential upgrade work causing some organisations to accept the risk of continuing with systems beyond EOL milestones together with the inherent risks that this would entail. The lack of staff and skills loss was also raised as factors by a significant proportion of organisations. The current hold on recruitment highlighted by many organisations and discussed previously is clearly having an impact on the capacity of ICT departments to deal with operational issues and to push forward with new development projects.
8.
DISCUSSION
The results of this survey provide strong evidence that ICT continues to be an important driver of process efficiency and an indispensable tool for the modern construction enterprise. The 60% real term growth in ICT expenditure over the last 20 years reflects the position that is witnessed today with ICT embedded in virtually every aspect of the construction process and value-chain. The industry has significantly benefited from successive improvements to the changing fabric of ICT over that period and will, no doubt, continue to exploit opportunities presented by future technology developments. The aspiration of all industry ICT and company managers has been for a long time, and continues to be, simply for ICT ‘to work’. That is to provide a ubiquitous, fast, accessible, reliable, secure and flexible information processing and communications infrastructure through which the company can collaborate and transact business with its clients, consultants, and supply-chain partners.
However, the relative complexity of the construction project value chain and dynamic nature of business relationships within continues to produce some tough challenges for linking all of the raw ICT ingredients of hardware, software, communications, and ICT management expertise to create value-adding propositions. In this context along with the cost-conscious mindset of construction executives and company boards, ICT managers must set out plans for new investments in ICT that are capable of driving new efficiencies and creating enhanced capabilities that can directly support the business strategy. At the same time, the majority of companies have taken early and decisive measures to reduce areas of recurring ICT expenditure in the current recession. In many cases organisations have put on hold major software application and ICT infrastructure improvement projects. Although not an unexpected result given the prevailing circumstances and continuing weak economic outlook, the scale of overall reductions in ICT budgets for 2010 seems to represent more of a temporary limited correction rather than any permanent retrenchment and paring back of ICT spending plans and level of ICT ambition.
consolidation of data centers and making full use of virtualization technologies, can result in overall cost savings of up to 35% (EMA 2009; IDC 2008; Microsoft 2009). In addition to cost savings, virtualization technologies also provide environmental value through reduced carbon footprints and resource use (OGC 2011).
The metrics and benchmarks from the study provide an insight from which ICT teams and business managers can be better placed to create the business case for those changes required to keep their organisations at the forefront of ICT developments to support improvements in competitiveness and the delivery of enhanced client value. Furthermore, it is evident that organisations within the construction sector are planning to reduce their investment in all areas with the exception of applications. However, should the economic recovery not be as slow as initially forecast and bring about a premature end to the current economic crisis, this may well result in the reversal of several decisions. On the other hand, business directors have also indicated their desire to meet the challenges offered by the economic downturn. This could result in the introduction of new approaches and processes to ensure more is achieved with less. Therefore, it is reasonable to assume that irrespective of the actual time of recovery, one way or another the industry is very likely to benefit from the experience of a leaner approach to ICT investment as a result.
9.
CONCLUSION
This paper has presented a detailed analysis of current ICT operating and capital expenditure levels and forecast trends representing the UK construction industry’s top 200 building and civil engineering contractors, house builders and developers and professional services/design organisations. The study provides a unique insight into the current level of spending on ICT, the strategies organisations have adopted in order to contain and reduce costs in response to the current economic recession, and their future spending intentions.
Overall, the majority of organisations’ intentions are to ‘flat-line’ or reduce ICT operating budgets in the current financial year and hold capital expenditure at 2009 levels until such time as the economic outlook improves. The message from company executives to the ICT team for the immediate future will be a case of ‘more for less’. Staffing, hardware and telecommunications expenditure are the areas where the largest cost savings have been achieved. In contrast, software is the only category of the ICT budget where an overall net increase in expenditure is predicted.
Key industry benchmarks of total ICT expenditure per head (ICT user) and ICT expenditure (as a percentage of turnover or fee income) have been measured and analyzed by type of business and size of company and have highlighted some key differences. These benchmarks provide essential information for construction industry IT managers, CEOs and finance directors to assess the efficiency of the ICT function and as a baseline for planning new investment in modernized ICT services where potential cost reductions of between 20% and 30% may now be achievable.
The survey has also established for the first time an absolute growth trend in the use of ICT in the construction process. Comparing the current results with those established 20 years ago, ICT has grown in real terms by 60% since 1990. Total industry ICT expenditure now tops £1BN and represents approximately 1.2% of total UK construction output value compared with 1.0% of turnover in retail & wholesale and 0.79% in manufacturing sectors. However, expenditure per head still trails the all-sector average figure.
10.
ACKNOWLEDGEMENTS
The Building on IT 2010 survey was a collaborative effort by The Knowledge Practice, Construct IT For Business and the National Computing Centre. The authors would like to acknowledge the efforts of these collaborating organisations together with the survey sponsors and participating organisations for their support. Further information on the Building on IT 2010 survey is available at http://www.tkp.co.uk, http://www.construct-it.org.uk, and http://www.ncc.co.uk/cas.
11.
REFERENCES
Alshawi, M., Khosrowshahi, F., Goulding, J., Lou, E. & Underwood. J. (2008) Strategic Positioning of IT in Construction: An Industry Leaders’ Perspective, Construct IT For Business, UK, ISBN 9-781905-732449.
BERR (2008) Supporting Innovation in Services, Department for Business, Enterprise and Regulatory Reform, Crown copyright, URN 08/1126.
Bew, M. & Underwood, J. (2009) Delivering BIM to the UK Market, Handbook of Research on Building Information Modeling and Construction Informatics: Concepts and Technologies, IGI-Global December 2009, ISBN 978-1-60566-928-1.
Bhatnagar, S. (2005) ICT Investments in Developing Countries: An Impact Assessment Study, Information Technology in Developing Countries, Newsletter of the IFIP Working Group 9.4, 15, 2, 1-8.
Bivens, J. (2010) Worst economic crisis since the Great Depression? By a long shot, January 27th, Economic Snapshot. Economic Policy Institute.
CBI (2011) Economic Forecast. November 2011, CBI, UK.
CIC (2011) The Impact of the Recession on Construction Professionals: A View from an Economic Perspective, Construction Industry Council, UK.
CIC (2010) The Impact of the Recession on Construction Professionals: A View From the Front Line, Construction Industry Council, UK.
CICA (1982) Building on IT: A Survey of Information Technology Trends and Needs in the Construction Industry, CICA, UK.
Colecchia, A. & Shreyer, P. (2002) ICT Investment and Economic Growth in the 1990s: Is the United States a Unique Case? A Comparative Study of Nine OECD Countries, Review of Economic Dynamics 5, pp. 408–442.
Computer Economics (2010) IT Spending and Staffing Benchmarks 2010/2011, Computer Economics, Inc., CA, USA, ISBN: 0-945052-66-9
Computer Economics (2007) Ten-Year Trends in IT Spending and Outlook for 2007, Computer Economics, Inc., CA, USA, ISBN:
Couto, V., Divakaran, A., Mani, M.M., & Lantz, C. (2009) Survival vs. Success: How Companies Are Responding to the Recession, and Why It’s Not Enough, Booz & Company, USA.
eRollover (2009) The Mortgage and Financial Bust Started in the Fall of 2007, eRollover, USA.
CSN (2010) New Data Illustrates the Recession’s Severe Impact on Construction, The Construction Skills Network, UK.
EMA (2009) White Paper on Reducing Operational Expense (OpEx) with Virtualization and Virtual Systems Management, Enterprise Management Associates (EMA), USA.
European Commission (2006) ICT Uptake, Working Group 1. ICT Uptake Working Group draft Outline Report, October. Retrieved March 2008 from
IDC (2008) White Paper on Business Value of Virtualization: Realizing the Benefits of Integrated Solutions, IDC, USA.
IMF (2009) Global Recession to Be Long, Deep with Slow Recovery, IMF Survey Magazine, April 16th, International Monetary Fund.
is4profit (2010) Public Sector Spending Cuts Could Hit Construction, Small Business News, 18th March, is4profit.
Jones Lang LaSalle (2009) OnPoint UK Residential Market Forecasts - September 2009, Jones Lang LaSalle, Inc., Chicago, Illinois, USA.
Kodakanchi, V, Abuelyaman E, Kuofie, M.H.S & Qaddour, J. (2006) An Economic Development Model for IT in Developing Countries, Electronic Journal of Information Systems in Developing Countries, 28, 7, 1-9.
Leading Edge (2009) UK Construction Output Forecast 2009-13, Leading Edge Management Consultancy Ltd.
Microsoft (2009) White Paper on Application Virtualization Cost Reduction Study, Microsoft Corporation, USA.
NCC (2009) Benchmark of IT Spending 2009, National Computing Centre, UK, ISBN: 978-0-85012-951-9.
OGC (2011) White Paper on OGC Standards and Cloud Computing, OGC, Open Geospatial Consortium.
OSN (2009) UK Quarterly National Accounts Q4 2008, Office for National Statistics, UK.
OSN (2007) e-Economy: ICT Investment Outpaces Total Investment, Office for National Statistics, UK.
Oxford Economics (2009) UK Sectoral Prospects: Spring 2009, Oxford Economics Ltd. UK.
van der Wiel, H. (2000) ICT and the Dutch Economy: An Historical and International Perspective, CPB working paper 125.