An aly si s of t h e s ui t a bility of u si n g
t h e A-w e i g h ti n g filt e r fo r
e v al u a ti n g r o a d t r affic e x p o s u r e
To rij a M a r ti n e z , AJ, Fli n d ell, I H a n d R uiz, D P
T i t l e
An aly si s of t h e s ui t a bility of u si n g t h e A-w ei g h ti n g filt e r fo r
e v al u a ti n g r o a d t r a ffic e x p o s u r e
A u t h o r s
To rij a M a r ti n e z, AJ, F li n d e ll, I H a n d R uiz, D P
Typ e
C o nf e r e n c e o r Wo r k s h o p I t e m
U RL
T hi s v e r si o n is a v ail a bl e a t :
h t t p :// u sir. s alfo r d . a c . u k /i d/ e p ri n t/ 5 3 2 2 0 /
P u b l i s h e d D a t e
2 0 1 4
U S IR is a d i gi t al c oll e c ti o n of t h e r e s e a r c h o u t p u t of t h e U n iv e r si ty of S alfo r d .
W h e r e c o p y ri g h t p e r m i t s , f ull t e x t m a t e r i al h el d i n t h e r e p o si t o r y is m a d e
f r e ely a v ail a bl e o nli n e a n d c a n b e r e a d , d o w nl o a d e d a n d c o pi e d fo r n o
n-c o m m e r n-ci al p r iv a t e s t u d y o r r e s e a r n-c h p u r p o s e s . Pl e a s e n-c h e n-c k t h e m a n u s n-c ri p t
fo r a n y f u r t h e r c o p y ri g h t r e s t r i c ti o n s .
1. Intro
Under the environmen contribution content has physically d Although th indicator fo traffic nois criticized si system’s re 4]. Thus frequency c unit does n potential fo Alayrac et proved to annoyance
1(c) European A
wei
exp
Anton ISVR, Diego Departm Summ A-weig annoya overcom authors when th the ann conduc evaluat and (ii broad-b obtaine annoya address noises PACS n oduction1typical circ nts, becau n of engin s been found
dominant [1-he A-weight or quantifyin se, the dB(A ince it overc educed sensit , it is cla content is h not give a tru or low freque al. [6] the A be adequat evoked by lo
Acoustics Asso
ghting
posure
io J. Torija,
University of
P. Ruiz
ment of Appl
ary
ghted sound ance. How mpensates fo s claim agains he low freque noyance pote cted with the ting sound en ) analyzing a band low freq ed results sug ance between s a better des and HF noise
o. 43.50.Qp, 43.
culation dyn use of t ne noise, d as (at least
-2].
ted sound le ng the anno A) scale has compensates tivity at low aimed that
highly domi ue picture o ency noise [5 A-weighted s te for asses ow-frequenc
ociation
filter fo
Ian H. Flind
f Southampton
lied Physics, U
pressure lev ever, strong or the hearing st the using o ency content i ential for low e goal of: (i) nvironments c and quantifyin
quency (LF), ggest that the
LF and MF n scription of th es.
.50.Rq, 43.50.Lj
namics in ur the prevai low freque to some ext
evel is the m oyance of ro s been stron s for the hea w frequencies
when the nant the dB f the annoya 5]. Howeve sound level ssing perce cy noises.
or eval
dell
n, SO17 1BJ
University of
vel is the m criticism i g system’s re of A-weighted is highly dom w frequency n
analyzing th characterized
ng the differ medium freq A-weighting noises, but so he differences rban iling ency tent) main oad-ngly aring s [3-low B(A) ance er, in was ived The rega con imp high ann use Thu sim perc thei Ver betw freq exp con wer hav Als phy road pred
uating
Southampton Granada, 180most widely s associated educed sensiti d sound pressu minant since d
noises. For he convenien by the physic ence in audib quency (MF) filter properl ome improvem
s in perceived
e disparity arding the ntent to the p
portance of e h frequenci noyance lead
of A-weigh us, some s milar A-weig
ceived as lou ir low freque rsfeld et al. [ ween the hi quency cont plaining perc ntaining relat re judged as ving relative so, Torija an ysical domin
d traffic no dominance (
road tr
n, UK.
071 Granada,
used descrip d with the
ivity at low ure level for a dB(A) units do this reason, nce of using cal dominanc bility and per and high fre ly describes t ments have to d annoyance
of results f contributio perceived an each frequen ies) on the ds to the lack hting for asse studies sugg ghted soun uder and mo ency content [8] found tha igh frequenc ent as a hig ceived anno tively much s being mor ely much l nd Flindell [9
nance of lo oise does n (perceived an
raffic n
Spain.
ptor for eval dB(A) scale frequencies. assessing noi o not give a tr
a listening t the A-weigh ce of low freq
rceived annoy equency (HF)
the difference o be undertake
between both
found in th on of low nnoyance or ncy range (lo e prediction k of consensu essing road t gest that s d pressure ore annoying
t is [4,7]. N at the differe cy content a ghly influent
oyance, so high freque re annoying ow frequen 9] demonstra ow frequenc
not lead to nnoyance).
oise
luating noise e because it Thus, many se annoyance rue picture of test has been hted scale for quency noise; yance among noises. The e in perceived en in order to h MF and LF
he literature w frequency the relative ow, mid and n of noise us as for the traffic noise. ounds with levels are g the greater Nevertheless, ence in level and the low tial factor in that sounds ency content g than those ncy content. ated that the cy in urban o subjective
FORUM ACUSTICUM 2014 Torija, et al.: A-weighting for evaluating road traffic noise annoyance 7–12 September, Krakow
For these reasons, this work is aimed at analyzing the performance of the A-weighting for assessing the road traffic noise annoyance under indoor conditions, where the low frequency content is physically dominant. Also, the audibility threshold and the annoyance evoked by wide-band low- (LF), mid- (MF) and high-frequency (HF) noises is quantified.
2. Methods
2.1. Experiment 1: Indoor conditions
A 12.5 s master recording of continuous urban main road traffic noise (LAeq = 69 dBA) was
chosen as the basis for all the stimuli used in this experiment. The recorded master sound were carefully selected to avoid any extraneous noise sources other than continuous steady road traffic background noise with up to 5 individual vehicles being identifiable from time to time within the overall 12.5 second duration, but not prominent in the overall sound level time history. A filter for simulating the sound transmission through a window was applied. This filter was built using the values reported by Quirt [10] for a double 3-mm thick glazing, with an interpane spacing of 3 mm. After that, another filter was applied to simulate the reverberation effect (reverberation time = 0.5) of a typical medium-sized room. This filter was applied by using the software Sound Forge Pro 10.0.
The test sounds for this experiment were produced by boosting or cutting the LF (20-250 Hz), MF (315-2000 Hz) and HF (3150-20000 Hz) ranges. A low pass shelf filter and a high pass shelf filter were applied with – 9dB, -3 dB, + 3dB and +9 dB relative gain setting to synthesize the 8 filtered sound used in this test. The low pass shelf filter cut-off frequency was 315 Hz with a 0.1 octave transition. The high pass shelf filter cut-off frequency was 250 Hz with a 0.1 octave transition. The amplifier gain in the listening room was set so that the reference sound would play back at its corresponding sound level (LAeq = 50 dBA), and all
the test sounds were then reproduced without changing the overall gain setting.
Before starting the listening experiment, the aims and procedures were carefully explained to the listeners. The relative magnitude estimation (RME) method was used for evaluating the test sounds. For each test and condition, the participants were required to record their subjective impressions by comparing the target stimuli to the reference sound, as to two subjective attributes: perceived loudness and perceived
annoyance. It should be noted that a value of 100 was given to the reference sound as to both perceived loudness and annoyance. For each stimulus, the evaluation required 12.5 seconds for the reference sound and 12.5 seconds for the target sound with a 1 second gap between the two sounds and an allowance of 10 seconds for questionnaire completion. The order of presentation of the target sound was fully randomized.
2.2. Experiment 2: Audibility and perceived annoyance
In this experiment an 8 s master recording of the passing-by of an urban bus (LAeq = 68 dBA) was
chosen as the basis for all the test sounds. This sound was selected because of its important content in LF (engine noise), MF (rolling noise) and HF (gas exhaust noise). This master sound was filtered into three components: (i) LF sound, where a high pass shelf filter (cut-off frequency = 250 Hz) was applied for subtracting MF and HF components; (ii) MF sound, where a low pass shelf filter (cut-off frequency = 315 Hz) and a high pass shelf filter (cut-off frequency = 2000 Hz) was applied for subtracting the LF and HF components; (iii) HF sound, where a low pass shelf filter (cut-off frequency = 2500 Hz) was applied for subtracting the LF and MF components. These three test sounds were normalized at 70 dB.
In the audibility threshold task, for each frequency range, the test sounds were reproduced simultaneously along with a 70 dB pink noise (LAeq = 67 dBA). Thus, the test sounds were
varied in level from 50 dB (-20 dB ref to pink noise) to 74 dB (+4 dB ref to pink noise) in steps of 2 dB. At varying the level of the test sounds, the listener was asked to indicate when he/she was able to detect the road traffic sound.
2.3. Parti
Sixteen adu trial. All normal hea a thank you
2.4. Equi
[image:4.595.55.534.503.741.2]The listen soundproof Southampto generated v quality so loudspeaker console. T high-quality B2031A). calibrated i class 1 soun Analyser t microphone placed at th by the liste checked bef pink noise same system
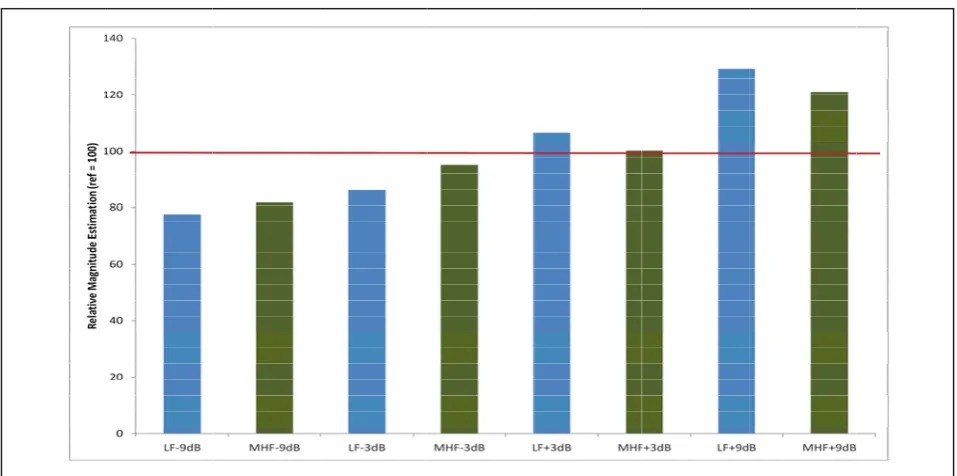
Figure 1. Pe
icipants
ult listeners listeners w aring ability. u gift as indu
ipment
ning trials fed room
on. All aud via a mains ound card,
rs via a sma The test sou y loudspeak The reprod immediately nd level met type 121, w e type 122
he positions ener’s head fore each tri .wav file sig m.
erceived ann
took part i were requir The partici ucement to ta
were co at the dio signals (.
stream lapto and then ll high quali unds were re ers (Behring duced soun y before eac ter (Norsonic with a Nor 25) with th s which wou
. The amp al using a re gnal reprodu
noyance for e
in this listen red to con
pants were p ake part.
nducted in University .wav files) w op with a g
sent to ity audio mix eproduced v ger Truth m nd levels w
ch trial usin c Environme sonic free-f he microph uld be occup plifier gain eference 80 d uced through
each stimulu ning firm paid
n a of were good the xing via 2 odel were ng a ental field hone pied was dBA h the us. 3. 3.1. In perc LF of t refe incr in – in f is o find con con mar perc con Fig betw and ove LF able ann regi wei ann LF Thu the con exp Results . Experim
Figure 1 is ceived anno and the MH the greater r erence soun reases in filt – 9 dB and + filter setting observed fo dings seem nditions, hig ntent, the v rginally dom ceived anno ntent should b ure 2 shows ween the A-d the percei erestimation content, the e to properly noyance with ions. Mea ighting sca noyance with and MHF re us, despite o LF content ntent is foun plaining the d
ment 1: Indo
s shown th oyance and t HF regions. relative diffe nd) in perc ter setting fo + 9 dB) than for MHF reg or both freq ms to indic gh physical variations in minant in ex oyance, but be still taken s the linear -, C- and D ived annoya of the subje e C- and D-w
y describe th h increases i anwhile, wit ale the va h increases i egions is app of the great under indoo nd as a facto differences i
or condition
e relationsh the filter set It is found erence (comp ceived anno
or LF region with the sam gion, a simil quency regio cate that u dominance n the LF xplaining di
t also that n into accoun
relationship D-weighted s ance. Beca ective impor weighting sc he variation i n filter settin th the use ariation in in filter setti propriately d physical do or condition or to be con in perceived
ns
hip between tting for the that despite pared to the oyance with n (especially me increases lar tendency ons. These under these of the LF content are fferences in t the MHF
nt.
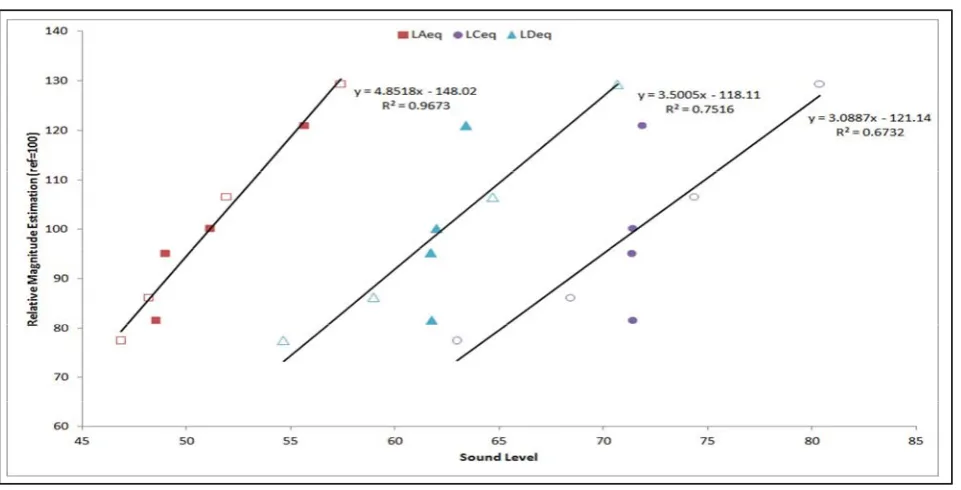
p (R2-value)
sound levels ause of the rtance of the cales are not in perceived ng for MHF of the A-perceived ing for both described.
FORUM ACUSTICUM 2014 Torija, et al.: A-weighting for evaluating road traffic noise annoyance 7–12 September, Krakow
Figure 2. Linear relationships for each frequency weighting evaluated. Filled symbols correspond to MHF filter gain and unfilled symbols to LF filter gain.
Because of its characteristics, the A-weighting scale is able to describe in a more appropriate way the differences as to the subjective importance between the LF and the MHF content.
3.2. Experiment 2: Audibility and perceived annoyance
[image:5.595.55.536.53.298.2]As showed by the Table I, the differences in audibility threshold among the three frequency regions, as referred to 70 dB pink noise, ranges between ~ 2 dB (LF-MF) and ~ 3.5 dB (LF-HF). As for the perceived annoyance, the differences among frequency regions notably increase, so that an average increment of ~ 11 dB (LF-MF) and ~ 16 dB (LF-HF) is observed. These data suggest that the audibility threshold, which is rather similar, is not an influential factor for explaining the observed differences as to perceived annoyance. Based on these findings, an equal-sensation level relationship among LF, MF and HF regions is suggested. It should be noted that the sensation level corresponds to the perceived annoyance as referred to the audibility threshold.
Table I. Audibility threshold, perceived annoyance and sensation level for each frequency region.
Audibility Threshold
Perceived Annoyance
Sensation Level
LF -9.38 16.25 25.63 MF -11.63 5.31 16.94 HF -12.75 0.31 13.06
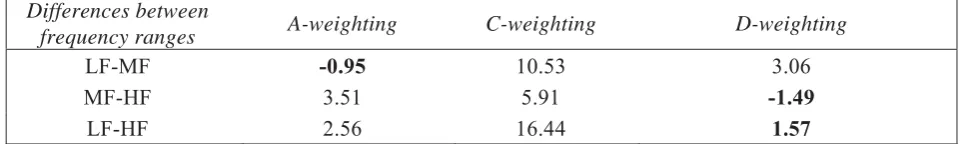
In Table II, the differences in sound level reported by the listeners for perceiving the LF, MF and HF filtered test sounds as equally-annoying is expressed using the A-, C- and D-weighting. As observed in Table II, the difference as to perceived annoyance between LF and MF is better described by the A-weighting than by the C and D weightings. However, among the evaluated frequency weightings, the best filter for describing the difference in perceived annoyance between MF-HF and LF-HF is the D-weighting.
[image:5.595.307.538.403.474.2]4. Conclusions
This work presents the results of two listening experiments which are aimed at analyzing the performance of the A-weighting for describing road traffic noise annoyance. In light of the obtained results can be concluded that: (i) at low sound levels (around 50 dBA) and with LF content physically dominant (indoor conditions) the A-weighting outperforms C and D A-weightings in explaining the variance of the annoyance as perceived by the listeners, since C and D filters overestimate the contribution of LF; (ii) at higher sound levels (around 68 dBA) the A-weighting properly describes the differences in perceived annoyance between LF and MF, but underestimates the contribution of the HF content. In this case, the D-weighting is the filter that gives the best description of the differences in perceived annoyance between both LF-HF and MF-HF. For this reason, a new frequency filter built from the A and D weightings could be proposed in order to enable a better description of the differences in perceived annoyance among wide-band LF, MF and HF road traffic sounds.
Acknowledgement
This work is funded by the University of Malaga and the European Commission under the Agreement Grant no. 246550 of the seventh Framework Programme for R & D of the EU, granted within the People Programme, «Co-funding of Regional, National and International Programmes» (COFUND), and Ministerio de Economía y Competitividad (COFUND2013-40259). Moreover, this work is also supported by the “Ministerio de Economía y Competitividad” of Spain under project TEC2012-38883-C02-02.
References
[1] U. Sandberg, J.A. Ejsmont: Tyre/road noise. Informex Ejsmont & Sandberg Handelsbolag, Sweden, 2002, pp. 1-640.
[2] A.J. Torija, D.P. Ruiz: Using recorded sound spectral profile as input data for real-time short-term urban road-traffic-flow estimation. Science of the Total Environment 435-436 (2012) 270-279.
[3] A. Kjellber, M. Goldstein, F. Gamberale: An assessment of dB(A) for predicting loudness and annoyance of noise containing low frequency noise. Journal of Low Frequency Noise Vibration 3 (1984) 10-16.
[4] M.E. Nilsson: A-weighted sound pressure level as an indicator of short-term loudness or annoyance of road-traffic sound. Journal of Sound and Vibration 32 (2007) 197-207.
[5] K. Persson, M. Björkman: Annoyance due to low frequency noise and the use of the dB(A) scale. Journal of Sound and Vibration 127 (1988) 491-497.
[6] M. Alayrac, C. Marquis-Favre, S. Viollon, J. Morel, G. Le Nost: Annoyance from industrial noise: Indicators for a wide variety of industrial sources. Journal of the Acoustical Society of America 128 (2010) 1128-1139. [7] H.G. Leventhall: Low frequency noise and annoyance.
Noise Health 6 (2004) 59-72.
[8] N.J. Versfeld, J. Vos, F.W.M. Geurtsen: Annoyance of individual vehicles pass-by noise for light and heavy vehicles. Journal of the Acoustical Society of America 96 (1994) 3335.
[9] A.J. Torija, I.H. Flindell: Differences in subjective loudness and annoyance depending on the road traffic noise spectrum. Journal of the Acoustical Society of America 135 (2014) 1-4.
[10] J.D. Quirt: Sound transmission through windows II. Double and triple glazing. Journal of the Acoustical Society of America 74 (1983) 534-542.
Table II. Differences in sound level among equally-annoying perceived frequency filtered sounds for each frequency weighting evaluated.
Differences between
frequency ranges A-weighting C-weighting D-weighting
LF-MF -0.95 10.53 3.06
MF-HF 3.51 5.91 -1.49
LF-HF 2.56 16.44 1.57
[image:6.595.53.539.105.177.2]