frogs and toads
Zeng, Y, Luo, S, Liao, WB, Jehle, R and Kotrschal, A
http://dx.doi.org/10.1002/ece3.2459
Title
Sexual selection impacts brain anatomy in frogs and toads
Authors
Zeng, Y, Luo, S, Liao, WB, Jehle, R and Kotrschal, A
Type
Article
URL
This version is available at: http://usir.salford.ac.uk/id/eprint/40088/
Published Date
2016
USIR is a digital collection of the research output of the University of Salford. Where copyright
permits, full text material held in the repository is made freely available online and can be read,
downloaded and copied for noncommercial private study or research purposes. Please check the
manuscript for any further copyright restrictions.
For more information, including our policy and submission procedure, please
Ecology and Evolution 2016; 1–10 www.ecolevol.org © 2016 The Authors. Ecology and Evolution
|
1published by John Wiley & Sons Ltd.
Received: 1 February 2016
|
Revised: 20 July 2016|
Accepted: 18 August 2016DOI: 10.1002/ece3.2459
This is an open access article under the terms of the Creative Commons Attribution License, which permits use, distribution and reproduction in any medium, provided the original work is properly cited.
Abstract
Natural selection is a major force in the evolution of vertebrate brain size, but the role of sexual selection in brain size evolution remains enigmatic. At least two opposing schools of thought predict a relationship between sexual selection and brain size. Sexual selection should facilitate the evolution of larger brains because better cogni
-tive abilities may aid the competition for mates. However, it may also restrict brain size evolution due to energetic trade- offs between brain tissue and sexually selected traits. Here, we examined the patterns of selection on brain size and brain anatomy in male anurans (frogs and toads), a group where the strength of sexual selection differs mark
-edly among species, using a phylogenetically controlled generalized least- squared (PGLS) regression analyses. The analysis revealed that in 43 Chinese anuran species, neither mating system, nor type of courtship, or testes mass was significantly associ
-ated with relative brain size. While none of those factors rel-ated to the relative size of olfactory nerves, optic tecta, telencephalon, and cerebellum, the olfactory bulbs were relatively larger in monogamous species and those using calls during courtship. Our findings support the mosaic model of brain evolution and suggest that while the inves
-tigated aspects of sexual selection do not seem to play a prominent role in the evolu
-tion of brain size of anurans, they do impact their brain anatomy.
K E Y W O R D S
anuran, brain anatomy, brain size evolution, comparative analysis, courtship types, mating system, PGLS, testes mass
1Key Laboratory of Southwest China
Wildlife Resources Conservation (Ministry of Education), China West Normal University, Nanchong, Sichuan, China
2School of Environment & Life
Sciences, University of Salford, Salford, UK
3Zoological Institute, Stockholm University,
Stockholm, Sweden
Correspondence
Wen Bo Liao, Key Laboratory of Southwest China Wildlife Resources Conservation (Ministry of Education), China West Normal University, Nanchong, Sichuan, China. Email: [email protected]
O R I G I N A L R E S E A R C H
Sexual selection impacts brain anatomy in frogs and toads
Yu Zeng
1|
Shang Ling Lou
1|
Wen Bo Liao
1|
Robert Jehle
2|
Alexander Kotrschal
31
|
INTRODUCTION
Most theories of vertebrate brain size evolution consider natural selection as the main evolutionary force shaping its diversification (Striedter, 2005). Indeed, a great number of comparative and exper
-imental studies demonstrated the interplay between natural selection and brain size evolution (Aiello & Wheeler, 1995; Gonzalez- Voyer & Kolm, 2010; Kotrschal et al., 2013; Liao, Lou, Zeng, & Merilä, 2015; Sol, Székely, Liker, & Lefebvre, 2007; Tsuboi et al., 2015). Additionally, within the last years, evidence across a wide range of taxa has ac
-cumulated that sexual selection might also affect brain size evolu
-tion (Boogert, Fawcett, & Lefebvre, 2011; Fitzpatrick et al., 2012; Garamszegi, Eens, Erritzøe, & Møller, 2005; García- Peña, 2013;
Gonzalez- Voyer & Kolm, 2010; Kotrschal et al., 2015; Lemaitre, Ramm, Barton, & Stockley, 2009; Pitnick, Jones, & Wilkinson, 2006). The sub
-set of studies that provide empirical evidence that sexual selection and brain size are associated, base their argument on the rationale that better cognitive skills afforded by larger brains increase the chances of obtaining mates (Boogert et al., 2011; Garamszegi et al., 2005). We adhere to the broad definition of “cognition” as comprising “all mech
-anisms that invertebrates and vertebrates have for taking in informa
-tion through the senses, retaining it, and using it to adjust behavior to local conditions” (Kotrschal & Taborsky, 2010; Shettleworth, 2010).
development of costly sexual traits may limit the energy available for the development of the brain (Fitzpatrick et al., 2012; Gonzalez- Voyer & Kolm, 2010; Pitnick et al., 2006). However, several studies did not detect any relationships between the investigated aspects of sexual selection and brain size, such as testes size (Lemaitre et al., 2009; Schillaci, 2006), or sexual coloration (Kotrschal et al., 2013). The degree to which sexual selection impacts brain evolution is therefore still an open question.
Within the field of sexual selection, the mating system of a species has been suggested to drive the evolution of its brain size (García- Peña, 2013; Pitnick et al., 2006; Schillaci, 2006). Again, two opposing hypotheses predict the evolutionary relationship between the mating system and the brain size of vertebrates. The “sexual conflict hypoth
-esis” argues that the ongoing struggle between males and females to subvert the reproductive investment of the other sex is cognitively demanding (Arnqvist & Rowe, 2005). As a result, promiscuous spe
-cies will have relatively larger brains than spe-cies with genetic monog
-amy (Rice & Holland, 1997). Conversely, the “expensive sexual tissue” hypothesis contends that more intense sexual selection will constrain the evolution of brain size again due to energetic trade- offs with costly sexual organs, ornaments, or armaments (Garamszegi et al., 2005; Pitnick et al., 2006). Empirical evidence only partially supports this hypothesis. For instance, while Pitnick et al. (2006) found that bat species with larger brains have smaller testes than bats with smaller brains, Dechmann and Safi (2009) did not find such a relationship for another set of bat species. Besides whole brain size, the mating system can also affect the size of some brain regions. In primates, for example, the intensity of male–male competition is negatively associated with neocortex size and the neocortex is larger in monogamous species (Schillaci, 2008). Similarly, in cichlid fishes, the region analogous to the primates neocortex, the telencephalon, is larger in monogamous com
-pared to polygamous species (Pollen et al., 2007). Like the neocortex in porimates, the fish telencephalon integrates more complex cogni
-tive processes; both are likely selected for by the cogni-tive challenges of long- term pair bonds, which are typical for monogamous species. In contrast, a later study on a greater number of cichlid species did not find any association between sexual selection and telencephalon size (Gonzalez- Voyer & Kolm, 2010).
Courtship is often crucial in sexual selection (Andersson, 1994) and courtship calls and mate searching are two common behaviors during courtship. They give cues of the male’s reproductive status during female mate choice as well as during competition among males (Duellman & Trueb, 1986). Yet despite recognition that species differ
-ences in courtship behavior are modulated via differ-ences in distinct cell groups in different parts of the brain and that these cell groups have independent effects (Balaban, 1997), the relationship between the type of courtship and the evolution of the brain and its regions remains enigmatic.
Here, we examined the associations between relative brain size, the size of five main brain regions, and three fundamental traits of sex
-ual selection among 43 anuran species. Within this group, it is already established how phylogeny and ecology contribute to variation in brain morphology (Liao et al., 2015). Here, we investigated the effect of the
mating system (monandry vs. polyandry), the courtship type (attract
-ing mates with courtship calls vs. search-ing for mates quietly), and the intensity of sexual selection (using testes mass as proxy) on brain morphology by means of phylogenetically controlled generalized least- squared (PGLS) regression analyses. Anurans are an excellent model system to test these relationships because of their diverse breeding systems, ecology, and life histories (Byrne & Roberts, 2012; Duellman & Trueb, 1986). The extreme variance in the degree of sexual selection across species (Byrne, Simmons, & Roberts, 2003) allowed us to com
-prehensively test whether mating system and courtship type are asso
-ciated with differences in brain size and the size of brain regions (viz. olfactory nerves, olfactory bulbs, telencephalon, optic tectum, and cerebellum). Olfactory nerves were included because these are also used by most anurans to process olfactory information, often called smaller/accessory olfactory bulbs, and they may represent a distinct olfactory system (Taylor, Nol, & Boire, 1995).
There is debate whether vertebrate brain regions evolve in a mosaic or concerted manner, that is, whether brain regions increase and/or decrease with overall brain size or whether specific selection pressures can select for size changes of brain regions independently (see e.g., Barton & Harvey, 2000; Finlay, Darlington, & Nicastro, 2001; Gonzalez- Voyer, Winberg, & Kolm, 2009; Liao et al., 2015; Yopak et al., 2010). Our data set allows testing for those alternatives. If anuran brain regions evolve in a mosaic manner in response to sexual selection, we would expect single regions to vary independently. Concerted evolution would be indicated if overall brains but not single regions would vary in size. For the relationship between brain size and the chosen traits of sex
-ual selection, the hypotheses above give clear, yet at times opposing, predictions. However, for brain region volumes, it is difficult to make such predictions. This is so because the function of the separate brain regions is still only partly understood and because single regions some
-times have multiple functions (Striedter, 2005). However, the olfactory bulbs and optic tectum mainly integrate olfactory and visual informa
-tion, respectively; those regions are generally more prominent in spe
-cies with better olfactory and visual acuity (Butler & Hodos, 2005). Both vision and olfaction play prominent roles in anuran mate choice (Liao & Lu, 2009, 2010), we therefore predict that in species searching for mates (instead of calling), those regions should be larger to facilitate mate search efficiency. For volumes of the other regions, we avoid mak
-ing predictions and treat this part of the analysis as a prospect to iden
-tify the regions of the brain that are most affected by sexual selection.
2
|
MATERIALS AND METHODS
2.1
|
Field sampling
We collected a total of 200 adult male individuals from 43 anuran species during the breeding seasons 2007–2013 from the Hengduan Mountains of China. Individuals were transferred to the laboratory and then killed by double- pithing (Mi et al., 2012, Jin et al., 2016). We obtained volumetric measures of overall brain size and the five major different brain regions (viz. olfactory nerves, olfactory bulbs, telen
|
3Zengetal.
TABLE 1
Speci
es, number o
f samplings, average
vent length (SVL: mm), body mass (g), testes mass (mg), brain size (mm
3 ), and volume of d
ifferent brain parts (mm
3 ) Species N SVL Body mass Brain size
Olfactory nerves Bulbus olfactorium
Telencephalon
Optic tectum
Cerebellum
Testes mass
Mating system Exact source Courtship types
Nanorana venbtripunctata
3 35.5 ± 0.5 4.3 ± 0.9 14.03 ± 1.10 0.05 ± 0.01 0.19 ± 0.03 6.92 ± 1.35 2.77 ± 0.12 0.16 ± 0.39 18.2 ± 5.3 1 3 1 Nanorana parkeri 3 54.7 ± 1.0 17.5 ± 1.6 17.86 ± 2.37 0.16 ± 0.01 0.74 ± 0.11 7.23 ± 1.17 3.34 ± 0.37 0.23 ± 0.02 37.3 ± 5.6 1 2 1
Chaparana quadrana
3 71.1 ± 3.9 43.3 ± 6.6 33.60 ± 2.17 0.42 ± 0.03 0.43 ± 0.12 12.35 ± 0.67 7.49 ± 1.33 0.48 ± 0.07 1556.7 ± 444.4 2 3 1 Bombina maxima 9 58.1 ± 1.1 19.0 ± 1.2 23.59 ± 1.25 0.27 ± 0.03 1.05 ± 0.09 13.16 ± 0.78 2.59 ± 0.14 0.27 ± 0.06 197.1 ± 72.9 1 3 2 Branchytarsophry s chuannanensis 2 101.9 ± 7.6 100.8 ± 12.9 43.23 ± 0.54 1.37 ± 0.86 0.94 ± 0.07 19.62 ± 0.41 6.55 ± 0.50 0.74 ± 0.07 1280.0 1 3 2
Branchytarsophrys feae
1 95.6 93.5 23.11 1.26 1.73 7.28 3.46 0.47 748.7 1 3 2
Megophrys shapingensis
2 72.6 ± 2.1 29.9 ± 1.3 22.55 ± 0.62 0.61 ± 0.22 0.74 ± 0.28 9.51 ± 1.32 3.28 ± 0.77 0.40 ± 0.02 1291.4 ± 377.0 1 3 2 Scutiger muliensis 2 62.5 ± 0.4 29.5 ± 3.7 33.86 ± 5.91 1.13 ± 0.05 1.83 ± 0.02 14.45 ± 2.61 3.98 ± 0.84 0.33 ± 0.09 72.9 ± 0.5 1 1 2 Kaloula verrucosa 5 39.2 ± 0.9 6.5 ± 0.4 20.02 ± 1.22 0.38 ± 0.02 0.77 ± 0.10 9.23 ± 0.79 3.02 ± 0.40 0.35 ± 0.03 375.3 ± 24.3 1 3 2 Kaloula rugifera 2 38.9 ± 1.3 7.6 ± 0.7 8.18 ± 0.17 0.08 ± 0.01 0.71 ± 0.03 4.21 ± 0.22 1.10 ± 0.17 0.30 ± 0.01 14.8 ± 1.5 1 3 2
Rana chaochiaoensis
6 50.4 ± 2.6 9.5 ± 1.3 22.87 ± 1.53 0.25 ± 0.004 0.74 ± 0.13 6.53 ± 0.55 5.38 ± 0.59 0.31 ± 0.05 13.8 ± 4.1 1 3 1 Hyla tsinlingensis 3 32.1 ± 0.5 2.3 ± 0.2 7.99 ± 0.17 0.05 ± 0.01 0.41 ± 0.03 3.29 ± 0.27 1.39 ± 0.04 0.18 ± 0.04 8.6 ± 1.8 1 3 2
Hyla annectans chuanxiensis
3 33.0 ± 2.6 3.2 ± 0.4 9.02 ± 1.06 0.04 ± 0.01 0.34 ± 0.03 4.82 ± 0.68 0.96 ± 0.24 0.04 ± 0.003 16.4 ± 3.4 2 3 2
Hyla annectans jingdongensis
6 33.5 ± 0.9 2.2 ± 0.3 11.43 ± 0.58 0.01 ± 0.06 0.45 ± 0.04 5.93 ± 0.33 2.18 ± 0.20 0.36 ± 0.02 9.4 ± 3.5 2 3 2 Bufo melanosctictus 1 54.6 20.35 25.96 0.44 1.22 13.73 3.26 0.50 1 3 1
Rhacophorus omeimontis
7 59.8 ± 1.7 11.6 ± 0.8 44.69 ± 2.88 0.31 ± 0.04 0.99 ± 0.16 15.81 ± 0.75 9.79 ± 0.79 0.90 ± 0.16 356.1 ± 68.1 2 2 2
Polypedates megacephalus
6 43.6 ± 1.2 5.4 ± 0.4 30.99 ± 1.91 0.20 ± 0.07 0.44 ± 0.07 10.64 ± 0.81 9.72 ± 0.73 0.87 ± 0.25 62.5 ± 16.3 2 2 2
Rhacophorus chenfui
2 38.6 ± 0.7 5.8 ± 0.7
17.7 ± 72.96
0.09 ± 0.02
0.60 ± 0.23 7.92 ± 1.00 3.42 ± 0.43 0.26 ± 0.01 158.5 ± 25.5 2 3 2
Rhacophorus dugritei
Species
N
SVL
Body mass
Brain size
Olfactory nerves Bulbus olfactorium
Telencephalon
Optic tectum
Cerebellum
Testes mass
Mating system Exact source Courtship types
Fejervarya limnocharis
5 38.1 ± 1.3 5.1 ± 0.5 21.07 ± 1.23 0.12 ± 0.06 0.68 ± 0.11 7.66 ± 0.55 4.61 ± 0.23 0.26 ± 0.07 20.9 ± 2.9 1 2 2 Amolops lifanensis 3 52.8 ± 1.6 14.4 ± 0.9 28.84 ± 3.48 0.54 ± 0.18 0.45 ± 0.07 9.07 ± 1.15 5.29 ± 0.82 0.48 ± 0.08 44.8 ± 19.8 1 2 1
Amolops mantzorum
8 53.8 ± 1.2 14.2 ± 0.4 29.73 ± 2.30 0.33 ± 0.08 0.89 ± 0.18 10.47 ± 1.41 5.33 ± 0.77 0.39 ± 0.08 24.6 ± 2.6 1 2 1 Amolops loloensis 2 52.4 ± 0.8 18.6 ± 1.2 35.81 ± 1.96 0.27 ± 0.07 1.38 ± 0.18 14.27 ± 0.04 6.82 ± 0.26 0.64 ± 0.04 47.2 ± 3.0 1 1 1 Amolops granulosus 1 32.6 2.2 13.37 0.12 0.22 3.53 3.66 0.67 12.3 1 1 1 Rana omeimontis 9 48.0 ± 1.6 11.7 ± 1.4 39.42 ± 2.74 0.87 ± 0.11 1.28 ± 0.20 13.14 ± 1.42 10.99 ± 1.20 0.77 ± 0.09 1.6 ± 0.1 1 2 1 Rana kukunoris 6 45.6 ± 1.8 9.2 ± 1.0 21.11 ± 1.23 0.15 ± 0.02 1.10 ± 1.18 8.24 ± 0.63 3.51 ± 0.28 0.22 ± 0.02 20.7 ± 4.2 1 1 1 Rana japonica 3 52.7 ± 2.9 14.6 ± 3.8 21.04 ± 1.89 0.38 ± 0.11 0.71 ± 0.31 8.58 ± 1.71 3.45 ± 1.21 0.50 ± 0.10 29.9 ± 20.6 1 3 1
Odorrana margaretae
2 72.0 ± 0.6 33.2 ± 0.7 61.82 ± 1.01 0.63 ± 0.19 1.93 ± 0.46 19.96 ± 1.82 16.98 ± 1.24 0.67 ± 0.09 64.9 ± 8.2 1 2 2
Odorrana hejiangensis
3 46.6 ± 1.1 7.4 ± 0.5 20.74 ± 1.53 0.35 ± 0.01 0.65 ± 0.15 7.94 ± 0.85 4.47 ± 0.23 0.33 ± 0.04 16.3 ± 1.4 1 3 2 Odorrana grahami 7 67.6 ± 2.5 27.5 ± 3.4 55.83 ± 2.28 1.24 ± 0.14 1.66 ± 0.14 18.4 ± 01.31 11.68 ± 0.53 1.02 ± 0.12 65.0 ± 9.5 1 3 2 Bufo gargarizans 6 99.5 ± 3.6 88.0 ± 1.0 66.86 ± 3.55 1.29 ± 0.26 4.75 ± 0.41 30.6 ± 2.22 8.87 ± 0.58 0.92 ± 0.08 315.0 ± 22.3 1 2 1 Bufo minshanicus 4 67.5 ± 0.8 36.6 ± 1.6 30.36 ± 3.01 1.10 ± 0.33 1.57 ± 0.30 12.29 ± 1.62 4.85 ± 0.63 0.66 ± 0.03 161.7 ± 32.0 1 3 1 Bufo andrewsi 10 75.6 ± 1.3 24.4 ± 1.2 61.55 ± 2.12 0.89 ± 0.11 2.91 ± 0.22 31.41 ± 1.18 6.69 ± 0.38 1.13 ± 0.13 114.4 ± 14.3 1 2 1 Bufo tibetanus 2 58.6 ± 5.8 21.5 ± 8.4 25.87 ± 0.78 0.40 ± 0.02 0.84 ± 0.19 15.53 ± 0.21 2.65 ± 0.35 0.30 ± 0.04 37.0 1 3 1 Hylarana daunchina 3 43.7 ± 0.2 9.2 ± 0.2 19.66 ± 1.13 0.15 ± 0.04 0.48 ± 0.08 6.70 ± 0.31 4.74 ± 0.46 0.29 ± 0.05 13.0 ± 3.8 1 1 2
Pelophylax pleuraden
10 45.4 ± 0.8 8.4 ± 0.6 25.76 ± 3.18 0.15 ± 0.08 0.48 ± 0.09 10.12 ± 1.18 6.71 ± 1.08 0.40 ± 0.07 30.9 ± 3.2 1 2 2
Pelophylax nigromaculata
15 67.9 ± 2.2 28.3 ± 2.3 39.70 ± 2.50 0.19 ± 0.01 0.42 ± 0.04 17.71 ± 1.32 6.44 ± 0.57 0.92 ± 0.08 33.4 ± 3.1 1 2 2 Paa boulengeri 2 73.5 ± 6.3 52.7 ± 10 41.57 ± 0.45 3.44 ± 0.11 1.89 ± 0.14 12.93 ± 1.48 7.60 ± 0.42 0.89 ± 0.20 448.3 ± 1.3 1 3 2 Paa yunnanensis 2 60.6 ± 4.8 30.0 ± 4.1 41.07 ± 7.54 2.29 ± 1.05 1.90 ± 0.10 12.87 ± 2.45 7.05 ± 0.08 1.00 ± 0.18 660.9 ± 101.9 1 3 2 Mating system and courtship types experienced by different species. Mating system was classified on a point scale: 1 = polyandry, 2 = monandry; courtship types were classified on a point scale: 1 =
courtship calls, 2
=
searching m
ates. The exact source of each mating system description: 1
=
field observations, 2
=
reference of Liao et
al. (2013), 3
=
reference of Zeng et
al. (2014).
TABLE 1
|
5Zengetal.
Medulla volume was not determined because pithing damaged the structural integrity of the brain stem; whole brain mass is not affected by this method, however (Jiang et al., 2015). All specimens were pre
-served in 4% phosphate- buffered formalin for tissue fixation. After 2 weeks to 2 months of preservation, body size (snout- vent length: SVL) was measured to the nearest 0.01 mm with calipers. Brains and testes were dissected out and weighed to the nearest 0.1 mg with an electronic balance. The number of days samples spent in the buffered formalin did not affect relative brain weight (Liao et al., 2015) and tes
-tes mass (Zeng, Lou, Liao, & Jehle, 2014). We chose the species on the basis of diversity of courtship behavior and mating system, access to samples, as well as on the basis of available phylogenetic information.
2.2
|
Brain measurements
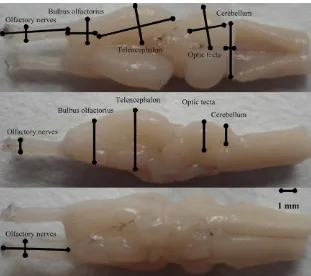
All dissections, digital imaging, and measurements were performed by two persons (LSL and LWB). All measurements were taken with the experimenter blind to the species identity because specimens were coded by uninformative ID- number. We used a Motic Images 3.1 digital camera mounted on a Moticam 2006 light microscope at a 400× magnification to take digital images of the dorsal, ventral, left, and right sides of the brain and brain regions. For dorsal and ventral views, we ensured that the view of the brain being photographed was horizontal and that the brain was symmetrically positioned such that one hemisphere did not appear larger than the other. For paired regions, we only measured the width of the right hemisphere and doubled the volume estimate. We used a tpsDig 1.37 software to measure length (L), width (W), and height (H) of the brain and the five brain regions from the digital photographs. Brain and brain regions were defined as the greatest distance enclosed by the given region,
and the used landmarks are shown in Fig. 1. Finally, we used an ellip
-soid model: volume = (L*W*H) π/(6*1.43) to obtain the volumetric estimates of different brains (see details in Liao et al., 2015). For 43 species, both intrameasurer and intermeasurer repeatabilities of the intermeasurer repeatability for all brain traits are very high (Liao et al., 2015). Average brain size and average size of brain regions were used in all analyses. Before all analyses, all variables were log10-
transformed to meet distributional assumptions. Because some of the measurements were smaller than one, all data were multiplied by 1000 prior to log transformation (Sokal & Rohlf, 1995). We found no evidence for heterogeneity in variability across the five brain regions (Liao et al., 2015). All data are deposited on Dryad (doi:10.5061/ dryad.j4754).
2.3
|
Data analyses
Following Zeng et al. (2014), mating system for each species was clas
-sified as: 1 = polyandry—two or more males simultaneously releas
-ing sperm or sequentially releas-ing sperm in a time frame that allows for the occurrence of sperm competition; 2 = monandry—a females mates with one male over the course of a breeding season by depos
-iting part of a single clutch. The courtship types were classified as: 1 = courtship calls—males have well- developed vocal sacs and attract mates through their vocalization; 2 = searching mates—males do not have well- developed vocal sacs and search for females or eggs. The classification of different species to different categories can be found in Table 1 based on the references (Liao, Zeng, & Yang, 2013; Zeng et al., 2014) and our own observation. We used dichotomous vari
-ables because for most species detailed descriptions of mating behav
-ior are unavailable.
F I G U R E 1 Dorsal, ventral, and lateral
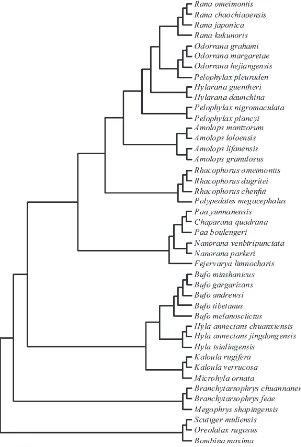
[image:6.595.238.549.455.731.2]For our comparative analysis, we used the phylogeny of Pyron and Wiens (2011) to reconstruct a phylogenetic tree for the 43 species (Fig. 2). The relationships between (log) brain size, size of five brain regions, and three indicators of sexual selection (i.e., mating system, type of courtship, and testes mass) were assessed in a series of phylo
-genetically controlled linear models. To account for the evolutionary relationships among species, we performed phylogenetically con
-trolled generalized least- squared (PGLS) regression analyses (Martins and Hansen 1997) using log- transformed data in the APE- package (R Development Core Team 2011) in R software package (V.2.13.1; Paradis, Claude, & Strimmer, 2004). The PGLS regression estimates a phylogenetic scaling parameter λ using maximum- likelihood method. The parameter λ estimates the effect of phylogenetic sig
-nal on the relationship between brain size and other factors ana
-lyzed (λ = 0 indicating no phylogenetic signal, and λ = 1 indicating strong phylogenetic signal). We found strong phylogenetic signals for all traits examined in our study (λ: brain siz = 0.426, olfactory
nerves = 0.377, olfactory bulbs = 0.358, telencephalon = 0.382, optic tectum = 0.640, and cerebellum = 0.315). As brains are sub
-ject to a wide range of selective pressures that act simultaneously, the relationships between both brain and brain regions and sexually selected traits were assessed using multiple regressions in phyloge
-netic ANOVAs with body size added as a covariate in all analyses to account for allometric effects.
3
|
RESULTS
Across all species of amphibians tested, brain size was positively correlated with body size when correcting phylogenetic effects (slope = 3.65, t = 5.85, p < .001; Fig. 3). When controlling for body size, none of the sexually selected traits (mating system, type of courtship, testes mass) were significantly related to the amount of variation in relative brain size, and the same was true also in the case of the size of
F I G U R E 2 The phylogenetic tree of the
[image:7.595.47.348.48.495.2]
|
7Zengetal.
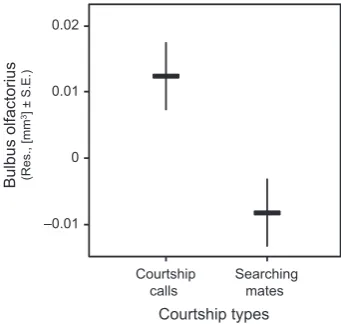
olfactory nerves, optic tecta, telencephalon, and cerebellum (Table 2). However, the size of the olfactory bulbs was significantly associated with mating system, being larger in monandrous than in polyandrous species (Table 2; Fig. 4). Olfactory bulbs size was further significantly associated with the type of courtship; calling species exhibiting larger olfactory bulbs than searching species (Table 2; Fig. 5).
4
|
DISCUSSION
Here, we find no evidence that three prominent aspects of sexual selection are related to the overall brain size of 43 species of amphib
-ians. However, both mating system and type of courtship influenced brain anatomy on a finer scale, albeit partly opposite to our predic
-tions. The olfactory bulbs were larger in monandrous species and species that use calls during courtship.
F I G U R E 3 Scaling of the total brain size as functions of body size
across 43 anuran species
Log (brain size
[m
m
3 )])
Log (body size [mm])
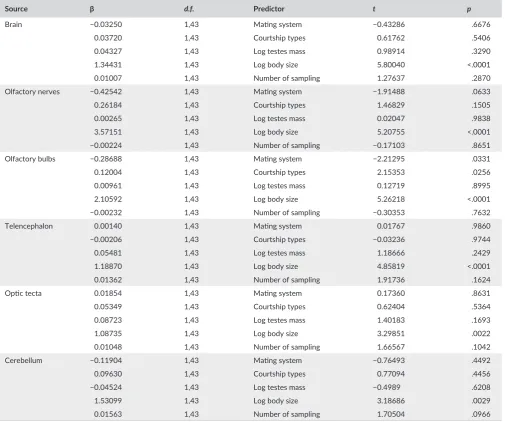
T A B L E 2 Regression models of (log) brain size and size of different brain structures in relation to various predictor variables for males across
43 anurans species when controlling for phylogeny (PGLS). Body size was added as a covariate and was significantly positively related to brain size and size of different brain structures in all models. The sample size, partial regression slopes (β) for the predictor variable, t- and p- values are presented for each model
Source β d.f. Predictor t p
Brain −0.03250 1,43 Mating system −0.43286 .6676
0.03720 1,43 Courtship types 0.61762 .5406
0.04327 1,43 Log testes mass 0.98914 .3290
1.34431 1,43 Log body size 5.80040 <.0001
0.01007 1,43 Number of sampling 1.27637 .2870
Olfactory nerves −0.42542 1,43 Mating system −1.91488 .0633
0.26184 1,43 Courtship types 1.46829 .1505
0.00265 1,43 Log testes mass 0.02047 .9838
3.57151 1,43 Log body size 5.20755 <.0001
−0.00224 1,43 Number of sampling −0.17103 .8651
Olfactory bulbs −0.28688 1,43 Mating system −2.21295 .0331
0.12004 1,43 Courtship types 2.15353 .0256
0.00961 1,43 Log testes mass 0.12719 .8995
2.10592 1,43 Log body size 5.26218 <.0001
−0.00232 1,43 Number of sampling −0.30353 .7632
Telencephalon 0.00140 1,43 Mating system 0.01767 .9860
−0.00206 1,43 Courtship types −0.03236 .9744
0.05481 1,43 Log testes mass 1.18666 .2429
1.18870 1,43 Log body size 4.85819 <.0001
0.01362 1,43 Number of sampling 1.91736 .1624
Optic tecta 0.01854 1,43 Mating system 0.17360 .8631
0.05349 1,43 Courtship types 0.62404 .5364
0.08723 1,43 Log testes mass 1.40183 .1693
1.08735 1,43 Log body size 3.29851 .0022
0.01048 1,43 Number of sampling 1.66567 .1042
Cerebellum −0.11904 1,43 Mating system −0.76493 .4492
0.09630 1,43 Courtship types 0.77094 .4456
−0.04524 1,43 Log testes mass −0.4989 .6208
1.53099 1,43 Log body size 3.18686 .0029
[image:8.595.54.280.46.221.2] [image:8.595.46.552.313.735.2]The social brain hypothesis (Dunbar, 1998; Dunbar & Shultz, 2007) could be applied to predict an association between brain size and anuran mating system. It states that higher social complexity selects for larger brains because they should enable individuals to bet
-ter cope with the cognitive challenges of intricate social situations. Hence, polyandrous anuran species with much shorter interaction time between individuals could be expected to show relatively smaller brains than monogamous species that usually spend extended periods of time together. This may be seen as an analogy to what has been reported in birds, where species with long- term bonds or more com
-plex social structures face higher cognitive demands and therefore show larger brain size (Shultz & Dunbar, 2010). In this study, however, we did not find a significant association between brain size and mating system. If this negative result holds true, we may speculate that differ
-ences in brood care could underlie this discrepancy between birds and amphibians. While monogamous birds generally also show extended periods of brood care, likely allowing the offspring to develop a larger
brain, the anurans in our study do not show brood care. Whether this is the case should be determined by investigating brain morphology in brood- caring anurans.
In contrast to the whole brain, the size of the olfactory bulbs was influenced by mating system. A larger olfactory center is commonly associated with higher olfactory acuity (Kotrschal, van Staaden, & Huber, 1998). The fact that we found larger bulbs in monandrous, com
-pared to polyandrous species, was unexpected but may be explained by a prominent role of olfaction in anuran mate choice (Chivers, Kiesecker, & Blaustein, 1998). The advantage of choosing better mates due to better olfactory acuity during male mate choice could drive the evolution of olfactory bulb size (Verrell, 1985). Alternatively olfactory bulb evolution in monandrous animals may be driven via selection on female olfactory ability during mate choice (Candolin, 2003); the larger olfactory bulbs we observe may be the consequence of the males’ and females’ brains inability to evolve independently from each other within species (Finlay et al., 2001; but see Kotrschal, Räsänen, Kristjánsson, Senn, & Kolm, 2012). Future studies in female brain size and anatomy are needed to determine whether the larger olfactory bulbs are also found in monandrous females.
The second effect of sexual selection on the olfactory bulbs was opposite to our predictions; we found smaller bulbs in species search
-ing for mates than in species us-ing courtship calls. Whether this is directly related to searching/producing courtship calls or driven by some unknown third factor is currently unclear and will be investi
-gated in upcoming studies.
Signals produced during courtship behavior often provide cues on male reproductive status and quality (Duellman & Trueb, 1986). More complex signals should be cognitively demanding to produce, and sexual selection may so lead to the coevolution of the size of the involved brain regions and for instance the level of complexity or the presence/absence of courtship calls. Indeed, in bird species with more complex song structure, the areas related to song production are larger (Devoogd, Krebs, Healy, & Purvis, 1993). Even the evolution of the unusually large human brain may have been driven by complex signals of courtship such as art, humor, or music (Miller, 2000). Although anu
-ran courtship calls are not directly comparable to those complex, often learned, vocalizations of bird and mammals, they are produced by motor pattern generators in the brain (stem) (Satou, Matsushima, Kusunoki, Oka, & Ueda, 1981), we had therefore expected that whether or not a species relied on courtship calls during mate acquisition would be reflected in its brain size. While brain stem data were not available, we did not find such a difference in whole brain mass. Upcoming experi
-ments will therefore specifically target brain stem volumes.
It is evident that analogous to ecological factors (Liao et al., 2015), the level of promiscuity can impose selection on specific brain regions in anurans. Interestingly, in contrast to those ecological factors, which impact several brain regions, sexual selection seems to only affect the olfactory bulbs. Both those results support the mosaic hypothesis of brain evolution and are therefore in line with a range of studies in other taxa finding evidence for this hypothesis (e.g., fish (Gonzalez- Voyer et al., 2009), birds (Iwaniuk, Dean, & Nelson, 2004), or mammals (Barton & Harvey, 2000)).
F I G U R E 4 Differences in mean relative bulbus olfactorius size
as a function of mating system across 43 anurans species using data corrected for phylogenetic effects. The plotted values refer to residuals from regression of bulbus olfactorius size on body size
–0.2 –0.1 0 0.1
Polyandry Monandry
Bulbus olfactorius (Res., [m
m
3] ± S.E.)
Mating system
F I G U R E 5 The mean relative bulbus olfactorius size in courtship
types in 43 anurans species when correcting phylogenetic effects. The plotted values refer to residuals from regression of bulbus olfactorius size on body size
–0.01 0 0.01 0.02
Courtship
calls Searchingmates
Bulbu
so
lfactorius
(Res., [m
m
3] ± S.E.)
[image:9.595.84.255.48.205.2] [image:9.595.82.253.278.440.2]
|
9Zengetal.
Finally, the expensive sexual tissue hypothesis predicts that intense sexual selection should constrain the evolution of larger brains due to energetic trade- offs with sexual traits. In species with high lev
-els of sperm competition, as in many amphibians, the size of the testes provides an adequate indicator of the level of the intensity of sexual selection (Hosken & Ward, 2001). The fact that we did not find a nega
-tive association between testes mass and brain size in our study, how
-ever, does not support this hypothesis. While this lack of association may not be surprising due to the relatively small testicular volume of anurans (Liao et al., 2015), taken together with the lack of association of brain size with mating system and type of courtship, it becomes evi
-dent that for the aspects we investigated, the expensive sexual tissue hypothesis is implausible for brain size evolution in the anurans here investigated. Potentially more fine- scaled proxies of sexual selection, such as sex ratio during courtship/egg laying or mating effort, may reveal such relationships in future studies.
In conclusion, while traits of sexual selection appear to be unre
-lated to brain size evolution, aspects of brain anatomy such as the olfactory bulbs are clearly shaped by both mating system and the nature of mate acquisition in male anurans.
ACKNOWLEDGMENTS
Financial support was provided by the National Natural Sciences Foundation of China (31471996), Sichuan Province Outstanding Youth Academic Technology Leaders Program (2013JQ0016), and Sichuan Province Department of Education Innovation Team Project (14TD0015, 15TD0019). AK was funded by the Austrian Science Fund (J 3304- B24 to AK). The sacrifice of animals was approved by the Animal Ethics Committee at China West Normal University. The reported experiments comply with the current laws of China concern
-ing animal experimentation, and permission to collect amphibians was received from the Ethical Committee for Animal Experiments in China Council on Animal Care (CCAC) guidelines.
FUNDING INFORMATION
National Natural Sciences Foundation of China, (Grant/Award Number: 31471996) Austrian Science Fund, (Grant/Award Number: J 3304-B24) Sichuan Province Outstanding Youth Academic Technology Leaders Program, (Grant/Award Number: 2013JQ0016) Sichuan Province Department of Education Innovation Team Project, (Grant/Award Number: 14TD0015, 15TD0019).
CONFLICT OF INTEREST
None declared.
REFERENCES
Aiello, L., & Wheeler, P. (1995). The expensive tissue hypothesis: The brain and the digestive system in human and primate evolution. Current
Anthropology, 36, 199–221.
Andersson, M. (1994). Sexual Selection. Princeton: Princeton University Press.
Arnqvist, G., & Rowe, L. (2005). Sexual Conflict. Princeton: Princeton University Press.
Balaban, E. (1997). Changes in multiple brain regions underlie species dif-ferences in a complex, congenital behavior. Proceedings of the National
Academy of Sciences of the United States of America, 94, 2001–2006.
Barton, R. A., & Harvey, P. H. (2000). Mosaic evolution of brain structure in mammals. Nature, 405, 1055–1058.
Boogert, N. J., Fawcett, T. W., & Lefebvre, L. (2011). Mate choice for cognitive traits: A review of the evidence in nonhuman vertebrates.
Behavioral Ecology, 22, 447–459.
Butler, A. B., & Hodos, W. (2005). Comparative Vertebrate Neuroanatomy, 2nd ed. Hoboken, New Jersey: John Wiley & Sons Inc.
Byrne, P. G., & Roberts, J. D. (2012). Evolutionary causes and consequences of sequential polyandry in anuran amphibians. Biological Reviews, 87, 209–228.
Byrne, P. G., Simmons, L. W., & Roberts, J. D. (2003). Sperm competition and the evolution of gamete morphology in frogs. Proceedings Biological
Sciences, 270, 2079–2086.
Candolin, U. (2003). The use of multiple cues in mate choice. Biological
Reviews, 78, 575–595.
Chivers, D. P., Kiesecker, J. M., & Blaustein, A. R. (1998). Mate choice by chemical cues in western redback (Plethodon vehiculum) and Dunn’s
(P. dunni) salamanders. Ethology, 104, 781–788.
Dechmann, D. K. N., & Safi, K. (2009). Comparative studies of brain evo-lution: A critical insight from the Chiroptera. Biological Reviews, 84, 161–172.
Devoogd, T. J., Krebs, J. R., Healy, S. D., & Purvis, A. (1993). Relations between song repertoire size and the volume of brain nuclei related to song – Comparative evolutionary analyses amongst oscine birds.
Proceedings Biological Sciences, 254, 75–82.
Duellman, W. E., & Trueb, L. (1986). Biology of Amphibians. New York: McGraw-Hill.
Dunbar, R. I. M. (1998). The social brain hypothesis. Evolutionary
Anthropology, 6, 178–190.
Dunbar, R. I. M., & Shultz, S. (2007). Evolution in the social brain. Science,
317, 1344–1347.
Finlay, B. L., Darlington, R. B., & Nicastro, N. (2001). Developmental struc-ture in brain evolution. Behavioral and Brain Sciences, 24, 263–278. Fitzpatrick, J. L., Almbro, M., Gonzalez-Voyer, A., Hamada, S., Pennington,
C., Scanlan, J., & Kolm, N.(2012). Sexual selection uncouples the evolu-tion of brain and body size in pinnipeds. Journal of Evolutionary Biology, 25, 1321–1330.
Garamszegi, L. Z., Eens, M., Erritzøe, J., & Møller, A. P. (2005). Sperm com-petition and sexually size dimorphic brains in birds. Proceedings of the
Royal Society B, 272, 159–166.
García-Peña, G. E. (2013). Sexual selection on brain size in shorebirds (Charadriiformes). Journal of Evolutionary Biology, 26, 878–888. Gonzalez-Voyer, A., & Kolm, N. (2010). Sex, ecology and the brain:
Evolutionary correlates of brain structure volumes in Tanganyikan cich-lids. PLoS ONE, 5, e14355.
Gonzalez-Voyer, A., Winberg, S., & Kolm, N. (2009). Brain structure evolu-tion in a basal vertebrate clade: Evidence from phylogenetic compara-tive analysis of cichlid fishes. BMC Evolutionary Biology, 9, 238. Hosken, D., & Ward, P. (2001). Experimental evidence for testis size
evolu-tion via sperm competievolu-tion. Ecology Letters, 4, 10–13.
Iwaniuk, A. N., Dean, K. M., & Nelson, J. E. (2004). A mosaic pattern charac-terizes the evolution of the avian brain. Proceedings of the Royal Society B, 271, S148–S151.
Jiang, A., Zhong, M. J., Xie, M., Lou, S. L., Jin, L., Jehle, R., et al. (2015). Seasonality and age is positively related to brain size in Andrew’s toad
(Bufo andrewsi). Evolutionary Biology, 42, 339–348.
reproductive traits in male Asian grass frogs (Fejervarya limnocharis).
Behavioral Ecology and Sociobiology, 70, 1197–1208.
Kotrschal, A., Corral-Lopez, A., Zajitschek, S., Immler, S., Maklakov, A. A., & Kolm, N. (2015). Positive genetic correlation between brain size and sexual traits in male guppies artificially selected for brain size. Journal
of Evolutionary Biology, 28, 841–850.
Kotrschal, A., Räsänen, K., Kristjánsson, B. K., Senn, M., & Kolm, N. (2012). Extreme sexual brain size dimorphism in sticklebacks: A con-sequence of the cognitive challenges of sex and parenting? PLoS ONE,
7, e30055.
Kotrschal, A., Rogell, B., Bundsen, A., Svensson, B., Zajitschek, S., & Brännström, I., et al. (2013). Artificial selection on relative brain size in the guppy reveals costs and benefits of evolving a larger brain. Current
Biology, 23, 168–171.
Kotrschal, A., & Taborsky, B. (2010). Environmental change enhances cog-nitive abilities in fish. PLoS Biology, 8, e1000351.
Kotrschal, K., van Staaden, M. J., & Huber, R. (1998). Fish brains: Evolution and environmental relationships. Review in Fish Biology and Fisheries, 8, 373–408.
Lemaitre, J. F., Ramm, S. A., Barton, R. A., & Stockley, P. (2009). Sperm com-petition and brain size evolution in mammals. Journal of Evolutionary
Biology, 22, 2215–2221.
Liao, W. B., Lou, S. L., Zeng, Y., & Merilä, J. (2015). Evolution of anuran brains: Disentangling ecological and phylogenetic sources of variation.
Journal of Evolutionary Biology, 28, 1986–1996.
Liao, W. B., & Lu, X. (2009). Sex recognition by male Andrew’s toad Bufo
andrewsi in a subtropical montane region. Behavioural Processes, 82,
100–103.
Liao, W. B., & Lu, X. (2010). Breeding behavior of the Omei tree frog
Rhacophorus omeimontis in a subtropical montane region. Journal of
Natural History, 44, 2929–2940.
Liao, W. B., Zeng, Y., & Yang, J. D. (2013). Sexual size dimorphism in anurans: Roles of mating system and habitat types. Frontiers in Zoology, 10, 65. Mi, Z. P., Liao, W. B., Jin, L., Cheng, S. L., Lou, J. & Wu, H. (2012). Testis
asymmetry and sperm length in Rhacophorus omeimontis. Zoological
Science, 29, 368–372.
Miller, G. (2000). The Mating Mind. London, UK: Vintage.
Paradis, E., Claude, J., & Strimmer, K. (2004). APE: Analyses of phylogenet-ics and evolution in R language. Bioinformatics, 20, 289–290.
Pitnick, S., Jones, K. E., & Wilkinson, G. S. (2006). Mating system and brain size in bats. Proceedings of the Royal Society B, 273, 719–724. Pollen, A. A., Dobberfuhl, A. P., Scace, J., Igulu, M. M., Renn, S. C. P., &
Hofmann, H. H. (2007). Environmental complexity and social organiza-tion sculpt the brain in lake Tanganyikan cichlid fish. Brain, Behavior and
Evolution, 70, 21–39.
Pyron, R. A., & Wiens, J. J. (2011). A large- scale phylogeny of Amphibia includ-ing over 2800 species, and a revised classification of extant frogs, salaman-ders, and caecilians. Molecular Phylogenetics and Evolution, 61, 543–583.
R Development Core Team. (2011). R: A Language and Environment for
Statistical Computing. R Foundation for Statistical Computing, Vienna, Austria. http://www.R-project.org.
Rice, W. R., & Holland, B. (1997). The enemies within: Intergenomic con-flict, interlocus contest evolution (ICE), and the intraspecific Red Queen. Behavioral Ecology and Sociobiology, 41, 1–10.
Satou, M., Matsushima, T., Kusunoki, M., Oka, Y., & Ueda, K. (1981). Calling evoking area in the brain stem of the Japanese toad. Doubutsu Gaku
Zasshi, 90, 502.
Schillaci, M. A. (2006). Sexual selection and the evolution of brain size in Primates. PLoS ONE, 1, e62.
Schillaci, M. A. (2008). Primate mating systems and the evolution of neo-cortex size. Journal of Mammalogy, 89, 58–63.
Shettleworth, S. J. (2010). Cognition, Evolution, and Behavior, 2nd ed. Oxford, UK: Oxford University Press.
Shultz, S., & Dunbar, R. I. M. (2010). Social bonds in birds are associated with brain size and contingent on the correlated evolution of life- history and increased parental investment. Biological Journal of the
Linnean Society, 100, 111–123.
Sokal, R. R., & Rohlf, F. J. (1995). Biometry, 3rd ed. New York: Freeman and Company.
Sol, D., Székely, T., Liker, A., & Lefebvre, L. (2007). Big- brained birds survive better in nature. Proceedings Biological Sciences, 274, 755–761. Striedter, G. F. (2005). Principles of Brain Evolution. Sunderland, MA: Sinauer
Associates Inc.
Taylor, G. M., Nol, E., & Boire, D. (1995). Brain regions and encephalization in anurans: Adaptation or stability. Brain, Behavior and Evolution, 45(2), 96–109.
Tsuboi, M., Husby, A., Kotrschal, A., Hayward, A., Buechel, S. D., & Kolm, N. (2015). Comparative support for the expensive tissue hypothesis: Big brains are correlated with smaller gut and greater parental investment in Lake Tanganyika cichlids. Evolution, 69, 190–200.
Verrell, P. A. (1985). Male mate choice for large, fecund females in the red- spotted newt, Notophthalmus viridescens: How is size assessed?
Herpetologica, 41, 382–386.
Yopak, E. K., Lisney, T. J., Darlington, R. B., Collin, S. P., Montgomery, J. C., & Finlay, B. L. (2010). A conserved pattern of brain scaling from sharks to primates. Proceedings of the National Academy of Sciences of the United
States of America, 107, 12946–12951.
Zeng, Y., Lou, S. L., Liao, W. B., & Jehle, R. (2014). Evolution of sperm morphology in anurans: Insights into the roles of mating system and spawning locations. BMC Evolutionary Biology, 14, 104.