© 2016, IRJET ISO 9001:2008 Certified Journal Page 1091
KNOWLEDGE OF DIGITAL LIBRARY AND E-RESOURCES IN ENGINEERING COLLEGE
OF RAJASTHAN
Meera Newmon[1], Dr. Vandana Sengar[2]
[1]Research Scholar, Pacific University Udaipur, [2] Librarian, B.N. College, Udaipur
---Abstract
It is observed that use of digital library and e-resources is still problem among the engineering faculty of the universities in the developing countries. This paper presents the findings of a survey to about the knowledge and use of digital digital library and e-resources by faculty members through CD-ROM databases, online databases, online journals OPAC etc available in the engineering college libraries. This study is done among engineering faculty members in CIT, Abu Road, India. For evaluating study questions and data collection, the questionnaire is distributed to a random sample of 160 faculty members. The result of this survey are presented and discussed in this paper.
Key words: Digital resources, Electronic resources, engineering college libraries
Introduction
In today’s era, information needs of learners and knowledge seekers are met through a plenty of sources. The
digital library and e-resources
available in a library play a prominent role in facilitating access to required information to the users in an easy and expeditious manner. Further, one need not go to the library to make use of print formats as the digital resource can be made use of by any user through online access via networks or authentication methods at any time by comfortably sitting at office. However, it is important that one should be familiar with the use of digital library ande-resources for their fast and effective usage.
Further, digital resources can also be used for efficient retrieval. Thus,digital library and
e-resources in a library play a importnat role in
academic libraries as they are mostly tuned for the promotion of academic excellence and research. In view of all this, digital resources like CD-ROM database, online databases, online journals, OPACs and Internet etc are slowly replacing the importance and usage of print media.
Objectives
The objectives of the present study are:
To assess the e resources and frequency in the use of the different types of digital resources made by the faculty members.
To find out the purpose and utilization of the digital library and e-resources by the faculty members.
To know the importance of information in digital resources.
To find out the problems encountered by the faculty members while accessing and using digital library and e-resources.
To suggest suitable suggestions and recommendations to improve the digital library and e-resources for the benefit of users.
Methodology
Keeping in view the objectives in mind, a questionnaire is prepared to collect data from the faculty members of the CIT, Abu Road, India
© 2016, IRJET ISO 9001:2008 Certified Journal Page 1092 Then the data was analyzed and interpreted for the
outcome and presented in the following paragraphs.
Data Analysis
Faculty member’s familiarity with digital sources
The distribution of students according to their familiarity to use digital resources is shown in Table 1.
Table 1 : Faculty members familiarity with digital resources (n=160)
Use No of
responses Percentage
Familiar 95 59.3
Not
familiar 65 40.62
Total 160 100.00
It is evident from Table 1 that 59.3 percent of the faculty members are familiar with digital resources, while 40.60 percent not.
Frequency of using the computers
The distribution of faculty members according to their frequency of using the computers is shown in Table 2.
Table 2: Distribution of faculty members according to their frequency of using the computers
Frequency No of
responses Percentage
Daily 42 26.25
2 or 3 times a
week 58 36.25
Once a week 24 15
Once in a month 25 15.6
Rarely 6 0.37
Never 5 0.31
Total 160 100.00
It is evident from Table 2 that 36.25 percent of the faculty members are using the computers two or three times a week, 26.25 percent daily, 15.6 percent once in a month, 15.0 percent once in a week, 0.37 percent rarely and the remaining 0.31 percent of the faculty members are never using the computers.
Frequency of using the digital resources
The distribution of faculty members according to their frequency of using the digital resources is shown in Table 3.
Table 3: Distribution of faculty members according to their frequency of using the digital resources in percentages (n=160) Digi tal Res our ces Frequency (%) Tot al Daily
2 or 3 times in a week
Once in a week
Once in a month
Rar
ely Never
[image:2.612.32.223.269.359.2] [image:2.612.378.580.321.679.2]© 2016, IRJET ISO 9001:2008 Certified Journal Page 1093 It is evident from Table 3 that 27.5 percent of the
faculty members are using the CD-ROM databases daily, 21.87 percent once in a week, 16.88 percent two or three times in a week, 14.38 percent once in a month, 11.25 percent rarely, and 8.12 percent never use the CD-ROM databases. Majority of the faculty members (34.38%) using the Internet daily, 21.25 percent once in a week, 20.63 percent two or three times in a week, 8.12 percent once in a month, 8.12 percent never use, and 7.5 percent rarely use the Internet. 39.39 percent of the faculty members are using e-mail daily, 30 percent two or three times in a week, 14.37 percent once in a week, 8.75 percent once in a month, 4.38 percent rarely, and 3.13 percent never use the e-mail facility.
It is also evident from table 3 majority of the faculty member (25.62%) are using the online databases once in a month, 21.25 percent never use, 15.63 percent once in a week, 14.38 percent two or three times in week, 13.75 percent rarely use, and 9.37 percent daily use the online databases. Majority of the faculty members (20.63%) are using the online journals once in a month, 18.75 percent never use, 17.5 percent once in a week, 17.5 percent rarely use, and 11.25 percent daily use the online journals. It is also evident from table 3 that 33.65 percent of the faculty members are using the search engines daily, 33.13 percent two or three times in a week, 20 percent once in a week, 4.37 percent once in a month, 3.75 percent never use, and 3.12 percent rarely use the search engines. Majority of the faculty members (24.38%) are using the online public accesses catalogue once in a week, 23.75 percent once in a month, 17.5 percent daily, 14.37 percent two or three times in a week, 11.25 percent rarely use, and 8.75 percent never use the OPAC. About 20.62 percent of the faculty members are using the college website once in a month, 20 percent daily, 17.5 percent two or three times in a week, 16.88 percent once in a week, 16.88 percent rarely uses, and 8.12 percent of the faculty members never use the college website.
Relative frequency use of digital resources
In order to know the relative frequency in the use of the different electronic resources by the faculty
members, weightages of 5,4,3,2,1 and 0 are assigned to responses of daily, two or three times a week, once in a week, once in a month, rarely and never used respectively. Total weightage is calculated for each electronic resource. Mean Weightage is calculated by dividing the total weightage by the number of faculty members included in the sample. Based on the Mean weightage the digital resources have been ranked. The distribution of users according to their relative use of different digital resources, total weightage, mean weightage and ranks are shown in Table 4.
Table 4: Distribution of faculty members according to their relative frequency of digital resources (n=160)
Digtal
Resources Total weightages Mean weightages Rank
CD-ROM 497 3.11 4
Internet 547 3.42 3
E-mail 611 3.82 2
Online
databases 346 2.16 8
Online
journals 360 2.25 7
Search
engines 612 3.83 1
AICTE
catalogue 443 2.77 6
AICTE
website 446 2.79 5
It is evident from table 4 that the faculty members are mainly using search engines compared to other digital resources and it has got first rank. It is followed by e-mail, internet, CD-ROM, college website, online public accesses catalogue, online journals, and online databases, which have got the second, third, fourth, fifth, sixth, seventh, and eighth ranks respectively for their use.
Purpose of using digital resources
[image:3.612.319.512.305.507.2]© 2016, IRJET ISO 9001:2008 Certified Journal Page 1094
Table 5 : Distribution of faculty members according to their purpose of using the digital resources (n=160)
Purpose No of
responses Percentage
For
communication 150 93.75
For research 90 56.25
To collect subject
information 125 78.12
Upgrade general
knowledge 92 57.5
For career
development 75 46.87
It is evident from Table 5 that 93.75 percent of the faculty members indicate that the digital resources are used for communication purpose, 78.12 percent to collect subject information, 57.5 percent upgrade general knowledge, 56.25 percent research purpose, and 46.87 percent of the faculty members are using digital resources for their career development.
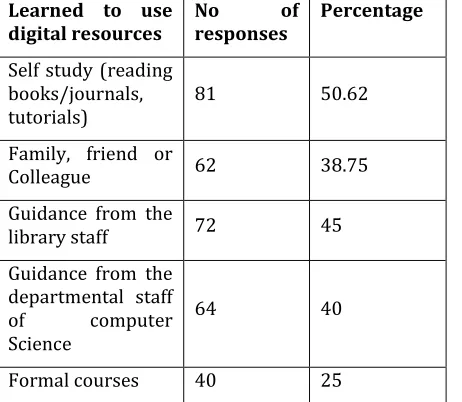
Learned to use digital resources
The distribution of faculty members learned to use digital resources is shown in Table 6.
Table 6: Distribution of faculty members according to the learned to use digital resources (n=160)
Learned to use
digital resources No responses of Percentage
Self study (reading books/journals,
tutorials) 81 50.62
Family, friend or
Colleague 62 38.75
Guidance from the
library staff 72 45 Guidance from the
departmental staff of computer Science
64 40
Formal courses 40 25
It is evident from Table 6 that 45 percent of the faculty members are learning the necessary skills to use digital resources through self study, 45.00 percent learned through the guidance from library staff, 38.75 percent through family, friend or colleague, 40.00 percent guidance from the departmental staff of computer science, and 25.00 percent of the faculty members are learning to use digital resources through formal courses.
Adequacy of information in digital resources
The distribution of faculty members according to the adequacy of information in digital resources is shown in Table 7.
Table 7: Distribution of faculty members according to the adequacy of information in digital resources (n=160)
Opinion No of
responses Percentage
Always 92 57.51
Some time 61 38.12
Never 07 0.43
Total 160 100.00
It is evident from Table 7 that 57.51 percent of the faculty members indicate the information available in the digital resources always adequate, 38.12 percent indicate some time, and 0.43 percent indicate the information available in the digital resources is never adequate.
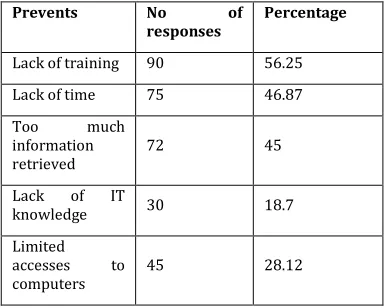
Prevents in accessing the digital resources
[image:4.612.32.263.476.677.2]© 2016, IRJET ISO 9001:2008 Certified Journal Page 1095
Table 8: Distribution of faculty members according to the prevents in accessing the digital resources (n=160)
Prevents No of
responses Percentage
Lack of training 90 56.25
Lack of time 75 46.87
Too much
information
retrieved 72 45
Lack of IT
knowledge 30 18.7
Limited accesses to
computers 45 28.12
It is evident from the Table 8 shows the opinion of the faculty members regarding prevents in accessing the digital resources. Majority (56.25%) of the faculty members stated that ‘lack of training’ is the main impediment to use digital resources, 46.87 percent ‘lack of time’, 45.00 percent ‘too much information retrieved’, 28.12 percent ‘limited to accesses to computers’, and 18.7 percent ‘lack of IT knowledge’ is the main prevent to use digital resources.
Conclusions
Most of the faculty members (59.3%) are familiar with the usage of digital resources. About 36.28 percent of the faculty members are using the computer two or three times a week, 36.25 percent daily, and 0.31 percent are never used. Most of the faculty members 25%, 33.13%, 38.13%, 36.87%, and 21.25% are using CD-ROM, Internet, E-mail, Search engines, and College website ‘daily’ respectively. However, 25 percent of the faculty members are using online databases, online public accesses catalogue ‘once in a month’, 18.75 percent of the faculty members are using online journals ‘rarely’. Most of the faculty members are mainly using search engines compared to other digital resources.
Online journals and online databases are less using compared to other resources being used rarely vis-à-vis other resources. Majority of the faculty members (93.75%) are using digital resources for enhancing
and upgrading their communication purposes. Majority of the faculty members (50.62%) opined that they were acquiring skills to use digital resources through ‘self-study’ method. Majority of the faculty members (57.51%) opined that the information available in the digital resources is always ‘adequate’. Majority (56.25%) and (46.87%) of the faculty members have expressed ‘lack of training’ and ‘lack of time’ are the main problems in securing access to digital resources.
References
[1] Kothari, C R. Research methodology: methods
and Techniques. New Delhi: New Age
International, 2009.P-1.
[2]. Madhusudan M, “use of UGC infonet e-
journals by research scholars of university of
Delhi,Delhi”, Library Hi Tech, Vol.26 No.3. pp.
369-386.
[3]. Narayana poornima and Goudar IRN, “ E-
Resources Management ( ICIM2005), 22-25
Feb2005, P 1-19.
[4]. Kaur Amritpal, use of E- resources by
teachers and researches of the Science and
Engineering & Technology Faculties in guru
Nanak Dev University: A Survey .in NACLIN
2006, p267-285.
[5]. RenWick Shamin,Knoweledge and use
electronic Resources by medical Science Faculty
at the university of the West indies. Libri, Vol.43,
No.3, 2004, p58-64.
[image:5.612.66.262.145.299.2]© 2016, IRJET ISO 9001:2008 Certified Journal Page 1096
[7]. Eqbal Monawwer & Khan Azhar Shah, use of
Electronic journals by research Scholars of
Faculty of Science and Faculty Of Engineering, In:
NACLIN2007, P309-319.
[8]. Chetan Sharma, Use and impact of E-
Resources at Guru Gobind Singh Indraprastha
university (india): A Case study.Vol.10 No.1,
2009.
[9]. Naqvi shehbaz Husain, Use of electronic
Resources at Jamia Millia (A Central university):
A case Study, In: NACLIN 2007, p320- 324.
[10]. Navijyoti, A snapshot of E- journals’
Adopters (Research Scholars) of Guru Nanak Dev
university, In: NACLIN 2007,p432-442.
[11]. Kennedy,P (2004), “Dynamic Web Pages
and the library Catalogue”, The Electronic
library, Vol.22 No. 6. Pp.480-6.
[12] Deb (Subrata), Kar (D), and Kumar (S). 2003. Electronic Library: A Case study with reference to TERI. India; Bangalore.
[13] Hewitson (Andrew). 2002. Use and awareness of electronic information services by academic staff at Leeds Metropolitan University-a qualitative study. Journal o Librarianship and Information Science. 34; 1; 43-52.
[14] Kumbar (Mallinath) and Lohar (M S). 2005. Students attitudes towards digital resources and services in B.I.E.T., Davanagere: A Survey. Paper presented at Third International CALIBER held at CUSAT, Cochin, on 2-4 Feb.
[15] Majid (S) and Abazova (A F). 1988. Computer literacy and use of electronic information sources by academics: a case study of International Islamic University, Malaysia. Asian Libra. 8; 4; 100-111.