Caloric restriction reverses hepatic insulin
resistance in aging rats by decreasing visceral
fat.
N Barzilai, … , W Chen, L Rossetti
J Clin Invest.
1998;
101(7)
:1353-1361.
https://doi.org/10.1172/JCI485
.
Hyperinsulinemia and increased visceral/abdominal fat (VF) are common features of human
aging. To examine the relationships among VF, peripheral, and hepatic insulin sensitivity,
we studied 4- and 18-mo-old male Sprague-Dawley rats (n = 42) fed ad libitum (4 AL and 18
AL) or moderately calorie restricted (18 CR) up to 18 mo of age. Total fat mass (FM) and VF
were decreased in 18 CR to approximately one-third of that of 18 AL (P < 0.001), while lean
body mass (LBM) was unchanged. Most important, 18 CR had more FM (65+/-6 vs. 45+/-6
g) but less VF (7.8+/-0.6 vs. 12.3+/-3.3 g) compared with 4 AL (P < 0.01 for both). Thus, the
effects of variable VF on HIS could be assessed, independent of FM and age. Marked
hepatic insulin resistance ensued with aging (18 AL) and CR restored hepatic insulin
sensitivity to the levels of young rats, while peripheral insulin sensitivity remained
unchanged (by insulin clamp of 18 mU/kg/min). In fact, the rates of insulin infusion required
to maintain basal hepatic glucose production in the presence of pancreatic clamp were
0.75+/-0.10, 1.41+/-0.13, and 0.51+/-0.12 mU/kg . min, in 4 AL, 18 AL, and 18 CR,
respectively (P < 0.01 between all groups), and in 18 CR rats infused with insulin at similar
rates as in the 18 AL (1.4 mU/kg/min) […]
Research Article
Find the latest version:
http://jci.me/485/pdf
J. Clin. Invest.
© The American Society for Clinical Investigation, Inc. 0021-9738/98/04/1353/09 $2.00
Volume 101, Number 7, April 1998, 1353–1361 http://www.jci.org
Caloric Restriction Reverses Hepatic Insulin Resistance in Aging Rats by
Decreasing Visceral Fat
Nir Barzilai, Swati Banerjee,* Meredith Hawkins, Wei Chen, and Luciano Rossetti
Department of Medicine, Division of Geriatrics, Division of Endocrinology, and *Division of Pediatric Endocrinology, and the Diabetes Research and Training Center, Albert Einstein College of Medicine, New York 10461
Abstract
Hyperinsulinemia and increased visceral/abdominal fat (VF) are common features of human aging. To examine the rela-tionships among VF, peripheral, and hepatic insulin sensi-tivity, we studied 4- and 18-mo-old male Sprague-Dawley
rats (n 5 42) fed ad libitum (4 AL and 18 AL) or moderately
calorie restricted (18 CR) up to 18 mo of age. Total fat mass (FM) and VF were decreased in 18 CR to approximately
one-third of that of 18 AL (P , 0.001), while lean body mass
(LBM) was unchanged. Most important, 18 CR had more
FM (6566 vs. 4566 g) but less VF (7.860.6 vs. 12.363.3 g)
compared with 4 AL (P , 0.01 for both). Thus, the effects of
variable VF on HIS could be assessed, independent of FM and age.
Marked hepatic insulin resistance ensued with aging (18 AL) and CR restored hepatic insulin sensitivity to the levels of young rats, while peripheral insulin sensitivity remained unchanged (by insulin clamp of 18 mU/kg/min). In fact, the rates of insulin infusion required to maintain basal hepatic glucose production in the presence of pancreatic clamp
were 0.7560.10, 1.4160.13, and 0.5160.12 mU/kg ? min, in
4 AL, 18 AL, and 18 CR, respectively (P , 0.01 between all
groups), and in 18 CR rats infused with insulin at similar rates as in the 18 AL (1.4 mU/kg/min) hepatic glucose
pro-duction was decreased by 32% (P , 0.005). Furthermore,
when 18 CR rats were fed AL for 14 d, VF rapidly and selec-tively increased and severe hepatic insulin resistance was induced. We propose that in this animal model the age-associated decrease in hepatic (rather than peripheral) insu-lin action is the major determinant of fasting hyperinsuinsu-line- hyperinsuline-mia and that increased visceral adiposity plays the major role in inducing hepatic insulin resistance. Thus, interven-tions designed to prevent the accumulation of VF are likely to represent an effective mean to improve carbohydrate
me-tabolism in aging. (J. Clin. Invest. 1998. 101:1353–1361.) Key
words: visceral fat • hepatic insulin resistance • aging •
he-patic glucose flux • caloric restriction
Introduction
Aging in both humans and rodents is associated with increased fasting and postprandial plasma insulin levels, suggesting an insulin-resistant state (1–3). However, though increased body weight (BW)1 and fat mass (FM) are commonly associated
with insulin resistance in aging (4–7), the relationship between aging and insulin resistance is confounded by associated fac-tors such as decreased physical activity, dyslipidemia, hyper-tension, non–insulin-dependent diabetes mellitus, and coro-nary heart disease (4). Furthermore, visceral/abdominal fat (VF) increases in older men and women, independent of body mass index (8–10). Most important, increased VF has been as-sociated with a decrease in insulin sensitivity as measured by hyperinsulinemic clamp (11) and leg balance studies (12), and VF accounted for the majority of the variability in insulin sen-sitivity in other heterogeneous populations of women (13) and men (14). Thus, the effects of VF on insulin action may be in-dependent of body mass index and are a typical feature of aging.
Although the anatomical location of VF would support its role in regulating hepatic insulin action and carbohydrate me-tabolism, surprisingly there are virtually no studies designed to address this important issue. It has been hypothesized that “portal” effects of FFA and glycerol released by the increased mesenteric fat tissue may cause hepatic insulin resistance (15, 16), supporting a major role for increased VF in regulating he-patic glucose metabolism. In humans, rates of basal hehe-patic glucose production (HGP) were reported to be normal with aging (17–19); however, suppression of HGP by an oral glu-cose load (20) or by insulin (20, 21) was significantly impaired with aging, and in younger subjects with increased abdominal obesity (22). In addition, simply measuring the rate of HGP in human aging fails to take into account the fact that peripheral and portal insulin levels are markedly increased. Thus, the in-crease in VF may be responsible for the resistance of the aging liver to the suppressive effect of insulin.
Recently we have delineated the changes in body composi-tion and glucose metabolism in animal models of aging (23, 24). Animal models have the advantage of allowing one to in-vestigate potential mechanisms by which aging and caloric re-striction (CR) affect carbohydrate homeostasis in the absence of other confounding genetic and/or metabolic conditions which are associated with the syndrome of insulin resistance (4). In this rodent model, peripheral insulin responsiveness is
Address correspondence to Nir Barzilai, M.D., Divisions of Geriat-rics and Endocrinology, Dept. of Medicine, Belfer Bld. #701, Albert Einstein College of Medicine, 1300 Morris Park Avenue, Bronx, NY 10461. Phone: 718-430-3312; FAX: 718-430-8557; E-mail: barzilai@ aecom.yu.edu
Received for publication 24 April 1997 and accepted in revised form 20 January 1998.
not decreased with fat accretion after late adulthood (24), sup-porting the notion that a decline in hepatic insulin sensitivity (HIS) accounts for the age-dependent increase in plasma lin concentrations. Indeed, we reported that the ability of insu-lin to inhibit HGP was markedly impaired with aging in this rodent model (24). Additionally, since HIS was inversely re-lated to the increases in FM, VF, and FFA levels (24), we sug-gested that age-related changes in body composition, and their biochemical consequences, may directly lead to the impair-ment of hepatic glucose metabolism.
To provide further evidence in support of a cause–effect re-lationship between VF and hepatic insulin resistance in this an-imal model of aging, we examined whether the age-dependent decrease in HIS could be reversed by the decrease in VF in-duced by chronic caloric restriction.
Methods
Experimental rats
Male Sprague-Dawley rats (Charles River Laboratories, Wilmington, MA) were used in all studies (n 5 42). At z 15 wk of age, rats were assigned to be fed ad libitum (AL, n 5 25) or to CR (n 5 17) with 55% of the calories consumed by AL. This level of CR results in lean healthier rats with increased longevity when compared with their AL obese littermates. The chow contained 64% carbohydrates, 30% pro-teins, and 6% fats with a physiological fuel value of 3.30 kcal/g chow, and vitamin supplementation was added to the CR rats. Rats were housed in individual cages and subjected to a standard light (6 a.m. to 6 p.m.)/dark (6 p.m. to 6 a.m.) cycle. Rats were studied at 4 mo of age (4 AL, n 5 13) and after they were at least 18 mo of age (18 AL: n 5
12, average age was 1961 mo, and 18 CR: n 5 17, average age was 2161 mo). 1 wk before the in vivo study, rats were anesthetized with an intraperitoneal injection of pentobarbital (50 mg/kg BW) and in-dwelling catheters were inserted in the right internal jugular vein and in the left carotid artery. The venous catheter was extended to the level of the right atrium and the arterial catheter was advanced to the level of the aortic arch (23–26). Recovery was continued until BW was within 3% of their preoperative weight. A subgroup of 18 CR rats (n 5 6) was studied after 2 wk of ad libitum feeding, and when BW was increased by at least 5%. Studies were performed in 6-h fasted, awake, unstressed, chronically catheterized rats (23–26).
Body composition
Lean body mass (LBM) and FM were calculated from the whole body volume of distribution of water, estimated by tritiated water bo-lus injection in each experimental rat (23, 24, 27). Briefly, bobo-luses of 20 mCi of 3H
2O (New England Nuclear, Boston, MA) were injected intraarterially on the morning of the study. Steady state for 3H
2O spe-cific activity in rats is generally achieved within 30–45 min. Five sam-ples were collected between 1 and 3 h after injection. The distribution space of water was obtained by dividing the total radioactivity in-jected by the steady-state specific activity of plasma water which was assumed to be 93% of the total plasma volume. LBM was calculated from the whole body water distribution space divided by 0.73, and FM was calculated as BW 2 LBM. In addition, protein concentra-tions per gram of rectus muscle and gram of liver were measured in all rats studied, and no age-related changes were demonstrated. Epi-didymal, mesenteric, and perinephric fat were dissected and weighed at the end of each experiment. In addition, a subgroup of rats were anaesthetized with an intraperitoneal injection of pentobarbital and were placed supine in an MRI machine and studied at 1.5 T. Images were obtained with 0.15 mm between cuts throughout the body using T1-weighted sequence with and without fat-selective saturation pulses. Selected area of all pixels containing fat (“pure” white) were calculated by outlining with a graph pen and computing the area. The range of the fat area in the plans examined in the 4 AL, 18 CR, and 18
AL (n 5 3 from each group) rats is expressed in arbitrary three-digit numbers.
Hyperinsulinemic euglycemic clamp
We have shown previously that this rodent model demonstrates a de-crease in insulin responsiveness up to 4 mo of age, after which time insulin responsiveness does not decrease, even with further fat accre-tion (24). Thus, we predicted that as long as FM was increased in 18 CR over 4 AL, insulin responsiveness would not change in this model. We studied 4 AL (n 5 6), 18 AL (n 5 5), and 18 CR (n 5 5) rats by using the euglycemic clamp technique (23, 24). Briefly, a primed-continuous infusion of insulin (18 mU/kg ? min) was adminis-tered, and a variable infusion of a 25% glucose solution was started at time 0 and periodically adjusted to clamp the plasma glucose concen-tration at basal.
All studied rats received a primed-continuous infusion of HPLC-purified [3H-3]-glucose (New England Nuclear) (15–40 mCi bolus, 0.4
mCi/min). Plasma samples for determination of 3H-glucose specific activity were obtained at 10-min intervals throughout the saline and the insulin infusions. Plasma samples for determination of plasma in-sulin, lactate, and FFA concentrations were obtained at 30-min inter-vals before and during the study. The total volume of blood with-drawn was z 4.0 ml/study; to prevent volume depletion and anemia, a solution (1:1 vol/vol) of z 4.0 ml of fresh blood (obtained by heart puncture from a littermate of the test animal) and heparinized saline (10 U/ml) was infused. At the end of the insulin infusion, rats were anesthetized (pentobarbital 60 mg/kg BW, intravenously), the abdo-men was quickly opened, and rectus abdominal muscle and liver were freeze-clamped in situ with aluminum tongs precooled in liquid nitro-gen. The time from the injection of the anesthetic until freeze-clamp-ing of the liver was , 45 s. All tissue samples were stored at 2808C for subsequent analysis.
Hepatic-pancreatic clamp studies
To demonstrate hepatic insulin resistance, endogenous insulin was suppressed while porcine insulin was replaced peripherally (24). Af-ter the basal turnover period, [3H-3]-glucose infusion was continued with somatostatin (0.8 mg/kg/min) in order to suppress endogenous insulin secretion. Insulin was then infused at variable rates in the first hour in order to determine the rate required to clamp the plasma glu-cose levels at fasting levels, and maintained at that rate for an addi-tional hour, at which HGP was determined. Plasma sampling, anes-thetization of the rats at the end of the infusion period, obtaining muscle and liver freeze-clamped samples were performed as de-scribed above.
These study protocols were reviewed and approved by the Ani-mal Care and Use Committee of the Albert Einstein College of Med-icine.
Glucose-6-phosphatase (Glc-6-Pase) kinetics
Hepatic glycogen synthase and phosphorylase activities
Hepatic glycogen synthase activity was measured based on the incor-poration of radioactivity into glycogen from UDP-[U-14C]-glucose as described previously (24, 26). To approximate the in vivo conditions, synthase activity was measured in the presence of physiologic 0.11 mmol/liter Glc-6-P. Fractional velocity represent the mean of the ac-tivity ratios in the presence of three physiological UDP-glucose (UDPGlu) concentrations (0.125, 0.25, and 0.5 mM). Hepatic glyco-gen phosphorylase activity was measured based on the measurement of the incorporation of 14C into glycogen from labeled glucose-l-phos-phate as described previously (24, 26). Glycogen phosphorylase a, the active phosphorylated enzyme, was assayed in the absence of AMP.
Analytical procedures
Plasma glucose was measured by the glucose oxidase method (Glu-cose Analyzer II; Beckman Instruments, Inc., Palo Alto, CA) and plasma insulin by radioimmunoassay using rat and porcine insulin standards. Plasma 3H-glucose radioactivity was measured in duplicate on the supernatants of Ba(OH)2 and ZnSO4 precipitates of plasma samples after evaporation to dryness to eliminate tritiated water. He-patic Glc-6-P concentrations were measured spectrophotometrically as described previously (23, 26, 27). Plasma nonesterified fatty acid concentrations were determined by an enzymatic method with an au-tomated kit according to the manufacturer’s specifications (Waco Pure Chemical Industries, Osaka, Japan). Plasma glycerol was mea-sured with an automated kit according to specifications (Sigma Diag-nostics, St. Louis, MO).
Terminology. The term total glucose output (TGO) is intended as total in vivo flux through Glc-6-Pase. The term HGP is intended as the net rates of Glc-6-P dephosphorylation to glucose (balance of the in vivo fluxes through glucokinase and Glc-6-Pase). Finally, glucose cycling (GC) is defined as the input of extracellular glucose into the Glc-6-P pool followed by exit of plasma-derived Glc-6-P back into the extracellular pool.
Calculations. After [3H-3]-glucose infusion, the ratio of specific activities of 3H-hepatic UDPGlc and plasma glucose represents the percentage of the hepatic Glc-6-P pool which was derived from plasma glucose. The UDPGlc concentrations and specific activity (SA) were assessed by reverse-phase HPLC as described previously (26, 29). Thus, this ratio also measured the percent contribution of plasma glucose to Glc-6-Pase flux (i.e., GC). Since TGO is equal to the sum of HGP plus GC (GC5 3H-UDPGlc SA/plasma 3H-glucose
SA3TGO), the equation can be resolved to calculate both GC and TGO: TGO5 HGP/(1 23H-UDPGlc SA/plasma 3H-glucose SA)
and GC5 3H-UDPGlc SA/plasma 3H-glucose SA3TGO.
While HGP is similar in all groups, the liver is exposed to differ-ent insulin levels during the hepatic-pancreatic clamps. To take these insulin levels into account, we previously defined an index for HIS at the basal state, as the rate of basal HGP divided by the mean plasma levels of insulin during the study (24). For the analysis of the relation-ship between HIS and FM, correlations were analyzed by simple lin-ear regression. In addition, nonlinlin-ear regression was performed to fit an exponential decay model of glucose uptake versus parameters of body composition. Also, a piece-wise regression model with an un-known knot point was used. This spline curve model consists of two regression lines joined at an unknown intersection (knot). This un-known knot can be statistically derived by NLIN program in SAS windows, version 6.10. This model is expressed as: y 5 å1b1 ?x1
b2 ? (x2k) ?Ik; where y is HIS, x represents VF, k is the unknown knot to be estimated from the nonlinear regression procedure, and Ik
is the indicator variable (which is equal to 1 if x is greater than the knot, and otherwise is 0). The model becomes y 5 å1b1 ?x, if x is less than the estimate knot k, and y 5 (å2k) 1 (b1 1 b2) ? x, if x is greater than or equal to estimated knot k. The P values of the two slopes can be derived and will provide the information of how the outcome variable will change after the x variable reached the esti-mated knot. Comparisons between groups were made using repeated
measures ANOVA where appropriate. Other values are presented as the mean6SEM.
Results
Weight gain in CR and AL rats
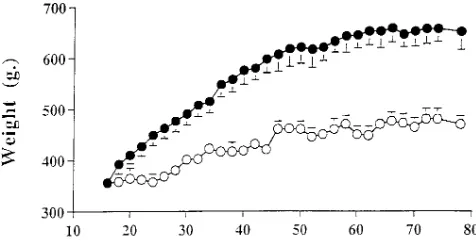
BW increased significantly until 56 wk of age in AL and until 46 wk of age in CR rats. Thereafter, BW remained stable in both groups and at 18 mo of age the difference between AL and CR averaged 177612 g of BW (Fig. 1). Rats in the AL group consumed initially 7966 kcal/d and their food intake re-mained quite stable throughout the study period. Food intake was decreased in the CR group at z 55% (43 kcal/d) of that of AL rats. At the completion of the study, 18 AL rats gained
z 310 g in 14 mo and weighted twice as much as 4 AL. By con-trast, 18 CR gained only z 140 g during the same period of time.
Effect of age and CR on peripheral insulin sensitivity
Body composition and basal biochemical characteristics of se-lected rats. FM was dramatically increased in 18 AL but was
[image:4.612.315.553.59.181.2]similar in 4 AL and CR, while VF was significantly lower in 18 CR than it was in 18 AL and 4 AL. Plasma basal glucose levels were similar between groups (7.360.6, 7.261.6, and 7.361.6 mM in 4 AL, 18 AL, and 18 CR, respectively), while basal plasma insulin levels were lowest in 18 CR (286616, 510677, Figure 1. CR effects on BW. BW of Sprague-Dawley rats which were
ad libitum fed (filled circles) or calorie restricted (open circles) to 55% of the consumed kcal/d of the AL group beginning at 14–16 wk of age.
Table I. Peripheral Insulin Responsiveness
4 AL 18 AL 18 CR
n 56 n 55 n 5 5
BW (g) 347615 633663* 468644‡ FM (g) 5166 167615* 5963 VF (g) 13.362.3 43.4612.0* 8.361.6‡
Glucose (mM) 7.261.2 7.161.4 7.261.2 Insulin (pM) 45006180 45606300 51126342 Rd (mg/kg LBM/min) 37.562.6 35.665.3 39.462.7
[image:4.612.316.555.565.684.2]and 179634, in 4 AL, 18 AL, and 18 CR, respectively, P , 0.01 between all groups) (Table I).
Hyperinsulinemic euglycemic clamp studies. During the
in-sulin clamp studies, steady-state plasma glucose and inin-sulin concentrations were similar in all groups. Plasma FFA levels during hyperinsulinemia were suppressed by z 70%, and plasma lactate levels were similarly increased in all groups. When the Rd was expressed per LBM it was similar among all groups. HGP was equally suppressed to z 2 mg/kg/min in all groups. Thus, in this model, peripheral insulin responsiveness does not change with aging or with CR which maintains cer-tain FM, supporting the possibility that the insulin insensitivity which is suggested by basal hyperinsulinemia in this model may reside at the level of the liver (Table I).
Effect of age and CR on HIS
Body composition and basal biochemical characteristics of se-lected rats. While BW was increased in 18 AL compared with
the other groups, CR only minimally affected LBM, and the decreased accumulation of fat accounted for z 75% of the di-minished weight gain in this group (Table II). Furthermore, while the percent contribution of FM to BW doubled between 4 and 18 mo of age in the AL group, CR completely prevented this increase. Thus, CR blunted the age-associated increase in whole body FM.
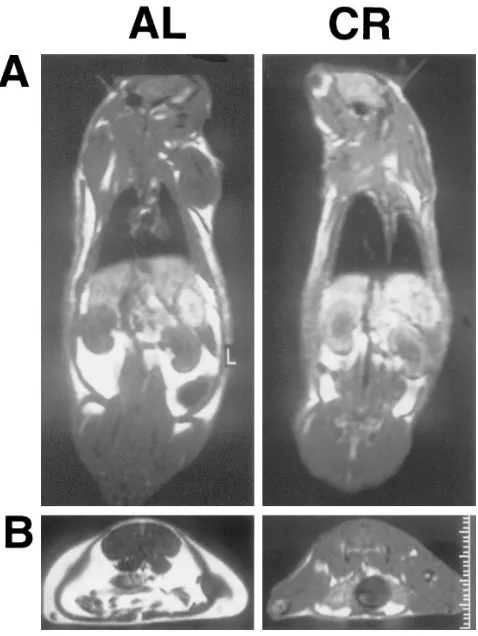
Additionally, it is apparent that CR also affected the distri-bution of body fat. In fact, while whole body FM remained sig-nificantly higher in 18 CR than in 4 AL, VF was decreased in 18 CR below the level measured in 4 AL (Table II). This marked reduction in VF can be visually appreciated in the MRI of a typical 18 AL and 18 CR rat depicted in Fig. 2. Quantitative analysis of all MRIs revealed that the subcutane-ous fat (averaged around the scapular and abdominal areas) of 4 AL rats ranged from 120 to 212 (arbitrary units) and it was still increased by z 40% (to a range of 235–278) in 18 CR. Conversely, areas of matching cuts in the planes of epididymal and perinephric fat depots ranged from 472 to 493 in 4 AL and decreased by z 30% in 18 CR (to 312–349).
Table II displays the basal biochemical parameters in the three experimental groups. Postabsorptive (6 of fasting) plasma
glucose and lactate concentrations were similar in all groups. However, plasma insulin, FFA, and glycerol levels nearly dou-bled in 18 AL as compared with 4 AL. In 18 CR, plasma insu-lin levels decreased to levels which were significantly below those of 4 AL (z 60%), while plasma FFA and glycerol levels were nearly normalized (Table II).
HIS. On the day of the study, the fasting plasma glucose
[image:5.612.317.556.335.653.2]concentrations and the basal HGP (6264, 6465, and 6264 mmol/kg/min) were similar in 4 AL, 18 AL, and 18 CR, respec-tively. The rate of insulin infusion needed to clamp the plasma glucose at basal levels was 0.7560.10 mU/kg/min in 4 AL, 1.4160.13 mU/kg/min in 18 AL, and 0.5160.12 mU/kg/min in 18 CR (Fig. 3; P , 0.01 between all groups). Plasma glucose concentrations were maintained at fasting levels (7.560.2, 7.460.4, and 7.260.3 mM) throughout the study. HGP was slightly decreased from basal and was 5864, 5666, and 5464 mmol/kg/min in 4 AL, 18 AL, and 18 CR, respectively. Plasma FFA levels during insulin infusion were 0.7660.04, 1.6460.02, and 1.0960.06 mM in 4 AL, 18 AL, and 18 CR, respectively. Glucagon levels were similar in all groups during the hepatic-pancreatic clamp 238634, 227631, and 190624 pg/ml in 4 AL, 18 AL, and 18 CR, respectively. The above rates of insulin in-fusion resulted in a twofold higher plasma insulin levels in 18
Table II. Characteristics of 4AL, 18 AL, and 18 CR Rats
4 AL 18 AL 18 CR
n 57 n 57 n 5 6
BW (g) 330622 643631* 471620*‡ LBM (g) 285615 453624* 412623* FM (g) 4566 190612* 6566*‡ FM (%) 1363 2663* 1364‡ VF (g) 12.363.3 35.966.7* 7.860.6*‡
Glucose (mM) 7.460.8 7.661.4 7.361.0 Insulin (pM) 266612 491688* 149634‡ FFA (mM) 1.0260.09 1.7860.23* 1.2160.12‡ Glycerol (RM) 110612 228632* 152631‡ Lactate (mM) 0.5760.06 0.5560.02 0.5460.04
Body composition: BW, LBM, FM, epididymal fat pad, and total VF. Biochemical characteristics: fasting plasma glucose, insulin, FFA, glyc-erol, and lactate. *P , 0.01 vs. 4 AL, ‡P , 0.01 vs. 18 AL; data are pre-sented as mean6SEM.
Figure 2. Body composition by MRI. The bright white color depicts
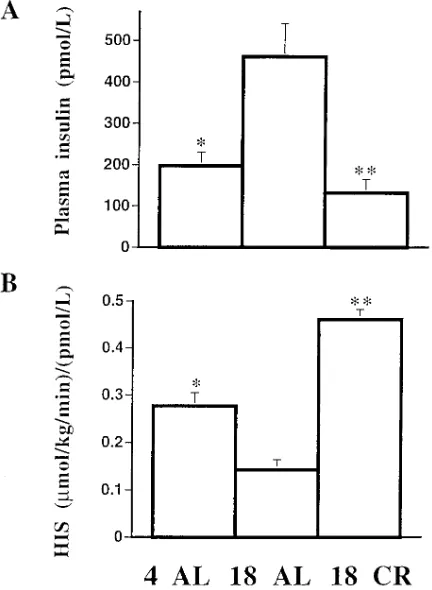
[image:5.612.56.296.531.692.2]AL, but significantly lower levels in 18 CR (197633, 461680, and 132618 pmol/liter in 4 AL, 18 AL, and 18 CR, respec-tively; P , 0.001 among all groups) (Fig. 4 A). Portal plasma insulin levels obtained at the end of the study did not demon-strate a significant gradient with the systemic plasma insulin levels (207643, 486691, and 128628 pmol/liter in 4 AL, 18 AL, and 18 CR, respectively; P , 0.001 among all groups). An index of HIS was derived by dividing the rate of HGP by the steady-state plasma insulin concentrations. HIS was decreased by z 50% in 18 AL compared with 4 AL but it was increased
twofold in 18 CR [0.27760.028, 0.14360.006, and 0.46160.021 (mmol/kg/min)/(pmol/liter) in 4 AL, 18 AL, and 18 CR, respec-tively; P , 0.001 among all groups] (Fig. 4 B).
To confirm the beneficial effect of CR on HIS, an addi-tional group of 18 CR was infused with insulin at the rate (1.4 mU/kg/min) required to clamp the plasma glucose levels in the 18 AL (n 5 4). Plasma glucose concentrations were main-tained at basal level by glucose infusion and HGP was as-sessed. HGP was 7068 during the basal period and it was sup-pressed by 32% to 4861 mmol/kg/min (P , 0.005) during the insulin infusion.
Relationship between hepatic insulin action and VF. Changes
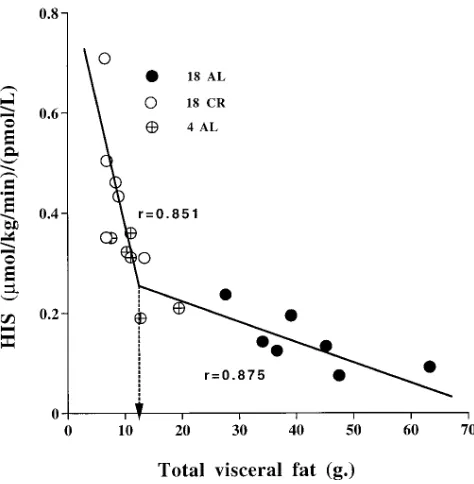
in VF were tightly associated with alterations in the rate of in-sulin infusion (IIR) needed to maintain HGP (Fig. 5). Because the individual points between VF and HIS do not seem to have simple correlation, we searched for the best fit model for this relationship. This was obtained by spline curve analysis con-sisting of the two regression lines joined in a knot at VF weigh-ing 12.6 g (P , 0.0006; R2 5 0.957;Fig. 6). When VF was , 12.6 g,
[image:6.612.57.279.192.635.2]the slope was: HIS 5 0.30–0.004 3 total VF, (r 5 20.851, P , 0.001), and when total VF was . 12.6 g the steep slope was milder (HIS 5 0.78–0.042 3 total VF) (r 5 20.875, P , 0.001). HIS was also inversely correlated with VF when analyzed by regression line (r 5 20.751, P , 0.001) or by exponential de-cay (r 5 0.875, P , 0.001). When exponential decay is plotted
Figure 3. IIR, plasma glucose, and HGP, during the
hepatic-pancre-atic clamp. Somatostatin (0.8 mg/kg/min) was infused to decrease en-dogenous insulin secretion while insulin was infused peripherally at variable rates in the first hour in order to clamp the glucose levels at fasting levels, and maintained at that rate for an additional hour. Studies were performed in 4 AL, 18 AL, and 18 CR rats. (A) IIR re-quired to maintain plasma glucose at basal values in the last 60 min of the hepatic-pancreatic clamp. *P , 0.001, **P , 0.01 vs. 4 AL. (B) Plasma glucose levels at the last 60 min of the hepatic-pancreatic clamp. (C) HGP at the last 60 min of the hepatic-pancreatic clamp.
Figure 4. Plasma insulin levels and HIS during the hepatic pancreatic
[image:6.612.316.532.366.661.2]between HIS and VF, the decay clearly leaves the low VF and high HIS (most of the 18 CR group) away from the curve.
While FM was also correlated with HIS, this correlation was weaker than that shown with VF when calculated either by linear regression (r 5 20.616, P , 0.05) or by exponential decay (r 5 0.765, P , 0.005). This figure also demonstrates how the decay leaves the low FM and high HIS away from the curve. Spline curve analysis of the relationship between FM
and HIS also demonstrated a knot at FM 5 47.2 g; however, this was less significant (P 5 0.039; R2 5 0.861) than with VF.
A linear inverse relationship was also demonstrated be-tween plasma FFA concentrations and HIS in 18 AL and 18 CR (r 5 20.640, P , 0.001) and between 4 AL and 18 CR (r 5 20.623, P , 0.001). However, when all groups were combined, this correlation did not achieve statistical significance (r 5 0.425, P , 0.06; not shown). This appeared to be due to the presence of higher HIS and plasma FFA levels in 18 CR than in 4 AL.
Refeeding of 18 CR rats. A subgroup (n 5 6) of 18 CR was fed ad libitum (18 CR refed) for 14 d. Caloric intake promptly increased by 59% and BW was increased from the state before refeeding by 661% to 481614 g (vs. 471620 g of 18 CR). While LBM was similar to that of 18 CR, there was a moderate increase in FM (by z 11% or 7 g) which did not reach statisti-cal significance. However, the increases in total VF, as well as in the epididymal, perinephric, and mesenteric depots were significantly increased by z 60% or z 5 g. Thus, the increase in VF during short-term refeeding of CR rats accounts for
z 70% of the increase in total FM. To examine the impact of this nutritional manipulation on hepatic insulin action, he-patic-pancreatic clamp studies were also performed in this group of rats. The IIR needed to achieve euglycemia in 18 CR refed and the plasma insulin concentration were z 2.5-fold higher than those required to maintain the plasma glucose and HGP at basal levels in 18 CR, resulting in a substantial de-crease (z 50%) in HIS (Table III).
Effect of age and CR on hepatic glucose fluxes, activity of key enzymes, and substrate levels. The contribution of plasma
glucose to the Glc-6-P pool was calculated from the specific ac-tivities of UDPglu and plasma glucose (Table IV). While HGP was kept at similar levels by a variable insulin infusion, the to-tal flux through Glc-6-Pase (TGO) was modestly but signifi-cantly decreased in 18 AL. Similarly, the rate of GC was decreased by 45% in 18 AL. Since the in vivo flux through Glc-6-Pase is largely regulated by the activity of this enzyme and by the size of the Glc-6-P pool, we measured these two pa-Figure 5. The relationship between IIR and VF. Points presenting
[image:7.612.57.246.56.251.2]the 4 AL, 18 AL, and 18 CR rats.
Figure 6. The relationship between HIS and VF. Points presenting
[image:7.612.58.295.429.671.2]the 4 AL, 18 AL, and 18 CR rats. These points best fit the spline curve model which reveals a significant knot at total abdominal fat of 12.6 g (P , 0.0006). Regression lines were analyzed in rats with total abdominal fat greater than or less than 12.6 g (P , 0.001 for both lines).
Table III. Body Composition and Metabolic Characteristics after Refeeding of 18 CR Rats
18 CR 18 CR refed
n 56 n 5 6
LBM (g) 412623 406611
FM (g) 6566 7266
VF (g) 7.860.6 12.460.7* Epididymal fat pad (g) 3.860.6 5.660.3* Mesenteric fat (g) 2.360.1 3.660.2* Perinephric fat (g) 1.760.5 3.360.4*
Glucose (mM) 7.261.2 7.261.7 Insulin (pM) 132618 324629* IIR (mU/kg/min) 0.5160.12 1.2660.15* HIS (mmol/kg/min)/(pmol/liter) 0.46160.021 0.23360.027*
[image:7.612.315.556.531.691.2]rameters in liver samples freeze-clamped in situ at the end of the clamp studies. While the Km for Glc-6-P was similar in the
three groups, the Glc-6-Pase Vmax was decreased by z 50% in
18 AL and by z 30% in 18 CR (Table V). Thus, a decrease in Glc-6-Pase activity was associated with aging independent of caloric intake. However, this decrease in Glc-6-Pase Vmax was
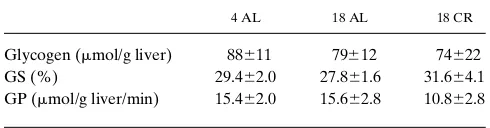
largely offset by increased concentration of the substrate (Glc-6-P). Finally, neither age nor CR altered the levels of hepatic glycogen, nor the activities of glycogen synthase and phos-phorylase (Table VI).
Discussion
Aging is associated with progressive increases in fasting plasma insulin levels and visceral adiposity in humans (1–3, 8–10) and in animal models (23, 24). Although HGP plays a pivotal role in the regulation of postabsorptive carbohydrate metabolism (30), the interactions between VF and HGP re-main poorly defined (31). Here we investigated the relation-ship between VF and the action of insulin on hepatic glucose fluxes in a well-characterized rodent model of aging (23, 24). In particular, we used chronic CR to examine whether preven-tion of the age-associated increase in VF could reverse hepatic insulin resistance. Several lines of evidence indicate that in this animal model VF is indeed a major determinant of HIS re-gardless of age. Hepatic insulin action was highly correlated with VF in all experimental groups. In fact, a statistical analysis of the results revealed that up to 96% of the variance in HIS can be accounted for by variance in visceral adiposity. CR low-ered VF below the levels observed in young (4 AL) rats and markedly improved hepatic (but not peripheral) insulin sensi-tivity. Furthermore, the hepatic sensitivity to insulin was higher in old CR than in young rats despite higher whole body FM in the former. Finally, short-term (14 d) refeeding of old CR rats rapidly increased VF and induced marked hepatic in-sulin resistance. Altogether, these results suggest that the age-related increase in VF is likely to play a major role in fasting hyperinsulinemia and hepatic insulin resistance in this rodent model of aging. However, it should be pointed out that up to 86% of the variance in HIS could be accounted for by changes in total FM. Since changes in VF are a component of the changes in total FM and these two variables are therefore
tightly linked, our data cannot ascertain whether FM exerts ef-fects on hepatic insulin action which are independent of its co-variance with VF.
[image:8.612.314.557.72.138.2]The aging Sprague-Dawley rat demonstrates several of the main metabolic features of human aging (1–6), including pro-gressive increases in FM, VF, plasma insulin, and FFA levels with age (23, 24). While the role of age-related increases in ad-iposity may be exaggerated in this rat model, it allows one to examine the mechanisms by which fat accretion impacts on metabolism with aging. Because this study was undertaken to investigate whether VF plays a pivotal role in the regulation of HIS, we wished to study the experimental animals at a time when their energy consumption and body composition had achieved a stable steady state. Thus, we restricted the caloric intake of young rats in a chronic fashion until they were 18 mo old (Fig. 1). It should be pointed out that a similar degree of CR failed to alter HIS when implemented for just 8 d before the study (29). Thus, the restrictions in daily food intake in the week immediately preceding the in vivo studies are not likely to play a major role in our findings. This dietary intervention resulted in less FM but similar LBM in 18 CR than in 18 AL. Most important, while 18 CR rats had a greater amount of FM than 4 AL, they had less total VF (Tables I and II). These changes in fat distribution were demonstrated by assessment of the distribution space of water, by postmortem dissection, and by MRI studies. Therefore, this model enabled us to inves-tigate the impact of age-related increases in VF and total FM.
Table V. Hepatic Glc-6-Pase and Glc-6-P
4 AL 18 AL 18 CR
a-Glc-6-Pase (mmol/g liver/min) 16.561.1 8.461.7* 11.662.2* b-Glc-6-Pase (mmol/kg BW/min) 650647 248650* 394672* Glc-6-P (nmol/g liver) 325653 443642* 518670*
[image:8.612.57.298.575.663.2]The a-Glc-6-Pase Vmax is expressed per grams of liver. In addition, the glucose dephosphorylation capacity was estimated for the whole liver and then calculated in terms of glucose contributed per kilogram of BW, to demonstrate the relative capacity of rats of substantially different weights, to provide glucose from the liver (b-Glc-6-Pase). Glc-6-P levels are presented as per gram of liver. *P , 0.01 vs. 4 AL; data are pre-sented as mean6SEM.
Table VI. Glycogen Levels and the Enzyme Activities of Hepatic Glycogen Synthase (GS) and Glycogen Phosphorylase (GP)
4 AL 18 AL 18 CR
Glycogen (mmol/g liver) 88611 79612 74622 GS (%) 29.462.0 27.861.6 31.664.1 GP (mmol/g liver/min) 15.462.0 15.662.8 10.862.8
The enzymes’ activities were obtained from liver freezed-clamp in situ by spectrophotometric method from 4 AL, 18 AL, and 18 CR rats. The fractional velocity (FV 0.1) for the hepatic glycogen synthase represents the mean of the activity ratios in the presence of three physiologic UDP-Glu concentrations (0.125, 0.25, and 0.5 mM) with 0.11 mM Glc-6-P. The hepatic active form (a) of GP is the activity in the absence of AMP. Data are presented as mean6SEM.
Table IV. Hepatic Glucose Fluxes
4 AL 18 AL 18 CR
[3H]Glc (dpm/nmol) 41.564.3 39.464.2 61.268.3 [3H]UDPGlc (dpm/nmol) 9.461.1 6.561.7 12.662.2 Direct (%) 22.763.1 16.562.5 20.062.5 TGO (mg/kg/min) 14.260.4 12.460.4* 13.660.4 GC (mg/kg/min) 3.660.4 2.060.6* 2.960.3*
[image:8.612.313.558.599.663.2]As previously reported (23, 24), the increase in FM with aging was associated with increases in both plasma insulin and FFA levels.
Evidence suggests that in this animal model peripheral in-sulin sensitivity is decreased at a relatively young age. Indeed, we could not demonstrate any further decrease in insulin re-sponsiveness after late adulthood when fat tissue reached a certain mass (24). While CR was shown to improve insulin sen-sitivity in lean rodent models which are relatively more calorie restricted (32), we predicted that as long as FM does not de-crease to below the levels seen at 4 mo of age, peripheral insu-lin responsiveness will not improve. As demonstrated, insuinsu-lin responsiveness (i.e., insulin sensitivity at maximally stimulat-ing insulin levels) did not change significantly by CR when ex-pressed in terms of LBM. This further supports the notion that increased basal plasma insulin levels reflect the decrease in he-patic rather than the peripheral insulin sensitivity.
The ratio of basal HGP to peripheral plasma insulin levels may reflect the degree of HIS in humans and animals. How-ever, peripheral plasma insulin levels fail to account for the gradient between the portal and peripheral plasma insulin lev-els, which may change with body composition, fat distribution, or with the development of insulin resistance. The hepatic-pancreatic clamp approach, providing exogenous insulin and somatostatin infusions while maintaining a constant plasma glucose concentration, overcomes this problem by erasing the portal/peripheral gradient in plasma insulin levels. On the other hand, this design also results in higher peripheral plasma insulin levels than those during the basal period, as reflected by a modest decrease in both plasma FFA levels and HGP. However, regardless of the study period which is considered, it is clear that the hepatic sensitivity to either endogenous (basal) or exogenous (pancreatic clamp) insulin was significantly de-creased with aging. In fact, a doubling of the rate of insulin in-fusion and of the plasma insulin concentration was necessary to achieve similar rates of HGP as were measured in the young rats. By contrast, 18 CR displayed a marked enhancement in the ability of insulin to suppress HGP even when compared with 4 AL rats (Fig. 4 B). Moreover, when a subgroup of 18 CR rats was infused with rates of insulin infusion similar to those required in the 18 AL rats, their HGP was significantly decreased and maintenance of euglycemia required the infu-sion of exogenous glucose. Since the present findings demon-strate that CR induces a marked improvement in hepatic insu-lin action in aging rats, we further analyzed the relationship between HIS and the associated changes in body composition across the various experimental groups. The most striking cor-relation was found with VF (Fig. 5). It is apparent from our studies that the relationship between HIS and VF is not simply linear (Fig. 6). While an exponential decay curve can be fitted, spline curve analysis best fitted the individual points. It seems that beyond a certain VF mass (12.6 g), additional VF still sulted in further decreased HIS; however, its impact is re-duced. Interestingly, saturating effects of FM on peripheral in-sulin action have been demonstrated in Pima Indians (33) and in our rat model (23), suggesting that once a certain critical level of fat accretion is achieved, further alterations in glucose metabolism are difficult to detect. While the above analysis re-mains virtually unchanged when the group which was calorie restricted and then refed was excluded, this latter group pro-vides strong additional support for the role of VF in determin-ing HIS. In fact, refeeddetermin-ing of 18 CR rats for 2 wk resulted in a
rapid and dramatic increase in VF (by z 5 g), accounting for
z 70% of the increase in total FM, and induced severe hepatic insulin resistance.
While the mechanism(s) whereby VF determines insulin sensitivity remain to be delineated, the unique metabolic char-acteristics of the mesenteric and omental fat depots as con-cerns the turnover of glycerol, FFA, and lactate are likely to play a role. Indeed, FFA metabolism measured by a variety of methods was shown to be impaired in humans with increased VF both in vivo (34–36) and in vitro (36–38). Bjorntorp (15) hypothesized that the metabolic importance of VF may be due to the delivery of substrates such as lactate, FFA, and glycerol into the portal system exerting potent and direct effects on the liver. In fact, it is now well established that the plasma FFA concentration is a major modulator of hepatic insulin action (39, 40). In keeping with this theory, mesenteric/omental fat is metabolically more important than subcutaneous fat. Thus, sustained differences in the portal concentrations of FFA, glycerol, and lactate between 18 AL and 18 CR reflecting changes in lipid turnover in mesenteric/omental tissue could play a role in the regulation of HIS. Alternative mechanism(s) responsible for the differential effects of visceral and subcutane-ous fat depots on glucose metabolism remain to be explored and are the object of intense investigation in several laboratories.
A significant decrease in Glc-6-Pase Vmax was shown in
despite much higher levels of Glc-6-P. Taken together these results indicated that the improvement in HIS with CR is due to a marked decrease in the rate of Glc-6-P dephosphorylation to glucose.
Our results indicate that postabsorptive hyperinsulinemia in aging is likely due to a marked decrease in the ability of in-sulin to inhibit HGP. They also support the notion that FM in general and the marked age-dependent increase in VF in par-ticular play a pivotal role in this alteration of hepatic carbohy-drate metabolism in this animal model of aging. Thus, we pro-pose that specific interventions designed to reduce VF in aging might greatly improve hepatic insulin action. Further studies will be necessary to identify the specific hormonal and/or met-abolic signals by which VF regulates hepatic glucose fluxes in the hope to ultimately devise alternative therapeutic interven-tions.
Acknowledgments
The authors thank Meizhu Hu and Rong Liu for their excellent tech-nical assistance.
This work was supported by grants from the National Institutes of Health (R01-DK 45024 and ROI-DK 48321), the American Diabetes Association, and by the Core Laboratories of the Albert Einstein Di-abetes Research and Training Center (DK 20541). Dr. Barzilai is a recipient of the Paul Beeson Physician Faculty Scholar in Aging Award, and is supported by grants from the National Institutes of Health (KO8-AG00639, R29-AG15003). Dr. Rossetti is the recipient of a Career Scientist Award from the Irma T. Hirschl Trust.
References
1. Reaven, G.M., and E.P. Reaven. 1985. Age, glucose intolerance, and non-insulin dependent diabetes mellitus. J. Am. Geriatr. Soc. 33:286–290.
2. Davidson, M.B. 1979. The effect of aging on carbohydrate metabolism: a review of the English literature and a practical approach to the diagnosis of dia-betes mellitus in the elderly. Metabolism. 28:688–705.
3. Fraze, E., M. Chlou, Y. Chen, and G.M. Reaven. 1987. Age related changes in postprandial plasma glucose, insulin, and FFA concentrations in non-diabetic individuals. J. Am. Geriatr. Soc. 35:224–228.
4. Reaven, G.M. 1988. Role of insulin resistance in human disease (Banting lecture). Diabetes. 37:1595–1607.
5. Kuczmarski, R.J., K.M. Flegal, S.M. Campbell, and C.L. Johnson. 1994. Increasing prevalence of overweight among US adults. The National Health and Nutrition Examination Surveys, 1960 to 1991 (NHANES III). J. Am. Med.
Assoc. 272:238–239.
6. Prager, R., P. Wallace, and J.M. Olefsky. 1986. In vivo kinetics of insulin action on peripheral glucose disposal and hepatic glucose output in normal and obese subjects. J. Clin. Invest. 78:472–481.
7. Ferrannini, E., S. Vichi, H. Beck-Nielsen, M. Laakso, G. Paolisso, and U. Smith, European Group for the Study of Insulin Resistance (EGIR). 1996. In-sulin action and age. Diabetes. 45:947–953.
8. Shimokata, H., J.D. Tobin, D.C. Muller, D. Elahi, P.J. Coon, and R. An-dres. 1989. Studies in the distribution of body fat. I. Effects of age, sex, and obe-sity. J. Gerontol. 44:M66–M73.
9. Enzi, G., M. Gasparo, P.R. Biondetti, D. Fiore, M. Semisa, and F. Zurlo. 1986. Subcutaneous and visceral fat distribution according to sex, age, and over-weight, evaluated by computed tomography. Am. J. Clin. Nutr. 44:737–746.
10. Borkan, G.A., D.E. Hults, S.G. Gerzof, A.H. Robbins, and C.K. Silbert. 1983. Age changes in body composition revealed by computed tomography. J.
Gerontol. 38:673–677.
11. Peiris, A.N., M.F. Struve, R.A. Mueller, M.B. Lee, and A.H. Kissebah. 1988. Glucose metabolism in obesity: influence of body fat distribution. J. Clin.
Endocrinol. Metab. 67:760–767.
12. Colberg, S.R., J.A. Simoneau, F.L. Thaete, and D.E. Kelley. 1995. Skel-etal muscle utilization of free fatty acids in women with visceral obesity. J. Clin.
Invest. 95:1846–1853.
13. Carey, D.G., A.B. Jenkins, L.V. Campbell, J. Freund, and D.J. Chis-holm. 1996. Abdominal fat and insulin resistance in normal and overweight women: direct measurements reveal a strong relationship in subjects at both low and high risk of NIDDM. Diabetes. 45:633–638.
14. Coon, P.J., E.M. Rogus, D. Drinkwater, D.C. Muller, and A.P. Gold-berg. 1992. Role of body fat distribution in the decline in insulin sensitivity and
glucose tolerance with age. J. Clin. Endocrinol. Metab. 75:1125–1132. 15. Bjorntorp, P. 1990. “Portal” adipose tissue as a generator of risk factors for cardiovascular disease and diabetes. Arteriosclerosis. 10:493–496.
16. Williamson, J., R.A. Kreisberg, and P.W. Pelts. 1966. Mechanisms for the stimulation of gluconeogenesis by fatty acids in perfused rat liver. Proc.
Natl. Acad. Sci. USA. 56:247–254.
17. Barzilai, N., J. Stessman, P. Cohen, G. Morali, D. Barzilai, and E. Karn-ieli. 1989. Glucoregulatory hormone influence on hepatic glucose production in the elderly. Age. 12:13–17.
18. DeFronzo, R.A. 1979. Glucose intolerance and aging: evidence for tis-sue insensitivity to insulin. Diabetes. 28:1095–1101.
19. Gumbiner, B., A.W. Thorburn, T.M. Difzler, F. Bulacan, and R.R. Henry. 1992. Role of impaired intracellular glucose metabolism in the insulin resistance of aging. Metabolism. 41:1115–1121.
20. Jackson, R.A., M.I. Hawa, R.D. Roshania, B.M. Sim, L. DiSilvio, and J.B. Jaspan. 1988. Influence of aging, on hepatic and peripheral glucose metab-olism in human. Diabetes. 37:119–129.
21. Fink, R.I., O.G. Kolterman, J. Griffin, and J.M. Olefsky. 1983. Mecha-nisms of insulin resistance in aging. J. Clin. Invest. 71:1523–1535.
22. O’Shaughnessy, I.M., T.J. Myers, K. Stepniakowski, P. Nazzaro, T.M. Kelly, R.G. Hoffmann, B.M. Egan, and A.H. Kissebah. 1995. Glucose metabo-lism in abdominally obese hypertensive and normotensive subjects.
Hyperten-sion. 26:186–192.
23. Barzilai, N., and L. Rossetti. 1995. The relationship between changes in body composition and insulin responsiveness in models of aging rats. Am. J.
Physiol. 269:E591–E597.
24. Barzilai, N., and L. Rossetti. 1996. Age-related changes in body compo-sition are associated with hepatic insulin resistance in conscious rats. Am. J.
Physiol. 270:E930–E936.
25. Rossetti, L., D. Smith, G.I. Shulman, D. Papachristou, and R.A. De-Fronzo. 1987. Correction of hyperglycemia with phlorozin normalizes tissue sensitivity to insulin in diabetic rats. J. Clin. Invest. 79:1510–1515.
26. Rossetti, L., A. Giaccari, N. Barzilai, K. Howard, G. Sebel, and M. Hu. 1993. Mechanism by which hyperglycemia inhibits hepatic glucose production in conscious rats. Implications for the pathophysiology of fasting hyperglycemia in diabetes. J. Clin. Invest. 92:1126–1134.
27. Wolfe, R.R. 1984. Radioisotopes and Stable Isotopes: Mass Spectrome-try Methods. Alan R. Liss, Inc., New York.
28. Barzilai, N., and L. Rossetti. 1993. Role of glucokinase and glucose-6-phosphatase in the acute and chronic regulation of hepatic glucose fluxes by in-sulin. J. Biol. Chem. 268:25019–25025.
29. Barzilai, N., J. Wang, D. Massilon, P. Vuguin, M. Hawkins, and L. Ros-setti. 1997. Leptin selectively decreases visceral adiposity and enhances insulin action. J. Clin Invest. 100:3105–3110.
30. DeFronzo, R.A. 1988. The triumvirate: B-cell, muscle, liver. A collusion responsible for NIDDM. Diabetes. 37:667–687.
31. Kissebah, A.H. 1996. Intra-abdominal fat: is it a major factor in develop-ing diabetes and coronary artery disease? Diabetes Res. Clin. Pract. 30(Suppl.): 25–30.
32. Ivy, J.L., J.C. Young, B.W. Craig, W.M. Kohrt, and J.O. Holloszy. 1991. Ageing, exercise and food restriction: effects on skeletal muscle glucose uptake.
Mech. Ageing Devel. 61:123–133.
33. Bogardus, C., S. Lillia, D.M. Mott, C. Hollenbeck, and G. Reaven. 1985. Relationship between degree of obesity and in vivo insulin action in man. Am.
J. Physiol. 248:E286–E291.
34. Jensen, M.D., M.W. Haymond, R.A. Rizza, P.E. Cryer, and J.M. Miles. 1989. Influence of body fat distribution on free fatty acid metabolism in obesity.
J. Clin. Invest. 83:1168–1173.
35. Marin, P., B. Andersson, M. Ottosson, L. Olbe, B. Chowdhury, H. Kvist, G. Holm, L. Sjostrom, and P. Bjorntorp. 1992. The morphology and metabo-lism of intraabdominal adipose tissue in men. Metabometabo-lism. 41:1242–1248.
36. Nicklas, B.J., A.P. Goldberg, L.B. Bunyard, and E.T. Poehlman. 1995. Visceral adiposity is associated with increased lipid oxidation in obese. Am. J.
Clin. Nutr. 62:918–922.
37. Busetto, L., M. Digito, P. Dalla Monta, R. Carraro, and G. Enzi. 1993. Omental and epigastric adipose tissue lipolytic activity in human obesity. Effect of abdominal fat distribution and relationship with hyperinsulinemia. Horm.
Metabol. Res. 25:365–371.
38. Feinstein, R., H. Kanety, M.S. Papa, B. Lunenfeld, and A. Karasic. 1993. Tumor necrosis factor-alpha suppresses insulin-induced tyrosine phosphoryla-tion of insulin receptor and its substrates. J. Biol. Chem. 268:26055–26057.
39. Boden, G., X. Chen, J. Ruiz, J.V. White, and L. Rossetti. 1994. Mecha-nisms of fatty acids induced inhibition of glucose uptake. J. Clin. Invest. 93: 2438–2446.
40. Rebrin, K., G.M. Steil, S.D. Mittelman, and R.N. Bergman. 1996. Causal linkage between insulin suppression of lipolysis and suppression of liver glucose output in dogs. J. Clin. Invest. 98:741–749.
41. Massillon, D., N. Barzilai, W. Chen, and L. Rossetti. 1996. Glucose reg-ulates in vivo glucose-6-phosphatase gene expression in the liver of diabetics rats. J. Biol. Chem. 1271:9871–9874.