© 2016, IRJET | Impact Factor value: 4.45 | ISO 9001:2008 Certified Journal | Page 2845
Crack Analysis of Composite Cantilever Beam by Using Vibration
Analysis Technique
Ashish S. Apate
1Nitin N. More
21
PG Student, Department of Mechanical Engineering (Design), SKNSITS, Lonavala, Maharashtra, India
2Assistant Professor, Department of Mechanical Engineering, SKNSITS, Lonavala, Maharashtra, India
---***---Abstract - Cantilever beam is widely used in engineeringapplication such as military, naval and aeronautical. Crack initiate due to different kinds of loading. The presence of crack alters the physical as well as dynamic characteristics of structure. Therefore detection of crack is major issue. The existence of crack affects vibration parameter such as natural frequency, mode shape and stiffness. In this paper change in natural frequency, mode shape is analyzed by using finite element analysis as well as experimental. It is observed that specimen having different crack inclination, crack location and crack depth its natural frequency get varies.
Keywords – Composite cantilever Beam, Crack depth, Crack location, Crack inclination, Vibration Analyzer, Finite Element Analysis.
I.
Introduction
The composite structure finds its application in various fields like aircraft structure, military equipment, high speed machinery and civilian product. The presence of crack changes structural as well as dynamic response characteristics of structure. So it’s more important to detection of crack in early stage. For detection of crack lot of non- destructive techniques are available but they are tedious and costly.
Gade Ganesh G.,Mhaske M.S.[1] explained that, open edge in steel cantilever beam analyzed by using finite element analysis as well as experimental. This method measure natural frequency of beam. Pankaj Charan Jena, Dayal R. Parhi, Goutam Pohit[2] explained that, identification of single crack in aluminum cantilever beam by varying crack location and crack depth. This method compare theoretical as well as experimental. D.K.Agrawalla , D.R.Parhi[3] explained that, effect of open crack modal parameter of a aluminum beam vibrate more frequency in the presence of crack away from the fixed end. FB Sayyad [4] explained that, approximate analytical method for damage detection in free- free beam by measurement of axial vibration .Khushar H.Barad, D.S.Sharma, Vishal Vyas[5] explained that, detection of crack of a beam type structure element using vibration parameter such as natural frequency. Saidi Abdelkrim[6] explained
that, dynamic characteristics of damaged and undamaged beams are too different. The object of this study is analyzed the vibration behavior of concrete beam both experimentally ad FEA software subjected to free vibration cases. Ranjan K.Behran[7] explained that, detection of crack in cantilever beam on synthesis of mode shapes. This method compare mode shapes numerically and experimentally. Amit Banerjee,G Pohit[8] explained that, fractal dimension analysis for detection of crack in rotating cantilever beam.
II. Design Model of cantilever beam
The continuous model of the beam has been separated for simplification. According to R. K. Behera, for inclined crack
beam, and θ = 45°, the difference in
the two extreme location is less than 4% of the beam length Design model of cantilever beam as shown in figure 1.
L = Length of cantilever Beam
L1= Length of a crack from fixed end a = Crack depth
h = Depth of beam θ = Crack inclination
Figu re1 Design model of cantilever beam
III. Theoretical Analysis
© 2016, IRJET | Impact Factor value: 4.45 | ISO 9001:2008 Certified Journal | Page 2846 has ignored in this study. The free vibration of an Euler
Bernoulli of a constant rectangular cross section is given by the following governing equation:
Where E is Young’s modulus of elasticity, I is the moment of inertia of beam, y is the displacement, ω is natural frequency, m is the mass of beam, m=ρA, A is the cross sectional area, ρ is the material density.
Reduced form,
The mode shape of continuous cantilever beam is given
as
.…… (6)
Where, n=1, 2, 3----∞ and
IV. Finite element analysis
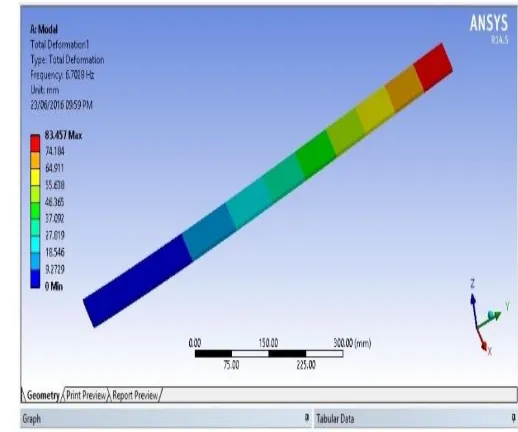
FEA helps the designer know all the theoretical stresses within the structure by indicating all the problem in detail and thus helping the designer to predict the failure of the structure. It is a cheap method of finding the causes of failure and the way the failures can be avoided. The model of beam with and without crack is originated and used for Finite Element Analysis. The modal analysis of inclined cracked and cracked cantilever beam to determine natural frequency and mode shapes at different location, inclination and depth is
[image:2.595.299.558.198.414.2]carried out. The material property of Young’s modulus of elasticity (E) is 39 GPa, Poission ratio (υ) is 0.3, Density (ρ) is 2000 kg/m3.The following figure shows first three natural frequencies and corresponding mode shapes of composite cantilever beam by using Ansys R14.5. The cantilever beam having c = 0.20, e = 0.10 and θ = 45°. The first mode shape of cracked cantilever beam as shown in figure 2.
Figure 2 First Mode shape of cracked beam with c=0.20, e=0.10, θ=450
[image:2.595.307.561.492.672.2]The second mode shape of cracked cantilever beam as shown in figure 3.
Figure 3 First Mode shape of cracked beam with c=0.20, e=0.10, θ=450
© 2016, IRJET | Impact Factor value: 4.45 | ISO 9001:2008 Certified Journal | Page 2847 Figure 4 Third mode shape of cracked beam with
c=0.20, e=0.10, θ=450
V. EXPERIMENTAL ANALYSIS
[image:3.595.35.288.378.530.2]The experimental modal analysis consist of piezoelectric accelerometer, impact hammer, data acquisition card, smart office software are the working element of conducting free vibration analysis for identification of crack. The schematic setup of experimental is as shown in following figure.
Figure shows Schematic setup of experimental model
The experimental setup which is shown in above figure is used to find the natural frequencies of beam. Figure shows that cantilever beam placing the accelerometer on the surface of beam connected to analyzer. The E Glass fiber epoxy cantilever beam specimen with dimensions (800mm x 60mm x 6mm) with and without an inclined crack is subjected to no. of experimentation is carried out for determining the natural frequencies. The accelerometer is kept near the crack to capture the correct signal. The impact hammer is used to excite the cantilever beam whose frequency response has to be captured. For every test, the location of impact hammer is kept constant. Cracks are developed at different location from fixed end with different specimens with the help of diamond cutter. The natural
frequencies of first three modes are noted with different crack inclination, crack location and crack depth.
VI. RESULTS
Crack detection technique using changes in natural frequencies for identifying crack parameters are discussed in this portion. Measuring the first three natural frequencies will be sufficient to find out the crack parameters for a cracked composite beam. The following table shows the first three natural frequencies of cantilever beam by using finite element analysis and FFT. Comparison of FEA & experimental results of uncracked beam is shown in following tables.
Table 1 Comparison between FEA and Experimental results of uncracked beam
FEA Experimental
FNF
Hz
SNF
Hz
TNF
Hz
FNF
Hz
SNF
Hz
TNF
Hz
[image:3.595.303.566.462.704.2]6.7352 42.194 66.688 7.001 43.95 70.014
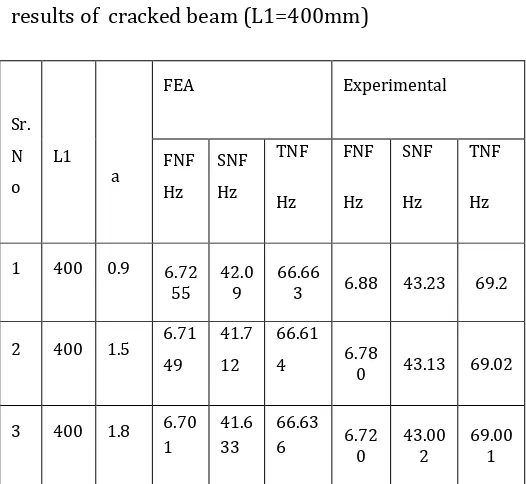
Table 2 Comparison between FEA and Experimental
results of cracked beam (L1=400mm)
Sr. N o
L1
a
FEA Experimental
FNF Hz
SNF Hz
TNF
Hz
FNF
Hz
SNF
Hz
TNF
Hz
1 400 0.9 6.72
55 42.09 66.663 6.88 43.23 69.2
2 400 1.5 6.71
49 41.7 12
66.61
4 6.780 43.13 69.02
3 400 1.8 6.70
1
41.6 33
66.63
6 6.720 43.002 69.001
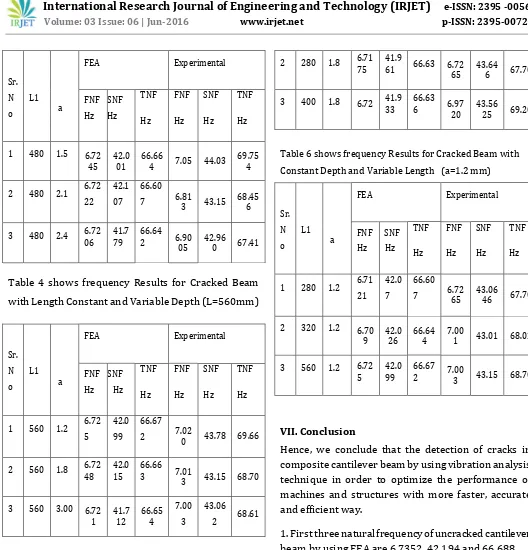
© 2016, IRJET | Impact Factor value: 4.45 | ISO 9001:2008 Certified Journal | Page 2848 Sr. N o L1 a
FEA Experimental
FNF Hz SNF Hz TNF Hz FNF Hz SNF Hz TNF Hz
1 480 1.5 6.72
45 42.001 66.664 7.05 44.03 69.754
2 480 2.1 6.72
22 42.1 07
66.60
7 6.813 43.15 68.456
3 480 2.4 6.72
06 41.7 79
66.64
2 6.9005 42.960 67.41
Table 4 shows frequency Results for Cracked Beam
with Length Constant and Variable Depth (L=560mm)
Sr. N o L1 a
FEA Experimental
FNF Hz SNF Hz TNF Hz FNF Hz SNF Hz TNF Hz
1 560 1.2 6.72
5
42.0 99
66.67
2 7.020 43.78 69.66
2 560 1.8 6.72
48 42.0 15
66.66
3 7.013 43.15 68.70
3 560 3.00 6.72
1 41.712 66.654 7.00
3
43.06
[image:4.595.28.556.49.599.2]2 68.61
Table 5 shows frequency Results for Cracked Beam with Constant Depth and Variable Length (a=1.8 mm)
Sr. N o L1 a
FEA Experimental
FNF Hz SNF Hz TNF Hz FNF Hz SNF Hz TNF Hz
1 200 1.8 6.70
28 42.1 41
66.53
4 6.6862 43.75 63.545
2 280 1.8 6.71
75 41.9
61 66.63 6.7265 43.646 67.70
3 400 1.8 6.72 41.9
33
66.63
6 6.9720 43.5625 69.20
Table 6 shows frequency Results for Cracked Beam with Constant Depth and Variable Length (a=1.2 mm)
Sr. N o L1 a
FEA Experimental
FNF Hz SNF Hz TNF Hz FNF Hz SNF Hz TNF Hz
1 280 1.2 6.71
21 42.0 7
66.60
7 6.7265 43.0646 67.70
2 320 1.2 6.70
9 42.026 66.644 7.001 43.01 68.02
3 560 1.2 6.72
5
42.0 99
66.67
2 7.003 43.15 68.70
VII. Conclusion
Hence, we conclude that the detection of cracks in
composite cantilever beam by using vibration analysis
technique in order to optimize the performance of
machines and structures with more faster, accurate
and efficient way.
1. First three natural frequency of uncracked cantilever
beam by using FEA are 6.7352, 42.194 and 66.688.
2. First three natural frequency of uncracked cantilever
beam by using FFT are 7.001, 43.95 and 70.014.
3. First three natural frequencies of cracked beam at
different location and different depth also compared.
© 2016, IRJET | Impact Factor value: 4.45 | ISO 9001:2008 Certified Journal | Page 2849
5. Crack is near to fixed end it largely reduces natural
frequency.
6. It is found that if crack location and inclination is
kept constant then crack depth increases natural
frequencies are decreases.
7. If crack location and crack depth is kept constant
then crack location increases natural frequencies
increases.
The results obtained by FEA and experimentally are
compared and they match well.
REFERENCES
[1]Mr.Gade Ganesh G., Mhaske M.S."A Review on Vibration Analysis of a Cantilever cracked Beam Using Various Techniques” IJARIIE-ISSN(O)-2395-4396,2015.
[2]Pankaj Charan Jena, Dayal R. Parhi, Goutam Pohit"Fault detection of a single cracked beam by theoretical and experimental analysis using vibration signatures” IOSR Journal of Mechanical and Civil Engineering,(Nov-Dec 2012), PP01-18.
[3] D.K. Agarwalla, D.R. Parhi, "Effect of Crack on Modal Parameters of a Cantilever Beam Subjected to Vibration procedia Engineering" 51 pp. 665 – 669, 2013
[4]FB Sayyad, B Kumar and SA Khan, ―Approximate analytical method of damage detection in free-free beam by measurement of axial vibrations‖, International Journal of Damage Mechanics,pp.133142,2013
[5]K. H. Borad et al,'Crack Detection in Cantilever Beam by Frequency Based Method', Procedia Engineering,pp770-775, 2013 [6]Saidi abdelkrim,Hamouine abdelmadjid" Crack detection in concrete beams using experimental modal data”, ICSD , EURODYN 2011, Belgium.
[7] Ranjan K. Behera, Anish Pandey, D. R. Parhi, ―Numerical & Experimental Verification of a Method for Prognosis of Inclined Edge Crack in Cantilever Beam Based on Synthesis of Mode Shapes‖, International Conference on Innovations in Automation & Mechatronics Engineering,ICIAME,pp.67-74,2014.
[8] Amit Banerjee,G. Pohit, "Crack investigation of rotating cantilever beam by fractal dimension analysis”, 2nd International
Conference on Innovation in Automobile and Mechatronics Engineering , ICIAME 2014.
BIOGRAPHIES
Ashish S. Apate
PG Student, Department of Mechanical Engineering (Design), SKNSITS, Lonavala, Maharashtra, India.
Nitin N. More Assistant Professor, Department of Mechanical Engineering, SKNSITS, Lonavala, Maharashtra, India.