© 2016, IRJET | Impact Factor value: 4.45 | ISO 9001:2008 Certified Journal
| Page 322
Performance Deviation Measurement Using Conventional & Practically
Derived Threshold in MF Receiver for Binarised Sound Signals
Bimla Pandey
11
Assistant Professor, Dept. of ECE Engineering, IIMT College, U.P, India
---***---Abstract –
The need and necessities of communication systems are expanding day by day. Today system reliability is an important user requirement. Matched filter based receiver (MF receiver) work on threshold (
) which is logarithmic function of input signal parameters, r0 and r1.Under certain assumptions, the threshold (
) at the MF receiver is considered as ‘0’ i.e
=0 since probability of input signal r0 and r1 are assumed as 0.5. But many inputsignals of practical importance and under other circumstances threshold (
pract) at the MF receiver maynot be equal to zero i.e
pract ≠ 0. This leads to the deviationin the performance which is evaluated by using
= 0, and considering
pract at the MF receiver. Here
pract is the practically derived threshold at the MF receiver using a well defined methodology.In this work for different considered digitized sound signal as input, various results are plotted in the form of percentage BER deviation vs. SNR curves. From the results it is found that substantial performance deviations do exist for sound categories especially at low SNR values and smaller window length. The simulation analysis study is carried out using MATLAB 7.6.0.324 (R2008a) version.Key Words: MF Receiver, BER, MATLAB, SNR.
1. INTRODUCTION
Future mobile radio systems will have to meet exacting requirements. Data rate per user is expected to increase significantly, but could also vary substantially between the peak & typical values. With data traffic dominating over voice transmissions, the demands in data rate between downlink and uplink are becoming asymmetric. Quality of service – a complex parameter which can be defined in several ways – is of particular interest to mobile users. And with many future services likely to be location based, mechanisms will be necessary to derive the user’s location or other context. Although hidden from the user, one of the most important issues is the integration of packet-switched [10] and IP-based traffic [11].
Network operators have made significant investments in building IP core networks based on internet system architectures. Further efforts are needed to optimize these
and ease the integration of fixed and wireless networks. Frequency spectrum and bandwidth allocation will be important considerations. Radio spectrum is scarce, and therefore expensive and hence future systems will have to be very efficient in how they use the limited spectrum available. Alternative methods of spectral allocation and use could also be considered. The system must be able to dynamically change the allocated resources as users’ requirements and available capacities change [11].
In mobile based Communication System [10], there were many problems in network like low bandwidth, slow data rate, data are not secure (because signals being available in open). The subject communication runs into cyber security problems. Our main objective is to provide a highly secure environment that is simple to use and deploy. So we will use agent base communication which is more effective in mobile communication and improve security for obtaining the goal. Personalization and seamless access will be key features in making future mobile services and devices easier to use and offering greater added value. To make the most of the opportunities offered by new technologies, future mobile services and devices will need to be much easier to use. The user can be anywhere, at home, on the move and still able to access his customized services. Continuity of service from fixed to mobile access and seamless roaming of services across operators, heterogeneous networks and terminals, country and cultural boarders should become a reality [11].
1.1 Communication System Block Diagram
© 2016, IRJET | Impact Factor value: 4.45 | ISO 9001:2008 Certified Journal
| Page 323
The first block is source of information in which we can use two types of information sources analog information sources and digital information sources [5]. The message produced by a source, normally, is not electrical. Hence an input transducer is used for converting the message to a time – varying electrical quantity called message signal. Similarly, at the destination point, another transducer converts the electrical waveform to the appropriate message. The transmitter is located at one point in space, the receiver is located at some other point separate from the transmitter, and the channel is the medium that provides the electrical connection between them [5].
The purpose of the transmitter is to transform the message signal produced by the source of information into a form suitable for transmission over the channel. The received signal is normally corrupted version of the transmitted signal, which is due to channel imperfections, noise and interference from other sources. The receiver has the task of operating on the received signal so as to reconstruct a recognizable form of the original message signal and to deliver it to the user destination [5].
The encoder converts the input i.e. symbol sequence into a binary sequence of 0’s and 1’s by assigning code words to the symbols in the input sequence. At the receiver, the decoder converts the binary output of the channel decoder into a symbol sequence [4].Error control is accomplished by the channel coding operation that consists of systematically adding extra bits to the output of the source coder. These extra bits do not convey any information but helps the receiver to detect and/or correct some of the errors in the information bearing bits. The channel decoder recovers the information bearing bits from the coded binary stream [4].
In digital modulation, an analog carrier signal is modulated by a discrete signal. Digital modulation methods can be considered as digital-to-analog conversion, and the corresponding demodulation or detection as analog-to-digital conversion. The changes in the carrier signal are chosen from a finite number of M alternative symbols (the modulation alphabet) [5].
The modulator transforms the signal or symbol to be transmitted into the signal that is propagated across the channel; the channel may add noise and distortion. The channel is the physical transmission medium over which the communication is sent. It may be wires, radio airwaves, fiber optics, etc. All channels have physical limitations which will distort and attenuate the transmitted signal and which will add noise to the transmitted signal. Thus, the received signal will not be an exact duplicate of the transmitted signal [5].
1.2 Optimum Reception in Additive White Gaussian
Noise (AWGN)
The performance of the receiver is usually measured in terms of the probability of error and the receiver is said to be optimum if it yields the minimum probability of error [6]. The measure of performance used for comparing digital modulation schemes is the probability of error .The receiver makes errors in the decoding process due to the noise present at its input. The receiver parameters as H(f) and threshold setting are chosen to minimize the probability of error [6].
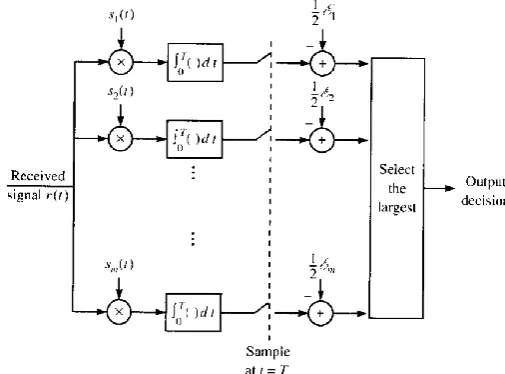
Fig -2: Block diagram of optimum receiver [6]
Signal detection in MF receiver is based on the use of threshold which is logarithmic function of input signal parameters, r0and r1 [6].
1 0
ln
4
r
r
AT
N
b o opt
(1)The subscript opt in Eq. (1) indicates that this threshold is optimal provided parameters No, A, Tb, r0, r1 are known at
the receiver. Usually, at the receiver, No, A, Tb are known
and r0and r1 are assumed as 0.5. This leads to
= 0 [6].Chann el
Informati on recovere d
Decoder Digital
Demodulat or Informati
on source
Encode r
[image:2.595.315.568.385.572.2]Digital Modulat or
Fig -1: Block Diagram of Digital Communication
© 2016, IRJET | Impact Factor value: 4.45 | ISO 9001:2008 Certified Journal
| Page 324
2. SIGNAL CONSIDERED AND METHODOLOGY
ADOPTED
2.1 SoundSignals
Sound is a vibration of a medium (such as air), associates a pressure value to every value of time and three space coordinates. It can be sampled at a discrete set of time points. A sound signal is converted to an electrical signal by a microphone, generating a voltage signal as an analog of the sound signal, making the sound signal available for further signal processing.
[image:3.595.67.255.342.470.2]A sound signals is generally characterized by following parameters: The first one is frequency and second one is pitch. The shorter the wavelength, higher would be the frequency, and the higher the pitch, of the sound. Since the sounds are travelling at about the same speed, the one with shorter wavelength will go by more frequently, it has higher frequency and pitch. In other words, it sounds higher.
Fig -3: Relationship between wavelength & frequency of sound [7]
Fig -4: Relationship between pitch and frequency of
sound [8]
As discussed, within the sound category, four sound samples have been considered. A brief explanation of each has been presented here:
1. Speech signals:
Speech signals mostly consist of male voice and female voice. Adult men and women have different pitch and frequency of sound. The female voice has high pitch as compared to male voice. We have considered here single voice and no instrument in background and no echo is present.
2. Instrumental:
This category consists of different sound sample such that each sound sample represents a single instrument sound i.e monophonic. They do not have back vocals.
3. Music:
This category consists of different sound samples of songs which includes instrument in background. This is polyphonic type sound.
2.2
Methodology Adopted
The next step is to discuss the methodology that is adopted for the evaluation of the performance deviation of matched filter based receiver. The step-wise methodology for the evaluation of performance deviation is as follows:
Step 1: Initially take a sample of sound signal.
Step 2: Select a particular SNR.
Step 3:Convert the test signal into binary form using appropriate A/D converter. Let L’ is the length (in number
of bits) of this binarized sound.
Step 4: Consider a window-length Nw, and define
L L /NW
'
..
Step 5: If l=1, take first Nw bits of the binarized sequence.
Else, take next Nw bits of this binarized sequence.
Increment counter; l = l + 1.
Step 6: Modulate using polar NRZ line coding scheme.
Step 7: Transmit through AWGN channel.
Step 8: Receive the noisy signal at the receiver.
Step 9: Demodulate using conventional Matched filter
based receiver with assumption r0 =r1 = 0.5 (
0.5,0.5
0
)and find BER at the receiver output.. Name this as 5
. 0 , 5 . 0
BER
and store it at some memory location.Step 10: Using r0 & r1, find out
r0,r1.Use this threshold toevaluate
BER
r0,r1at the receiver output and store it at some memory location.Step 11: Check if l < L? If ‘YES’, go to Step 5 & repeat the procedure. If ‘NO’ then find out 0.5,0.5
avg
BER
&1 0r r avg
BER
by averaging all the BER that were stored previously. Further, find BER deviation as per & go to the next step.Step 12: Repeat the procedure for different SNR values. Else, go to the next step.
Step 13: Repeat the procedure for other window sizes. Else, go to the next step.
Step 14: Repeat procedure for different test samples. Else
[image:3.595.84.246.524.659.2]© 2016, IRJET | Impact Factor value: 4.45 | ISO 9001:2008 Certified Journal
| Page 325
Step 15: Plot percentage BER deviation vs. SNR curve for different window sizes (Nw) & different test signals.
3.
RESULTS
AND
DISCUSSION
3.1 Evaluation of Performance Deviation for Image Category
For the evaluation of the performance deviation various sounds signals have been sub-divided into four distinct categories. These are: Male sounds, Female sounds, Instrumental sounds and Music sounds. Male sounds are related to the high wavelength, low pitch and low frequency as compared to Female sounds. Likewise Instrumental and music sounds are pertaining to sounds covering different instruments and songs respectively. Instrumental sounds are monophonic type while music sounds are polyphonic type. Within each sound category, five different sound samples have been considered for the evaluation of performance deviation. The results are plotted in the form of percentage BER deviation (%η) vs.
SNR curves for all the considered Nw values.
Different parameters that are considered for the evaluation of performance deviation are as follows:
MATLAB 7.6.0.324 (R2008a) version is used for the simulation purpose.
Channel is assumed to be AWGN channel. Further the considered range of SNR is -30 dB ≤ SNR ≤+10 dB.
Following three window sizes (Nw) has been
considered for the analysis, Nw = 1000, 5000 and 10,000.
Standard A/D converter without A-Law and µ-law is used for the sound binarization.
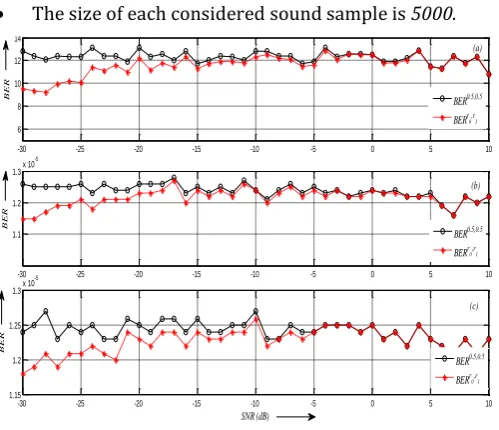
The size of each considered sound sample is 5000.
-30 -25 -20 -15 -10 -5 0 5 10
6 8 10 12 14x 10
-6
BER
-30 -25 -20 -15 -10 -5 0 5 10
1.1 1.2 1.3x 10
-5
BER
-30 -25 -20 -15 -10 -5 0 5 10
1.15 1.2 1.25 1.3x 10
-5
SNR (dB)
BER
BER0.5,0.5 BERr0,r1
BER0.5,0.5 BERr0,r1 BER0.5,0.5 BERr0,r1
(b) (a)
(c)
.
Fig -5: BER vs. SNR curve corresponding to sound
samples, for a) Nw = 1000 b) Nw = 5000 c) Nw = 10,000
From the result shown in Fig. 5, following conclusions can be drawn:
It can be seen in Fig. 5 (a) that, for all considered SNR
values and at Nw=1000, BER vs. SNR curve corresponding
to
0.5,0.5is much higher than BER vs. SNR curve corresponding to
r0,r1. Further, this shows that the conventional matched filter based receiver become suboptimal when threshold
0.5,0.5is used for the detection of practical digital signals, which is sound here.
This deviation in BER is seen for other considered Nw
values such as 5000 and 10,000 as shown in Fig 5(b) & Fig. 5(c). But, this BER deviation decreases with increase in Nw.
For all considered Nw values, at SNR = -30 dB, the
maximum deviation in BER is observed. This deviation appears to decrease with increase in SNR.
In order to compare the results corresponding to all the sounds categories that are considered, percentage BER deviation (average) vs. SNR (dB) curves are plotted for a given window sizes i.e. Nw = 1000, 5000 & 10,000 , as
shown in Fig. 6, Fig. 7 & Fig. 8 respectively. Further, all the results of Fig. 6 to Fig. 8 are averaged and plotted in Fig. 9.
-30 -25 -20 -15 -10 -5 0 5 10
0 5 10 15 20 25 30 35 40
SNR (dB)
P
e
r
c
e
nt
age
B
E
R
de
v
iat
on (
av
e
r
age
)
male female instrumental music
Fig -6: Comparison of average percentage BER deviation for all considered sound categories, corresponding to Nw
=1000.
From Fig. 6 following conclusions can be drawn, corresponding to Nw =1000, the percentage average BER
deviation vs. SNR curve corresponding to male sound category has maximum deviation at SNR = -30 dB i.e. approx. 37%. After SNR = -30 dB the male, female and instrumental sound categories are almost similar. The percentage average BER deviation of music sound category is less than male, female and instrumental sound categories. Thus for given SNR, more deviation in average
[image:4.595.312.562.416.598.2] [image:4.595.38.288.508.723.2]© 2016, IRJET | Impact Factor value: 4.45 | ISO 9001:2008 Certified Journal
| Page 326
instrumental sound categories than for the case of music sound category.
-30 -25 -20 -15 -10 -5 0 5 10
[image:5.595.309.564.139.323.2]0 2 4 6 8 10 12 14 16 18 20 SNR (dB) P e r c e nt age B E R de v iat ion ( av e r age ) male female instrumental music
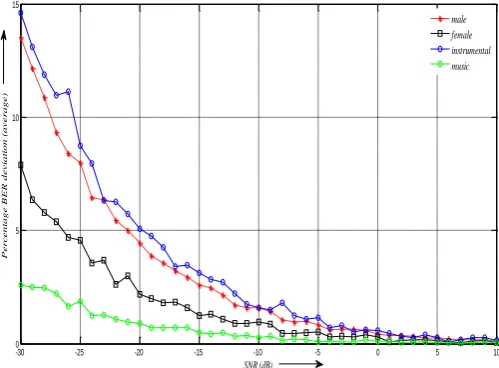
Fig -7: Comparison of average percentage BER deviation
for all considered sound categories, corresponding to Nw
=5000.
As shown in Fig. 7, corresponding to Nw = 5000, at SNR
= -30 dB, maximum percentage BER deviation of approx.
20 % is observed for the case of instrumental sound category, and, minimum of approx. 3.5% is observed for the case of music sound category. As SNR increases, this deviation decreases further.
-30 -25 -20 -15 -10 -5 0 5 10
[image:5.595.40.292.140.322.2]0 5 10 15 SNR (dB) P e r c e nt age B E R de v iat ion ( av e r age ) male female instrumental music
Fig- 8: Comparison of average percentage BER deviation
for all considered sound categories, corresponding to Nw
=10,000.
As shown in Fig. 8, corresponding to Nw = 10,000, at
SNR = -30 dB, maximum percentage BER deviation of approx. 15% is observed for the case of instrumental sound category, and, minimum of approx. 2.5% is
observed for the case of music sound category. As SNR
increases, this deviation decreases further.
-30 -25 -20 -15 -10 -5 0 5 10
0 5 10 15 20 25 30 SNR (dB) P e r c e nt age B E R de v iat ion ( av e r age ) N w = 1000 N
w = 5000 N
w = 10000
Fig -9: Final average percentage BER deviation curve for all sounds
From Fig. 9, it is clear that, for a given SNR, maximum percentage average BER deviation of approx. 30% is observed for the case of Nw = 1000 and minimum deviation
of approx. 10% is observed for the case of Nw = 10,000.
4. CONCLUSION
In this work, the performance deviation at the receiver output is evaluated for the case when i)
0.5,0.5and ii) 1
0,r r
are used as thresholds for the signal detection, at the receiver. For this, practical signal such as different sound are transmitted, window-wise. As practical signals, four categories, of sound, have been considered. Sound signals have been sub categorized as male sounds, female sounds, instrumental sounds, and, music sounds. Five samples from within these sub categories have been taken up for the evaluation of performance deviation, at the receiver output. Various results obtained are plotted in terms of percentage performance deviation vs. SNR curves, for a given window size (Nw). Here percentage performancedeviation is used as the performance parameter and 5 . 0 , 5 . 0
BER
andBER
r0,r1are the bit error rates at the output of MF receiver using
0.5,0.5and
r0,r1 respectively. Further, in order to generalize these results for a given category, results corresponding to each category are averaged to obtain average percentage BER deviation and is plotted as % performance deviation vs. SNR curve, for a given Nw. Using extensive simulation results that is carried [image:5.595.42.292.464.648.2]© 2016, IRJET | Impact Factor value: 4.45 | ISO 9001:2008 Certified Journal
| Page 327
and, corresponding to smaller window size (Nw). The
maximum 80% performance deviation in BER is observed, for the case of female sound sample, at SNR = -30 dB. Also, for a given SNR and Nw, the maximum average
performance deviation is seen for the instrumental sound samples, and, minimum average performance deviation is observed for the music sound samples. Since a considerable performance deviation is seen when
r0,r1is used over
0.5,0.5, for bits detection at the receiver, this study and analysis will certainly be useful in optimizing the performance of MF based receivers.
REFERENCES
[1] Ahuja A K & Chakka R, A new approach to bit error rate reduction and its impact on telecom performance,
J Sci Ind Res, 72(2013) pp. 149-159.
[2] Ahuja A K, Chakka R & Venkata Krishna P, BER reduction in signal receivers towards greening of digital communications,Int J Commun Netws and Distr Systs., 12 (2014) pp. 82-94.
[3] Ahuja A K & Chakka R, Analysis of the performance-improvement due to a new receiver for baseband telecommunications, and development of a fast predictive model, J Sci Ind Res, 73(2014)pp. 577-587. [4] Bimla Pandey & Amit Kumar Ahuja, Measurement of
MF Receiver Performance Deviation Using Conventional and Practically Derived Threshold for Binarised Image Signals, in IJARCCE, Volume 5, Issue 8 August 2016.
[5] Haykin S, Communication systems, John Wiley & Sons, Inc. 4th edn., (2008), pp. 1-10, 253-259.
[6] Lathi B P & Ding Z, Modern digital and analog communication systems, Oxford University Press, UK, 4th edn., (2010), pp. 506-580.
[7] Relationship between wavelength & frequency of sound http://opencurriculum.org/5571/frequency-wavelength-and-pitch/]
[8] Relationship between pitch and frequency of sound
http://sophiakeatonsound.weebly.com/the- relationship-between-pitch-and-frequency-of-a-sound-wave.html
[9] Proakis J G, Communication systems engineering, Prentice Hall, 2nd edn., (1994), pp. 348-427.
[10] Rapperport T S, “Wireless communications principles & practice”, IEEE Press, New York, Prentice Hall, (1996) pp. 169-177.
[11] Joo M, New trends in technologies: devices, computer, communication and industrial systems, Sciyo Publication, Edited by Meng Joo Er., ISBN 978-953-307-212-8.
[12] Gavrilov L A & Gavrilova N S, The reliability theory of aging and longevity, J. Theor. Biol. 213 (4) (December 2001) pp. 527–545.
[13] Forouzan B, Data communications and networking, Tata McGraw-Hill, 2nd edn., (2007) pp.
55-100, 213-240.
[14] Nazer B, Reliable physical network coding layer,
Dept. of Electr. & Comput. Eng., Boston Univ., Boston, MA, USA.
[15] Matsumoto T & Matsufuji S, BER performance of M-ary/ASK system using compact matched filter bank for optical ZCZ code, Advanced Communication Technology (ICACT), 12th International Conference, Vol.
1, (2010) pp. 617-622.
[16] Chauhan V, Arora M & Chauhan R S, Comparative BER performance of PSK based modulation techniques under multipath fading, Advances in Applied Science Research, 2 (2011) pp. 521-527.
[17] Kaasila V P & Mammela A , bit error probability of a matched filter in a rayleigh fading multipath channel in the presence of interpath and intersymbol interference, communications, IEEE Transactions on Vol. 47, (June 1999) Issue 6, pp. 809-812.
[18] Pahlavan K & Matthews J W, Performance of adaptive matched filter receivers over fading multipath channels, IEEE Trans. Commun., Vol. 38, (1990) pp.2106 -2113.
![Fig -3: Relationship between wavelength & frequency of sound [7]](https://thumb-us.123doks.com/thumbv2/123dok_us/8183456.811370/3.595.84.246.524.659/fig-relationship-wavelength-frequency-sound.webp)