0095-1137/97/$04.00
1
0
Copyright
q
1997, American Society for Microbiology
Rapid Susceptibility Testing of Candida albicans by Flow Cytometry
SCOTT M. KIRK,
1,2STEVEN M. CALLISTER,
3LONY C. L. LIM,
1,2,4ANDRONALD F. SCHELL
1,2,4,5*
Wisconsin State Laboratory of Hygiene
1and Departments of Medical Microbiology and Immunology,
2Bacteriology,
4and Preventive Medicine,
5University of Wisconsin, Madison, Wisconsin 53706, and Microbiology
Research Laboratory, Gundersen Medical Foundation, La Crosse, Wisconsin 54601
3Received 22 May 1996/Returned for modification 26 September 1996/Accepted 26 October 1996
The emerging magnitude of human fungal infections has renewed interest in developing rapid and
stan-dardized methods for susceptibility testing. We demonstrated that susceptibility testing of
Candida albicans
can
be accomplished rapidly by using flow cytometry. Test results were available within 8 to 24 h after
C. albicans
isolates were incubated with amphotericin B, itraconazole, and flucytosine. This is an improvement of 24 to
60 h in the time to availability of susceptibility test results compared to the time to availability of National
Committee for Clinical Laboratory Standards-recommended broth macrodilution test results. In addition, the
flow cytometric endpoints, mean channel fluorescence, and number of fluorescence-labeled
C. albicans
cells
were easy to interpret for greater sensitivity and reliability. Flow cytometry provides a more accurate means of
obtaining antifungal susceptibility test results.
The incidence of severe fungal infections has steadily
in-creased during the last five decades with the advent of
broad-spectrum antibacterial agents and more aggressive
chemother-apies (5, 11). Furthermore, fungal infections have become a
major cause of mortality among the growing group of
immu-nocompromised patients, especially those with AIDS (11, 31,
37). Even more disturbing are the frequent reports that fungi
are developing resistance to antifungal agents (4, 14, 21, 26, 32,
33, 37, 38). This has facilitated efforts to develop a more
reli-able in vitro susceptibility test to predict clinical outcome.
The National Committee for Clinical Laboratory Standards
(NCCLS) Subcommittee on Antifungal Susceptibility Testing
has developed guidelines for performing a reproducible
meth-od for broth dilution susceptibility testing of yeast (22). The
method uses semisynthetic RPMI 1640 medium at pH 7.0 with
a spectrophotometrically standardized inoculum and fixed
in-cubation and endpoint criteria (22). The method, however, is
labor-intensive, requires incubation for 48 or 72 h, and relies
on visual assessment of growth inhibition. More recently, other
methods including the Etest (32), the Bioscreen microdilution
method (36, 39), and a colorimetric test (8) have been shown
to be valuable alternatives to the NCCLS reference method.
Collectively, these methods have substantially improved the
clinical utility of in vitro susceptibility testing of antifungal
agents.
Another approach for performing antifungal susceptibility
testing involves the use of flow cytometry (13, 24, 27–30). In
this report, we present evidence that flow cytometry can be
used to detect rapidly the susceptibility of Candida albicans to
several antifungal agents including amphotericin B (AMB),
flucytosine (5-FC), and itraconazole (ITR). Results were
avail-able within 8 to 24 h after the initiation of testing and did not
involve complicated steps for avoiding quenching of
fluores-cence (24) or sustained incubation periods with impermeant or
permeant dyes (24, 27). In addition, several parameters of flow
cytometric analysis could be used reliably to predict the results
of susceptibility testing.
MATERIALS AND METHODS
Antifungal agents.AMB, 5-FC, and ITR were obtained from Sigma, St. Louis, Mo.; United States Pharmaceutical Company, Inc., Rockville, Md.; and Re-search Diagnostics, Inc., Flanders, N.J., respectively. A stock solution of AMB was prepared with 100% dimethyl sulfoxide (Sigma) at 4,000mg/ml, while a stock solution of ITR was prepared in polyethylene glycol 400 (Sigma) at 5,000mg/ml. Subsequently, the stock solutions were diluted with RPMI 1640 medium con-tainingL-glutamine and 0.165 M morpholinepropanesulfonic acid without so-dium bicarbonate (American Biorganics, Inc., North Tonawanda, N.Y.) to con-centrations of 1,280 and 1,600mg/ml AMB and ITR, respectively. The stock solutions were then frozen in 0.5-ml aliquots at2708C. A stock solution of 5-FC was prepared with sterile distilled water to a concentration of 2,000mg/ml before being diluted with RPMI 1640 medium to a concentration of 640mg/ml and frozen in 4.0-ml aliquots at2708C.
Yeast and yeast preparation.C. albicans ATCC 90028 was obtained from the
American Type Culture Collection (Rockville, Md.). Other isolates of C.
albi-cans, C. (Torulopsis) glabrata, C. tropicalis, C. parapsilosis, C. krusei, and C. lusitaniae were obtained from Kenneth V. I. Rolston, M. D. Anderson Cancer
Center, Houston, Tex. The strains were grown in 10 ml of brain heart infusion broth (Difco, Detroit, Mich.) at 358C for approximately 18 h or until the turbidity of the suspensions was equivalent to that of a McFarland no. 1 standard. Each suspension was then diluted twofold with brain heart infusion broth containing 20% glycerol (Sigma), dispensed into 1.5 ml screw-cap tubes (Sarstedt, Newton, N.C.), sealed, and stored at2208C.
Dyes.Acridine orange (AO), ethidium bromide (EB), and fluorescein diac-etate (FDA) were obtained from Sigma. Stock solutions of AO, EB, and FDA were prepared according to the instructions of the manufacturer to yield con-centrations of 20, 2, and 5 mg/ml, respectively. The stock solutions were then filter sterilized through a 0.22-mm-pore-size filter apparatus (Arcodisc; Gelman Sciences, Ann Arbor, Mich.) and diluted with phosphate-buffered saline (pH 7.4). The stock solutions were used to prepare fresh concentrations of dyes before each testing procedure. In preliminary studies the dyes were titrated to determine the concentration of each dye that would most effectively stain the yeast. The final concentrations were 8mg/ml for AO, 4mg/ml for EB, and 1.8 mg/ml for FDA.
Antifungal susceptibility testing.Broth macrodilution MICs were determined by the NCCLS M27-P methodology (22). Briefly, serial twofold dilutions of the antifungal agents were prepared with RPMI 1640 medium. The final concentra-tions of the antifungal agents ranged from 12.8 to 0.025mg/ml for AMB, 64 to 0.125mg/ml for 5-FC, and 16 to 0.03mg/ml for ITR. The suspensions containing antifungal agents were then inoculated with 0.53104to 2.53104cells per ml
and incubated in air at 358C for 48 h. The MIC endpoint was the lowest concentration of antifungal agent that completely inhibited growth (AMB) or that produced an 80% reduction of turbidity (5-FC and ITR) when compared with that of the drug-free control.
Antifungal susceptibility testing by flow cytometry.Broth macrodilutions were prepared as recommended by NCCLS (22), except that the final inoculum of C.
albicans was 1 3105 to 53105cells per ml. The suspensions containing
antifungal agents and C. albicans were then incubated at 358C for 8 and 24 h before analysis by flow cytometry.
Acquisition of flow cytometric data.After incubation of the assay suspensions for 8 and 24 h, 100ml was removed and diluted with 400ml of phosphate-buffered saline (pH 7.4), and 50ml of AO, EB, or FDA was added. The samples were then
* Corresponding author. Mailing address: Wisconsin State
Labora-tory of Hygiene, 465 Henry Mall, Madison, WI 53706. Phone: (608)
262-3634. Fax: (608) 265-3451.
358
on May 15, 2020 by guest
http://jcm.asm.org/
inoculated with each dye at ambient temperature for approximately 5 min before being analyzed with a Bryte HS flow cytometer (Bio-Rad, Hercules, Calif.) with WinBryte software or a FACScan flow cytometer (Becton Dickinson Immuno-cytometry Systems, Mountain View, Calif.) with FACScan Lysys II software for data acquisition and analysis. Initially, viable and heat-killed C. albicans organ-isms were detected and differentiated in RPMI 1640 medium by using forward scatter, side scatter, and AO, EB, and FDA fluorescence. Live gating was per-formed on profiles of C. albicans during data acquisition to exclude all particles in RPMI 1640 medium. In addition, calibration beads were tested daily, and the mean channel fluorescence did not vary by more than six channels. Controls included samples containing viable, heat-killed, and AMB-killed C. albicans in RPMI 1640 medium. Data were acquired for 120 s or until 5,000 counts from gated events were obtained.
Flow cytometric statistical analysis.Samples were analyzed by using the his-togram profiles of AO, EB, and FDA fluorescence by using FACScan Lysys II or WinBryte software. Gates were established for viable and heat-killed C. albicans on the basis of their reactions with AO, EB, and FDA. Two parameters were
evaluated: events per minute (number of labeled C. albicans organisms) and mean channel fluorescence (intensity of fluorescence-labeled C. albicans). These values were obtained as part of the flow cytometric statistical analysis and were dependent upon the establishment of gates for live and heat-killed C. albicans. In addition, samples were analyzed by two-dimensional contour plot profiles of side-angle light scatter versus AO fluorescence by using the flow cytometric softwares. Contour plots were used for their ability to represent populations of
C. albicans organisms.
Statistics.The values obtained were tested by analysis of variance. The alpha level was set at 0.05 before the experiments were started.
RESULTS
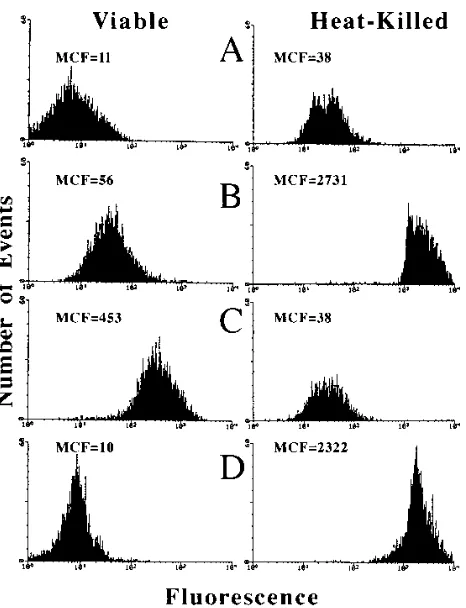
Detection of
C. albicans
by flow cytometry.
Initially, viable
and heat-killed C. albicans organisms were stained with AO,
EB, or FDA (Fig. 1). Nonstained viable and heat-killed C.
albicans organisms were readily detected in RPMI 1640
me-dium, with mean channel fluorescences of 11 and 38,
respec-tively (Fig. 1A). When viable and heat-killed C. albicans
or-ganisms were stained with FDA (Fig. 1C), only viable C.
albicans organisms demonstrated a significant (P
,
0.001)
flu-orescence intensity, with a mean channel fluflu-orescence of 453.
Both AO (Fig. 1B) and EB (Fig. 1D) stained heat-killed C.
albicans organisms, with mean channel fluorescences of 2,731
and 2,322, respectively. AO also weakly stained viable C.
albi-cans, with a mean channel fluorescence of 56. When these
experiments were repeated with other isolates of C. albicans,
C. glabrata, C. tropicalis, C. parapsilosis, C. krusei, and C.
lus-itaniae, similar results were obtained. By contrast, EB failed to
stain viable C. albicans organisms. All subsequent experiments,
however, used AO because it stained both viable and
heat-killed Candida organisms. The ability of AO to stain weakly
isolates of C. albicans and other species of Candida made
initial detection of the yeasts by flow cytometry relatively easy.
In addition, maximum separation between viable and
heat-killed organisms by using intensity of fluorescence (mean
chan-nel fluorescence) was obtained with AO (Fig. 1C). When these
experiments were repeated three times, similar results were
obtained.
Establishment of gates (regions) for detection of viable and
killed
C. albicans.
The purpose of establishing gates was to
establish regions R2 and R3 for detection of viable and
heat-killed C. albicans organisms (Fig. 2). Viable (Fig. 2B) and
heat-killed (Fig. 2C) organisms were easily detected within
regions R2 and R3, respectively. Region R2 was drawn to
contain 95% of the viable C. albicans organisms (Fig. 2B).
Subsequently, the C. albicans organisms were exposed to
con-centrations of antifungal agents that killed C. albicans (no
growth on subculture). Approximately 96, 99, and 65% of the
organisms were detected in region R3 after exposure to AMB,
FIG. 1. Histogram profiles of mean channel fluorescence (MCF) values forviable and heat-killed C. albicans in RPMI 1640 medium unstained (A) or in the presence of AO (B), FDA (C), or EB (D).
FIG. 2. AO fluorescence versus side-scatter contour plot profiles of RPMI 1640 medium with AO (A), RPMI 1640 medium with AO-labeled viable C. albicans (B), and RPMI 1640 medium with AO-labeled heat-killed C. albicans (C). The AO-labeled viable C. albicans organisms were used to draw the R2 region to include greater than 95% viable cells. AO-labeled heat-killed C. albicans organisms were used to draw the R3 region. The R2 and R3 regions were also based upon changes in mean channel fluorescence and side scatter obtained with the AO-labeled viable and AO-labeled heat-killed C. albicans. Region R1 was subdivided into regions R2 and R3.
on May 15, 2020 by guest
http://jcm.asm.org/
[image:2.612.64.297.67.371.2]ITR, and 5-FC, respectively (Fig. 3). These results were
repli-cated.
Determination of the susceptibility of
C. albicans
to
antifun-gal agents by flow cytometry.
Figure 4 indicates the percentage
of AO-labeled C. albicans organisms detected in regions R2
and R3 with or without exposure to various concentrations of
AMB for 24 h. The percentage of AO-labeled C. albicans
organisms detected in region R3 increased rapidly after
expo-sure of C. albicans to 0.4
m
g or more of AMB per ml.
Approx-imately, 13% of the C. albicans organisms were detected in
region R3 after exposure to 0.4
m
g of AMB per ml. Exposure
of C. albicans to 12.8
m
g of AMB per ml resulted in
approxi-mately 99% of the organisms being intensively labeled with
AO in region R3. Similar results were obtained when the C.
albicans organisms were exposed to various concentrations of
AMB for only 8 h. The MIC of AMB for C. albicans
deter-mined by the NCCLS broth macrodilution test was 0.8
m
g/ml.
We also determined the effects of various concentrations of
5-FC and ITR on the percentage of AO-labeled C. albicans
detected in region R3 after incubation for 8 and 24 h. The
percentage of AO-labeled C. albicans increased rapidly from
31 to 87% after exposure to ITR at 0.25
m
g/ml and a final
concentration of 16
m
g of ITR per ml after 8 h of incubation.
These results remained consistent even after incubation of C.
albicans with ITR for 24 h. The MIC of ITR detected by the
broth macrodilution method was 0.5
m
g/ml. By contrast, the
percentage of AO-labeled C. albicans organisms detected in
region R3 after exposure to 5-FC could not be consistently
determined without an incubation period of 24 h. At that time,
the proportion of AO-labeled C. albicans organisms increased
from 24 to 77% after exposure to 0.125 and 64
m
g of 5-FC per
ml, respectively. The MIC by the broth macrodilution method
was 2
m
g/ml.
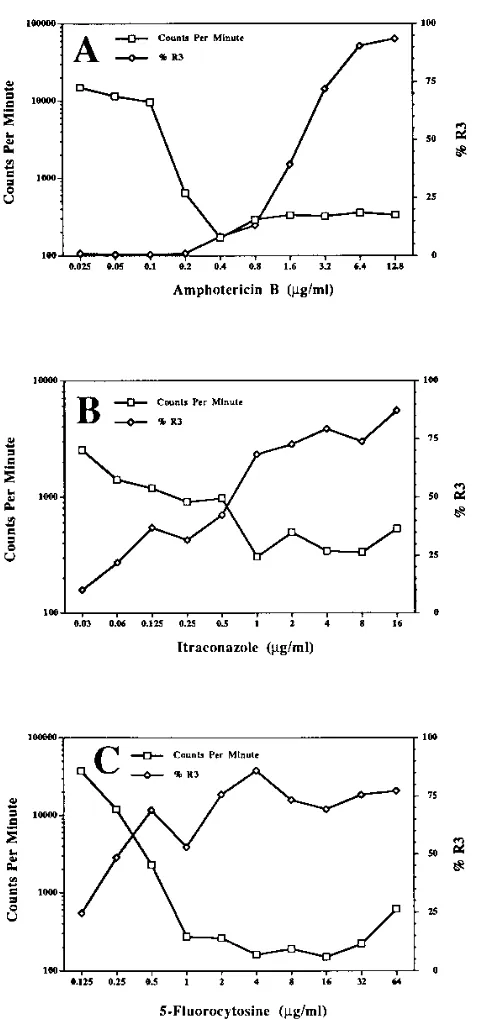
The results presented in Fig. 5 indicate that the percentage
of AO-labeled C. albicans organisms detected in region R3
correlated inversely with the number of events (C. albicans)
detected by flow cytometry. In general, the percentage of
AO-labeled C. albicans organisms detected in region R3 increased
rapidly with increasing concentrations of the antifungal agents,
while the number of C. albicans organisms (events) rapidly
decreased. The point of intersection of these curves closely
approximated the MICs of AMB, 5-FC, and ITR obtained by
the broth macrodilution method. The data in Table 1 indicate
that the MICs predicted by flow cytometry were equal to or
were within 2 dilutions of the MICs determined by the broth
macrodilution method. Most importantly, the flow cytometric
MICs were obtained 24 to 32 h sooner than the MICs obtained
by the NCCLS broth macrodilution standard test.
FIG. 3. AO fluorescence versus side-scatter contour plot profiles of viable C. albicans (A) and C. albicans exposed to concentrations of AMB (B), ITR (C), and 5-FC (D) that killed C. albicans. Region R3 contained 96, 99, and 65% C. albicans organisms after exposure to AMB, ITR, and 5-FC, respectively. Region R1 was subdivided into regions R2 and R3.
FIG. 4. AO fluorescence versus side scatter contour plot profiles of viable
C. albicans, heat-killed C. albicans, and C. albicans exposed to various
concen-trations of AMB for 24 h. The results indicate the transition of C. albicans organisms from the R2 region (viable) to the R3 region (dead) with exposure to increasing concentrations of AMB.
on May 15, 2020 by guest
http://jcm.asm.org/
[image:3.612.326.542.216.684.2]DISCUSSION
A standardized method for performing in vitro susceptibility
testing of fungal agents, especially Candida spp., has been
proposed by NCCLS (22). The proposed method is a broth
macrodilution test that has demonstrated good inter- and
in-tralaboratory reproducibilities (9). However, the standardized
method is labor-intensive and cumbersome to perform, and
endpoints are difficult to determine, especially for antifungal
agents other than AMB. Another disadvantage is that
incuba-tion periods of 48 to 72 h is required for determinaincuba-tion of the
in vitro antifungal susceptibility test results. Although
stan-dardization is important, investigators (7, 12) have stressed the
need for the development of simplified methods to improve
the likelihood of use of antifungal susceptibility testing by
clinical laboratories.
Recently, there has been a proliferation of reports
promul-gating the advantages of flow cytometry for performing
sus-ceptibility testing of yeast and bacteria (2, 10, 13, 18, 19, 24, 25,
27–30, 34, 35). Flow cytometry simultaneously measures
qual-itative and quantqual-itative characteristics of individual cells in a
heterogeneous population of microorganisms by movement of
cells past optical or electronic sensors. Individual cells can be
rapidly and precisely detected, counted, characterized, and
identified. In addition, flow cytometry has been used to
deter-mine the viability of microorganisms by measuring uptake of
fluorochrome dyes (6, 10, 13, 15, 16, 18, 20, 24, 25, 34). This
latter feature has encouraged evaluations of flow cytometry as
an alternate approach to performing susceptibility testing (1, 2,
10, 18, 23–25, 27).
In this report, we showed that susceptibility testing of C.
albicans could be accomplished rapidly by using flow
cytom-etry. Test results were readily available within 8 h after C.
albicans organisms were incubated with the antifungal agents
AMB and ITR. Furthermore, susceptibility results for 5-FC
were obtainable within 24 h after the initiation of testing. This
was an improvement of 24 to 32 h in the time to the availability
of susceptibility test results compared with the time to
avail-ability of those obtained by the NCCLS-recommended broth
macrodilution method (22). In addition, the flow cytometric
endpoints, mean channel fluorescence (intensity of
fluores-cence-labeled organisms), and number of events (number of C.
albicans organisms) were easy to interpret for greater
sensitiv-ity and reliabilsensitiv-ity. Frequently, the endpoints obtained by the
broth dilution method are difficult to interpret. The assay tubes
show partial inhibition of fungal growth or produce a trailing
phenomenon, especially with ITR.
These results confirmed and extended the findings of
O’Gorman and Hopfer (24). Our assay system, however, did
not require steps for removal of antifungal agents. O’Gorman
and Hopfer (24) showed that AMB had to be removed from
suspensions of C. albicans prior to analysis by flow cytometry
to prevent quenching of fluorescence-labeled yeast. In our
assay system AO was used to detect nonviable yeast, while
O’Gorman and Hopfer (24) used EB. This difference in
detec-tion dyes may account for our inability to detect quenching of
fluorescence-labeled yeast when suspensions of C. albicans
were exposed to antifungal agents, labeled with AO, and
ana-lyzed by flow cytometry. In addition, our assay system did not
require long periods of incubation with the detection dye
be-fore analysis by flow cytometry. By contrast, O’Gorman and
FIG. 5. Effects of various concentrations of AMB (A), ITR (B), and 5-FC (C)on the percentage of C. albicans organisms detected in the R3 region and on the number of yeast cells detected per minute by flow cytometry. Results were obtained after 8 h of incubation with AMB and ITR and 24 h with 5-FC. The MICs obtained by flow cytometry were 0.4, 0.5, and 0.5mg/ml for AMB, ITR, and 5-FC, respectively. These values were obtained by flow cytometry with a 10-fold greater inoculum than that recommended by NCCLS for the standard broth
method.
TABLE 1. MICs of AMB, ITR, and 5-FC for C. albicans and
duration of incubation for detection by flow cytometry
and the NCCLS broth macrodilution test
Antifungal agent
Flow cytometry NCCLS test
MIC (mg/ml) Time (h) MIC (mg/ml) Time (h)
AMB
0.4
8
0.8
48
ITR
0.5
8
0.5
48
5-FC
0.5
24
2.0
48
on May 15, 2020 by guest
http://jcm.asm.org/
[image:4.612.60.300.63.573.2]Hopfer (24) showed that 4 h of incubation with EB was
re-quired to label yeast for detection of susceptibility to AMB by
flow cytometry. We found that AO weakly labeled viable C.
albicans and intensively labeled heat-killed and antifungal
agent-treated C. albicans within minutes (
,
5 min) of exposure
to AO. This finding is important because it also reduces the
potential for dye-induced toxic effects that could influence the
susceptibility test results (27).
Our results also indicated that the MICs of AMB and ITR
obtained by flow cytometry agreed with those obtained by the
NCCLS broth macrodilution test. Despite a 10-fold increase in
inoculum, the MICs of AMB and ITR obtained by flow
cytom-etry were equal to or within a dilution of those obtained by the
NCCLS standard test. By contrast, the MIC of 5-FC for C.
albicans obtained by flow cytometry was fourfold lower (0.5
m
g/ml) than the MIC (2.0
m
g/ml) obtained by the broth
mac-rodilution test. In general, the MICs obtained by flow
cytom-etry should be lower than those obtained by conventional
methods. The flow cytometer can differentiate within hours
viable and nonviable microorganisms exposed to antifungal
agents. An operational definition of susceptibility that
distin-guishes between viable and nonviable yeast by using mean
channel fluorescence (percentage shift into region R3) or the
number of yeast cells (events) in the suspensions with or
with-out exposure to antifungal agents can readily be established.
The broth macrodilution test, however, depends on
visualiza-tion of growth of C. albicans after 48 h of incubavisualiza-tion for
determination of the MIC. As the concentration of the
anti-fungal agent decreases by deterioration during the 48-h
incu-bation period, the surviving yeast would multiply to produce
MIC endpoints higher than those obtained by flow cytometry.
The endpoints for each of the antifungal agents now needs to
be established with a large number of fresh clinical isolates of
C. albicans and Candida species.
Besides rapid detection time, another advantage of using
flow cytometry for the assessment of susceptibility test results
is its ability to distinguish between viable and nonviable
organ-isms. We (1, 17, 23) and others (2, 3, 6, 10, 13, 15, 16, 18, 20,
24, 25, 27–30, 34, 35) have shown that uptake of permeant and
impermeant dyes by microorganisms correlates with
nonviabil-ity due to treatment with heat or antimicrobial agents.
Al-though conventional MIC procedures are widely used, they
were established for the convenience of interpretation by busy
clinical microbiology laboratories. The minimal fungicidal
con-centration may be a more meaningful and useful measure for
assessing resistance or susceptibility results. In addition, larger
inocula can be evaluated by flow cytometry, which increases
the chances that the assay system can find resistant yeast by
detecting large numbers of unstained cells. Technical
prob-lems, however, have generally limited usage of the minimal
fungicidal concentrations to specialized infectious diseases
lab-oratories. Flow cytometry offers the advantage of determining
the minimal fungicidal concentrations within hours of the
ini-tiation of testing. It is hoped that these studies will improve the
correlation between in vitro fungal susceptibility test results
and prediction of clinical outcome.
In conclusion, we have shown that flow cytometry with AO
staining of yeast shows considerable promise as a rapid method
for obtaining susceptibility test results. The assay can be
com-pleted within 8 to 24 h of the initiation of testing.
ACKNOWLEDGMENTS
We thank the Gundersen Medical Foundation, Inc., La Crosse,
Wis., for providing the flow cytometer and other support. We greatly
appreciate the support of Adolf L. Gundersen.
REFERENCES
1. Bownds, S. E., T. A. Kurzynski, M. A. Norden, J. L. DuFek, and R. F. Schell. 1996. Rapid susceptibility testing for nontuberculosis mycobacteria using flow cytometry. J. Clin. Microbiol. 34:1386–1390.
2. Boye, E., H. B. Steen, and K. Skarstad. 1983. Flow cytometry of bacteria: a promising tool in experimental and clinical microbiology. J. Gen. Microbiol. 129:973–980.
3. Darzynkiewicz, Z., and J. Kapuscinski. 1990. Acridine orange: a versatile probe of nucleic acids and other cell constituents, p. 291–314. In M. A. Melamed, T. Lindmo, and M. L. Mendelsohn (ed.), Flow cytometry and sorting, 2nd ed. Wiley-Liss, Inc., New York, N.Y.
4. Dick, J. D., W. G. Merz, and R. Saral. 1980. Incidence of polyene-resistant yeasts recovered from clinical specimens. Antimicrob. Agents Chemother. 18:158–163.
5. Diamond, R. D. 1991. The growing problem of mycoses in patients with the human immunodeficiency virus. Rev. Infect. Dis. 13:480–486.
6. Diaper, J. P., K. Tither, and C. Edwards. 1992. Rapid assessment of bacterial viability by flow cytometry. Appl. Microbiol. Biotechnol. 38:268–272. 7. Espinel-Ingroff, A., M. Pfaller, M. E. Erwin, and R. N. Jones. 1996. An
interlaboratory evaluation of E-test method for testing antifungal suscepti-bilities of pathogenic yeasts to five antifungal agents by using Casitone agar and solidified RPMI 1640 medium with 2% glucose. J. Clin. Microbiol. 34:848–852.
8. Espinel-Ingroff, A., J. L. Rodrigues-Tudela, and J. V. Martinez-Suarez. 1995. Comparison of two alternative microdilution procedures with the National Committee for Clinical Laboratory Standards reference macrodilution method M27-P for in vitro testing of fluconazole-resistant and -susceptible isolates of Candida albicans. J. Clin. Microbiol. 33:3154–3158.
9. Fromtling, R. A., J. N. Galgiani, M. A. Pfaller, A. Espinel-Ingroff, K. F. Bartizal, M. S. Bartlett, B. A. Body, C. Frey, G. Hall, G. D. Roberts, F. B. Nolte, F. C. Odds, M. G. Rinaldi, A. M. Sugar, and K. Villareal.1993. Multicenter evaluation of a macrobroth antifungal susceptibility test for yeasts. Antimicrob. Agents Chemother. 37:39–45.
10. Gant, V. A., G. Warnes, I. Phillips, and G. F. Savidge. 1993. The application of flow cytometry to the study of bacterial responses to antibiotics. J. Med. Microbiol. 39:147–154.
11. Georgopapadakou, N. H., and J. S. Tkacz. 1995. The fungal cell wall as a drug target. Trends Microbiol. 3:98–104.
12. Ghannoum, M. A., J. H. Rex, and J. N. Galgiani. 1996. Susceptibility testing of fungi: current status of correlation of in vitro data with clinical outcome. J. Clin. Microbiol. 34:489–495.
13. Green, L., B. Petersen, L. Steimel, P. Haeber, and W. Current. 1994. Rapid determination of antifungal activity by flow cytometry. J. Clin. Microbiol. 32:1088–1091.
14. Guinet, R., J. Chanas, A. Goullier, G. Bonnefoy, and P. Ambroise-Thomas. 1983. Fatal septicemia due to amphotericin B-resistant Candida lusitaniae. J. Clin. Microbiol. 18:443–444.
15. Jernaes, M. W., and H. B. Steen. 1994. Staining of Escherichia coli for flow cytometry: influx and efflux of ethidium bromide. Cytometry 17:302–309. 16. Kaprelyants, A. S., and D. B. Kell. 1992. Rapid assessment of bacterial
viability and vitality by rhodamine 123 and flow cytometry. J. Appl. Bacteriol. 72:410–422.
17. Lim, L. C. L., Y. F. Liu, K. Schell, S. D. Lovrich, S. M. Callister, and R. F. Schell.1994. Detection of borreliacidal antibody by using acridine orange and flow cytometry. Clin. Diagn. Lab. Immunol. 1:44–50.
18. Mason, D. J., R. Allman, J. M. Stark, and D. Lloyd. 1994. Rapid estimation of bacterial antibiotic susceptibility with flow cytometry. J. Microsc. 176:8– 16.
19. Mason, D. J., and V. A. Gant. 1995. Correspondence. J. Antimicrob. Che-mother. 36:441–443.
20. Mason, D. J., R. Lopez-Amoros, R. Allman, J. M. Stark, and D. Lloyd. 1995. The ability of membrane potential dyes and calcafluor white to distinguish between viable and non-viable bacteria. J. Appl. Bacteriol. 78:309–315. 21. Merz, W. G. 1984. Candida lusitaniae: frequency of recovery, colonization,
infection, and amphotericin B resistance. J. Clin. Microbiol. 20:1194–1195. 22. National Committee for Clinical Laboratory Standards. 1992. Reference method for broth dilution antifungal susceptibility testing of yeasts: proposed standard. NCCLS documant M27-P. National Committee for Clinical Lab-oratory Standards, Villanova, Pa.
23. Norden, M. A., T. A. Kurzynski, S. E. Bownds, S. M. Callister, and R. F. Schell. 1995. Rapid susceptibility testing of Mycobacterium tuberculosis (H37Ra) by flow cytometry. J. Clin. Microbiol. 33:1231–1237.
24. O’Gorman, M. R. G., and R. L. Hopfer. 1991. Amphotericin B susceptibility testing of Candida species by flow cytometry. Cytometry 12:743–747. 25. Ordonez, J. V., and N. M. Wehman. 1993. Rapid flow cytometric antibiotic
susceptibility assay for Staphylococcus aureus. Cytometry 14:811–818. 26. Polak, A., and P. G. Hartman. 1991. Antifungal chemotherapy—are we
winning? Prog. Drug Res. 37:181–269.
27. Pore, R. S. 1994. Antibiotic susceptibility testing by flow cytometry. J. Anti-microb. Chemother. 34:613–627.
28. Pore, R. S. 1992. Amphotericin B synergy testing by the FCST. Curr. Mi-crobiol. 24:171–177.
on May 15, 2020 by guest
http://jcm.asm.org/
29. Pore, R. S. 1991. Ketoconazole susceptibility of yeasts by the FCST method. Curr. Microbiol. 23:45–50.
30. Pore, R. S. 1990. Antibiotic susceptibility testing of Candida albicans by flow cytometry. Curr. Microbiol. 20:323–328.
31. Rex, J. H., M. A. Pfaller, M. G. Rinaldi, A. Polak, and J. N. Galgiani. 1993. Antifungal susceptibility testing. Clin. Microbiol. Rev. 6:367–381. 32. Rex, J. H., M. G. Rinaldi, and M. A. Pfaller. 1995. Resistance of Candida
species to fluconazole. Antimicrob. Agents Chemother. 39:1–8.
33. Scholer, H. 1980. Antifungal chemotherapy, p. 35–106. In D. C. E. Speller, (ed.). John Wiley & Sons, Inc., New York, N.Y.
34. Shapiro, H. M. 1990. Flow cytometry in laboratory microbiology: new direc-tions. ASM News 56:584–588.
35. Steen, H. B., K. Skarstad, and E. Boye. 1986. Flow cytometry of bacteria: cell cycle kinetics and effects of antibiotics. Ann. N. Y. Acad. Sci. 486:329–338.
36. To, W-K, A. W. Fothergill, and M. G. Rinaldi. 1995. Comparative evaluation of macrodilution and Alamar colorimetric microdilution broth methods for antifungal susceptibility testing of yeast isolates. J. Clin. Microbiol. 33:2660– 2664.
37. Vanden Bossche, H., P. Marichal, and F. C. Odds. 1994. Molecular mech-anisms of drug resistance in fungi. Trends Microbiol. 2:393–400. 38. Vanden Bossche, H., G. Willemsens, and P. Marichal. 1987. Anti-Candida
drugs—the biochemical basis for their activity. Crit. Rev. Microbiol. 15:57– 72.
39. Van Eldere, J., L. Joosten, A. Verhaeghe, and I. Surmont. 1996. Fluconazole and amphotericin B antifungal susceptibility testing by National Committee for Clinical Laboratory Standards broth macrodilution method compared with E-test and semiautomated broth microdilution test. J. Clin. Microbiol. 34:842–847.