0095-1137/96/$04.0010
Copyrightq1996, American Society for Microbiology
Surveillance of Community-Acquired Viral Infections Due
to Respiratory Viruses in Rhone-Alpes (France)
during Winter 1994 to 1995
BRUNO LINA,1* MARTINE VALETTE,1SOPHIE FORAY,1JACQUES LUCIANI,2JEAN STAGNARA,2
DARRYL M. SEE,1ANDMICHELE AYMARD1
Laboratoire de Virologie, Centre National de Refe´rence de la Grippe-France Sud,1Domaine Rockefeller, Faculte´ de
Me´decine Lyon Grange Blanche,1and Re´seau de Surveillance Groupe Regional d’Observation de la Grippe,
Laboratoire de Virologie, Domaine Rockefeller,269373 Lyon Cedex 08, France
Received 19 March 1996/Returned for modification 7 May 1996/Accepted 5 September 1996
Nasal swab samples from patients with acute flu-like illness were evaluated for the presence of respiratory viruses in the Rhone-Alpes region of France from 1 October 1994 through 2 May 1995. The relative frequencies and seasonal distributions of the specific viruses were assessed. In addition, virus type was correlated with specific clinical signs and symptoms. During the study, 962 samples were collected by 75 medical practitioners participating in the Groupe Regional d’Observation de la Grippe surveillance network. One or more viruses were detected from 348 samples (36.1%), including 108 respiratory syncytial virus (RSV), 64 influenza virus A type H3N2, 47 influenza virus B, 64 coronavirus, 35 rhinovirus, 22 adenovirus, 5 enterovirus, and 3 parain-fluenza strains. There were 16 mixed infections. RSV infections peaked in the early winter, and inparain-fluenza viruses A and B infections peaked during the late winter and early spring. There were two peaks of coronavirus infections (late fall and late winter). Other viruses were detected at lower levels throughout the study period.
Patients from whom adenovirus was isolated were significantly more likely to have a fever of >39.5&C than were
patients with other detectable viruses (P< 0.001). Furthermore, there was a significant correlation between
influenza and cough (P< 0.01) and RSV and bronchiolitis (P< .001). Thus, the current study defined the
overall and relative frequencies of respiratory virus detection from nasal swab specimens in patients with an acute flu-like illness in the Rhone-Alpes region of France during a 7-month period. Correlation with clinical signs and symptoms and provisional conclusions regarding seasonality were also determined.
Influenza viruses are highly contagious and are responsible each year for local, regional, or worldwide epidemics with various degrees of severity (2, 8, 10, 28). The Groupe Re´gional d’Observation de la Grippe (GROG) in the Rhone-Alpes re-gion of France was organized 9 years ago according to World Health Organization guidelines to detect and monitor the emergence of influenza virus outbreaks each year. This Rhone-Alpes GROG network is part of the French World Health Organization influenza network. It comprises volunteer gen-eral practitioners and pediatricians practicing throughout the region. Nasal swab specimens are collected from patients with clinical presentations suggestive of influenza during the appro-priate season (2, 13, 23), sent to the laboratory, and analyzed for the presence of influenza viruses. Each year since 1987, this clinician-reference laboratory surveillance system has success-fully detected the onset of influenza epidemics and has iden-tified specific strains. This kind of network could also be used as a virological surveillance system for other community-ac-quired viral infections (10, 11, 18). Clinical information could be correlated with virus detection, providing the means of determining associations between clinical signs and symptoms and specific infections.
The relationship between clinical symptoms and respiratory virus infections is unclear (3, 11, 14, 15). Conflicting results about influenza virus A and B disease have been reported, with some suggesting that differences in clinical presentation could
be observed, while others observed no difference. It was also reported that respiratory syncytial virus (RSV) could be con-fused clinically with influenza virus (8, 14). Virus surveillance combined with the collection of clinical information about patients presenting with an influenza-like illness may be help-ful in determining correlations between viral diseases and clin-ical features. Moreover, the knowledge of both the epidemic status and the clinical symptoms observed in infected patients may help clinicians in the presumptive diagnosis of respiratory viral infections.
The goals of the present study were fourfold: (i) to identify viruses responsible for winter flu-like illness, (ii) to determine their relative prevalence and seasonality, (iii) to identify virus-specific clinical syndromes, and (iv) ultimately, to use this com-bined information for timely, specific antiviral therapy, prophy-laxis, and vaccination (6, 16, 19, 21, 25, 31).
MATERIALS AND METHODS
Nasal swabs samples from patients.Seventy-five volunteer general practitio-ners and pediatricians (55 and 20, respectively) located in different areas of the Rhone-Alpes region of France (some in large towns such as Lyon, Saint Etienne, or Grenoble [24%] and others in small towns [43%] or in the country [33%]) were included in the network and performed the sampling. The study period began on 1 October 1994 (week 38 of the year) and concluded on 2 May 1995 (week 18 of the year).
A total of 962 nasal swabs were sent to the Virology Reference Laboratory in Lyon (average, 29.15 per week; range, 1 to 64 per week). All physicians in the network contributed at least 1 swab (mean, 12.8 swabs; range, 1 to 74 swabs). There was an equal distribution of samples throughout the region in terms of the number of samples per unit population. Some samples were hand carried to the laboratory (at room temperature) and some were sent to the laboratory by mail. Samples on Virocult swabs were mailed in transport medium (17) in order to ensure the viability of the viruses.
The only criterion for enrollment of a swab from a patient was the presence of
* Corresponding author. Mailing address: Laboratoire de Virologie, Domaine Rockefeller, 8, avenue Rockefeller, 69373 Lyon Cedex 08, France. Phone: (33) 78 77 70 29. Fax: (33) 78 01 48 87. Electronic mail address: lina@cismsun.univ-lyon1.fr.
3007
on May 15, 2020 by guest
http://jcm.asm.org/
an acute influenza-like illness. Each swab was obtained within 48 h of onset of the illness, according to the judgment and convenience of the physician. The spec-imens were sent with a completed, standardized form containing patient demo-graphics, time of onset of symptoms, reported symptoms, physical findings, the presence of other, similar cases of illness in the family or in contact persons, and influenza vaccination status. The maximum temperature was recorded as the highest temperature found by either patient history or a single observation by the physician. Bronchiolitis was diagnosed by the presence of characteristic findings on pulmonary auscultation.
Viral detection or isolation. Detection and/or isolation of influenza virus (A/H1N1, A/H3N2, and B) and parainfluenza I, II, and III viruses, RSV, ade-novirus (ADV), rhiade-novirus, coronavirus, and enteroviruses (coxsackievirus and echovirus) were systematically performed for each swab.
The samples were processed as described previously (3). Briefly, when the swabs arrived in the laboratory, they were removed from the transport tube, their contents were expressed and broken up in a sterile glass tube containing 2.5 ml of Eagle’s minimum elementary medium (Biowhittaker, Verviers, Belgium), and the transport medium was then added. The tube was vigorously agitated with a vortex mixer, and then 0.3 ml of a solution containing 200,000 U of penicillin G per ml and 200 mg of streptomycin per ml was added. This suspension was then used immediately or was refrigerated for a maximum of 48 h prior to viral detection by culture and/or the procedures described below.
(i) Immunocapture ELISA testing.For influenza and parainfluenza viruses, viral antigens were directly detected in the suspension by an immunocapture enzyme-linked immunosorbent assay (ELISA; ICE) as described previously (6). Briefly, 90ml of the sample suspension was added to wells of a 96-well microtiter plate containing fixed monoclonal antibodies that had been prepared in our laboratory (0.05mg of anti-NPA and 0.05mg of anti-NPB for influenza viruses and 0.05mg of anti-NH for parainfluenza viruses). Then, 200ml of phosphate-buffered saline (PBS) containing 1% bovine serum albumin was added to each well. The contents of the plates were mixed gently on a mechanical vibrator, and the plates were incubated for 2 h at 378C. After incubation, the wells were washed three times with PBS, and 100ml of homologous rabbit antiserum at a dilution of 3 hemagglutination inhibition units was added (6). After 1 h of incubation, the wells were washed three times with PBS and 100 ml of the conjugate solution was added. The plates were incubated for 45 min at 378C and washed three times with PBS, and 100ml of the substrate solution was added. The plates were incubated in the dark for 30 min at room temperature, and then the reaction was stopped by adding 25ml of 2 mM sodium azide. The plates were read with a spectrophotometer at 405 and 630 nm. Positive results were defined as follows: (optical density at 405 nm)/(optical density at 630 nm).0.25. The sensitivity of the ICE technique has been reported previously (6).
(ii) Immunostaining testing.RSV and coronaviruses were detected by an immunostaining test on the basis of elements of work described elsewhere (19, 24, 25). Briefly, 200 ml of the sample suspension was transferred to a sterile 1.5-ml Eppendorf tube. Then, 500 ml of PBS was added and the tube was centrifuged at 12,000 rpm in an Eppendorf microcentrifuge (model 5415C) for 5 min at room temperature. The pellet was washed with PBS and was resuspended in 50 ml of PBS. A 10-ml aliquot was transferred to a well of a slide, dried for 30 min on a heat block, and fixed with cold acetone. Ten milliliters of the appro-priate monoclonal antibody (for coronavirus, the antibody was produced in our laboratory; for RSV, it was provided by BioMe´rieux, Marcy l’Etoile, France [RSV direct immunofluorescence identification]) was added to the wells. After 30 min of incubation at 378C, 10 ml of the conjugate antibody solution was added. The slides were incubated for 30 min at 378C; this was followed by the application of 10 ml of substrate solution and examination under UV light.
(iii) Tissue cell culture.The remaining sample suspension was inoculated onto MDCK, HEp-2, and MRC5 cell cultures. To promote growth of the influenza viruses, MDCK cell monolayers were trypsinized and the cells were centrifuged at 3003gfor 30 min prior to inoculation, as described previously (3, 4, 6, 16, 30). After incubation for 3 days, the MDCK cell culture supernatants were evaluated for the presence of influenza or parainfluenza virus by ICE. Influenza isolates were also identified by a hemagglutination inhibition assay with the MDCK cell cultures as described previously (16, 21). RSV was detected by observing HEp-2 cell cultures for a cytopathic effect. When a cytopathic effect was observed in MRC5 cell cultures, rhinoviruses, ADVs, or enteroviruses were detected by acid (pH 3) lability (7), immunostaining (25), or seroneutralization with Lim and Benyesh-Melnick intersecting pools (20), respectively. All three tests were per-formed on each cytopathic effect-positive MRC5 culture. Herpesviruses and cytomegalovirus were excluded by visual examination of the morphology of the cytopathic effect and immunostaining with an anti-cytomegalovirus monoclonal antibody produced in our laboratory, respectively.
Statistical analysis.Correlation of viral isolates with specific symptoms or signs was accomplished by chi-square tests.
RESULTS
Absolute and relative frequency of viruses.Among the 962
swabs collected during the surveillance period, 348 were pos-itive for at least one virus (36.1%); 62 of 75 (82.7%)
partici-pating physicians sent at least 1 positive swab (mean, 5.4 swabs; range, 1 to 24 swabs).
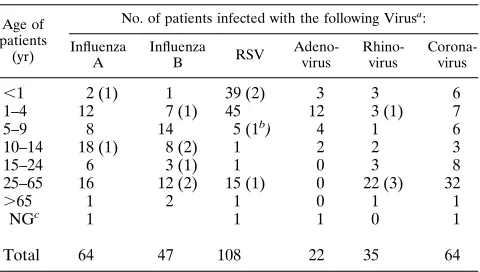
The 348 positive swabs included 108 RSV, 64 influenza virus A (all H3N2), 47 influenza virus B, 64 coronavirus, 35 rhino-virus, 22 ADV, 5 enterorhino-virus, and 3 parainfluenza virus strains (Table 1). Fifteen of the 16 mixed infections included corona-virus in addition to one other corona-virus. RSV and ADV comprised the remaining mixed infection.
Age distribution.The age distribution of the patients from
whom the viruses were detected was identical to the age dis-tribution of the population sampled (Table 2). A total of 54.2% of the strains were recovered from patients younger than 10 years of age, including 82.4% of the RSV and 86.4% of the ADV strains. In contrast, 50% of the coronaviruses and 65.7% of the rhinoviruses were detected in patients older than 25 years, whereas only 26 and 31.9% of influenza viruses A and B were detected in individuals in this age group, respectively. Mixed infections tended to be more frequent (62.5%) in pa-tients older than 10 years of age compared with children less than 10 years of age (48.6%), but the difference was not sta-tistically significant.
Seasonal distribution of viruses. The rate of detection of
these viruses was not equally distributed during the 7-month surveillance period (Fig. 1). RSV was mostly detected during the first part of the winter, while influenza viruses were
pri-TABLE 1. Viruses isolated from 962 episodes of influenza-like illness during the 1994–1995 surveillance period
Age of patients
(yr)
No. of patients infected with the following Virusa:
Influenza A Influenza B RSV Adeno-virus Rhino-virus Corona-virus
,1 2 (1) 1 39 (2) 3 3 6
1–4 12 7 (1) 45 12 3 (1) 7
5–9 8 14 5 (1b) 4 1 6
10–14 18 (1) 8 (2) 1 2 2 3
15–24 6 3 (1) 1 0 3 8
25–65 16 12 (2) 15 (1) 0 22 (3) 32
.65 1 2 1 0 1 1
NGc 1 1 1 0 1
Total 64 47 108 22 35 64
a
Numbers in parentheses indicate mixed infections with a coronavirus unless indicated otherwise.
b
Mixed infection with adenovirus.
c
[image:2.612.317.557.89.225.2]NG, not given.
TABLE 2. Correlation of different age groups with total number of samples and total number of positive samples
Age of patients (yr)
No. of samples (% of total)
No. (%) of samples positive for virus
,1 127 (13.1) 54 (42.5)
1–4 262 (27.1) 86 (32.8)
5–9 100 (10.4) 38 (38)
10–14 65 (6.8) 34 (52.3)
15–24 88 (9.1) 21 (23.9)
25–65 278 (28.9) 97 (34.9)
.65 34 (3.5) 6 (17.6)
NGa 8 (0.1) 4 (50)
Total 962 340 (36)b
aNG, not given.
bThis total (percentage) does not include five enteroviruses and three
para-influenza viruses.
on May 15, 2020 by guest
http://jcm.asm.org/
[image:2.612.316.557.581.702.2]marily detected during the end of the winter and the beginning of spring. Coronaviruses were detected during two peak peri-ods corresponding to the beginning and the end of the peak RSV period. ADV and rhinovirus were detected at a low rate during the entire surveillance period.
Correlation of specific viruses with clinical data.
Compari-son of viral type with specific signs and symptoms revealed some correlation with the different viruses isolated (Table 3). Influenza-like illness associated with ADV was significantly correlated with a temperature of.39.58C (77.3%;P,0.001), while the other viruses were associated with mostly mild fever. Only 29.9% of the patients from whom other viruses were
detected had a temperature of.39.58C (mean, 29.9%; range, 20% [rhinovirus] to 43.7% [influenza virus A]). Other charac-teristics of ADV infection included a trend toward an associ-ation with abdominal pain that was not significant (22.7% for adenovirus compared with a mean of 12.3% for the other viruses) and a lack of constitutional symptoms including my-algia, asthenia, and headache. Twelve of the 22 cases of illness were reported in children ages 1 to 5 years.
RSV was responsible for most of the cases of bronchiolitis (76.2% of the cases of bronchiolitis;P,0.001 compared with bronchiolitis caused by the other viruses), and bronchiolitis was observed in 44.5% of the subjects infected with RSV.
[image:3.612.97.510.76.269.2]Further-FIG. 1. Seasonal distributions of all specimens collected (h) and positive samples (å) (lines) and seasonal distributions of individual viruses (bars) [■, influenza virus A;h, influenza virus B;z, RSV;p, coronavirus]). The surveillance period began on week 38 of 1994 and concluded on week 18 of 1995.
TABLE 3. Percentage of clinical symptoms observed in 340 patients from whose nasal swabs respiratory viral agents were recovereda
Clinical observation
% patients infected with the following virus (no. of strains isolated):
Influenzavirus A (64) Influenzavirus B (47) RSV (108) Adenovirus (22) Rhinovirus (35) Coronavirus (64)
Respiratory symptoms
Clear nasal secretion 79.7 87.2 76.9 72.7 71.4 67.2
Purulent nasal secretion 7.8 10.6 12 9 20 20.3
Cough 93.7b 89.4b 82.4 59.1 77.1 71.9
Physical findings
Temp not determined 4.7 8.5 15.7 4.5 17.2 21.9
Temp,38.58C 6.3 2.1 18.5 0 11.4 18.7
Temp between 38.5 and 39.58C 45.3 53.2 40.7 18.2 51.4 34.4
Temp.39.58C 43.7 36.2 25 77.3c 20 25
Pharyngitis 61 68.1 42.6 59.1 65.7 60.9
Otitis 12.5 19.1 31.5 18.2 14.3 17.2
Bronchiolitis 1.5 2.1 44.5c 9 8.6 12.5
General symptoms
Emesis 10.1 4.2 12 9 5.7 10.9
Diarrhea 1.5 2.1 8.3 0 2.8 4.7
Abdominal pain 17.2 12.7 6.5 22.7 14.3 15.6
Myalgia 64.1 65.9 13.9 31.8 57.1 64.2
Asthenia 70.3 68.1 21.3 22.7 62.8 70.3
Headache 67.2 74.5 15.7 45.4 54.3 58.8
aData for patients from whom three enteroviruses and five parainfluenza viruses were recovered during the study are not included here. bStatistically significant (P,0.01).
cStatistically significant (P,0.001).
on May 15, 2020 by guest
http://jcm.asm.org/
[image:3.612.61.556.477.702.2]more, RSV infection was characterized by a lack of constitu-tional symptoms.
There was a significant correlation between influenza virus A or B infection and cough (93.7 and 87.3%, respectively) compared with the mean correlation for the other viruses (P,
0.01). The clinical presentations associated with influenza virus A infections were not different from those associated with influenza virus B infections (Table 3).
No patients in the study required hospitalization. There was no difference in the clinical symptoms or signs reported for children examined by pediatricians compared with those re-ported by general practitioners.
DISCUSSION
At least one viral pathogen was detected in approximately 40% (348) of the nasal swabs evaluated. This large number of specimens provided the study with an adequate database with which to make meaningful conclusions regarding the relative frequencies and seasonal distributions of the viruses detected and the statistical power to determine clinical correlations.
The most common pathogen isolated was RSV. This result correlates well with previous data. RSV is the most common cause of childhood pneumonia worldwide (1). Immunity to an RSV infection is incomplete, and repeated infections through-out life are common (22). Infections with influenza viruses A and B and coronavirus were also common. However, the rel-ative number of influenza virus isolates obtained during this study was less than the relative numbers obtained during the three previous GROG surveillance periods and the numbers described in previously published reports (4, 11). All influenza virus A strains were typed as H3N2, in contrast to a usual pattern of mixed H1N1 and H3N2 isolates (2a). The charac-teristics of the influenza virus isolates obtained during the current study period correlated well with those of the influenza virus isolates in concomitant reports from surrounding coun-tries (Switzerland, Belgium, and Germany; World Health Or-ganization report, 1995). Thus, the results suggest a significant variability in influenza virus outbreaks from year to year.
Rhinovirus was isolated at a frequency less than that nor-mally reported in the literature (12). A likely explanation is the relatively mild symptoms usually associated with rhinovirus infections. Only patients with a full-blown influenza-like syn-drome were included in the study. Compared with other stud-ies (5, 18), parainfluenza virus was only infrequently isolated in the current study. This may be due to the reduced recovery of parainfluenza virus from nasal secretions compared with that from pharyngeal specimens (18). However, the 1991–1992 GROG surveillance data reported significant parainfluenza vi-rus outbreaks during the fall and spring. Thus, the relative paucity of parainfluenza virus strains recovered in the current study may be due to yearly variation.
Viral pathogens were isolated during the entire study period, but many had a distinct seasonal distribution. However, con-clusions on seasonality based on the current study must be regarded as provisional, since they are based on data from a single year. Such seasonal patterns have been reported in the literature, but the cause is not known (8). An epidemic of RSV began in the early winter, starting at week 48 of the year and lasting for 10 weeks, in concordance with GROG reports from previous years (4). Influenza virus was predominantly isolated during the late winter and early spring. This pattern was de-layed compared with that from previous GROG data and pub-lished reports from other years (2a). Coronaviruses were most frequently isolated in two peaks, suggesting a potential for epidemic transmission and infection with different serotypes.
Large coronavirus outbreaks have been reported among el-derly individuals (9). ADVs were isolated at a constant level, in contrast to reports of a predominance of ADV in the fall and winter (1) or the spring (2a).
The results of the study suggested an association between different viruses and specific clinical presentations. An inter-esting correlation between ADV infection and a high fever was observed. A previous study reported that 96% of children with ADV infections had high fevers (2a) but comparative studies with other respiratory viruses have not previously been per-formed. Furthermore, the results of the current study suggest a possible ADV syndrome characterized by a high fever respi-ratory complaints without constitutional symptoms, abdominal pain, a lack of seasonal predominance, and peak incidence in children ages 1 to 5 years. Similarly, RSV infection was asso-ciated with bronchiolitis (confirming previous observations), a predominance of respiratory findings, occurrence in children less than 5 years of age, and a peak incidence during the early winter. However, the lack of constitutional symptoms observed in patients with ADV or RSV infections may be explained by poor reporting for younger children.
Influenza virus infections were significantly associated with cough compared with infections with other viruses in the cur-rent study, confirming previous reports. However, infections were mild compared with the severity determined from data from previous years in the Rhone-Alpes and other studies (2a). No patients were hospitalized. Other data from the 1994–1995 surveillance period that differed from those from past years and/or other studies included a late onset, a lack of H1N1 isolates, and a failure to detect a clinical difference between influenza virus A and B infections. These results underscore the well-recognized yearly variation in influenza virus epidem-ics due to antigenic shift and drift and the importance of annual monitoring.
Infections with respiratory viruses are a common cause of morbidity, mortality, and loss of productivity throughout the world. Common complications include pneumonia and bacte-rial superinfections of the respiratory tract. Amantadine or rimantadine are effective therapies for influenza virus A infec-tions if they are used prophylactically or treatment is started soon after the onset of symptoms. In addition, RSV infections diagnosed in a timely manner can be successfully treated with aerosolized ribavirin. The WIN class of agents have a broad spectrum of action against picornaviruses, including rhinovi-ruses (27) and enterovirhinovi-ruses (26). Timely diagnosis and a bet-ter understanding of the epidemiology of viral respiratory in-fections are needed.
Thus, the current study defined the epidemiology of specific respiratory viral infections and the clinical presentation of pa-tients with acute flu-like illnesses in the Rhone-Alpes region of France from the fall of 1994 through the spring of 1995. With the development of effective antiviral therapy for many respi-ratory viruses, this study and others like it may provide valu-able information to clinicians confronted with patients suffer-ing from respiratory tract infections of viral etiology.
ACKNOWLEDGMENTS
We are grateful to all the general practitioners and pediatricians participating to the GROG network without whom this work would have been impossible.
REFERENCES
1.Avila, M. M., S. Carballal, H. Rovaletti, B. Ebekian, M. Cusminsky, and M. Weissenbacher.1989. Viral etiology in acute lower respiratory infections in children from a closed community. Am. Rev. Respir. Infect.140:634–637. 2.Aymard, M. A.1994. Identification of pandemic viral strains. Role of the
on May 15, 2020 by guest
http://jcm.asm.org/
national reference center. Eur. J. Epidemiol.10:463–464. 2a.Aymard, M. A.Unpublished data.
3.Aymard, M. A., J. J. Chomel, J. P. Allard, D. Thouvenot, D. Honegger, D. Floret, J. Boissel, J. P. Collet, F. Durr, J. Gillet, et al.1994. Epidemiology of viral infections and evaluation of the potential benefit of OM-85 BV on the virologic status of children attending day-care centers. Respiration61(Suppl. 1):24–31.
4.Aymard, M., B. Lina, D. Thouvenot, J. Luciani, J. Stagnara, and the Par-ticipants of the GROG Network.1996. A five years survey of respiratory syncytial virus infections in outpatients, abstr. B1.InAbstracts of the Second International Congress on Pediatric Pulmonology. ICCP, Nice, France. 5.Ayres, J. G., N. D. Ny, and D. M. Fy.1993. Incidence of episodes of acute
asthma and acute bronchitis in general practice. Br. J. Gen. Pract.43:361– 364.
6.Chomel, J. J., D. Pardon, D. Thouvenot, J. P. Allard, and M. Aymard.1991. Comparison between three rapid methods for direct diagnosis of influenza and the conventional isolation procedure. Biologicals95:287–292. 7.Couch, R. B.1996. Rhinoviruses, p. 713–734.InB. N. Fields, D. M. Knipe,
and P. M. Howley (ed.), Fields virology. Raven Press, New York. 8.Domingez, E. A., L. H. Taber, and R. B. Couch.1993. Comparison of rapid
diagnostic techniques for respiratory syncytial and influenza A virus respi-ratory infections in young children. J. Clin. Microbiol.31:2286–2290. 9.Falsey, A. R., R. M. McCann, W. J. Hall, M. A. Tanner, M. M. Criddle, M. A.
Formica, C. S. Irvine, J. E. Kolassa, W. H. Barker, and J. J. Treavor.1995. Acute respiratory tract infection in daycare centers for older persons. J. Am. Geriatr. Soc.43:30–36.
10. Fleming, D. M.1994. The prediction of epidemics of respiratory infection. Eur. J. Epidemiol.10:481–483.
11. Fleming, D. M., and K. W. Cross.1993. Respiratory syncytial virus or influ-enza? Lancet342:8886–8887.
12. Fox, J. P., M. K. Cooney, C. E. Hall, and H. M. Fox.1985. Rhinoviruses in Seattle families: 1975–1979. Am. J. Epidemiol.122:830–846.
13. Hannoun, C.1994. Role of international networks for the surveillance of influenza. Eur. J. Epidemiol.10:449–450.
14. Hemming, V. G.1994. Viral respiratory diseases in children: classification, etiology, epidemiology, and risk factors. J. Pediatr.124:513–516. 15. Henrickson, K. J.1994. Lower respiratory viral infections in
immunocom-petent children. Adv. Pediatr. Infect. Dis.9:59–96.
16. Hughes, J. H.1993. Physical and chemical methods for enhancing rapid detection of viruses and other agents. Clin. Microbiol. Rev.6:150–175. 17. Jensen, C., and F. B. Johnson.1994. Comparison of various transport media
for viability maintenance of herpes simplex virus, respiratory syncytial virus
and adenovirus. Diagn. Microbiol. Infect. Dis.19:137–142.
18. McAnerney, J. M., S. Johnson, and B. D. Schoub.1994. Surveillance of respiratory viruses. A 10-year laboratory-based study. S. Afr. Med. J.84:473– 477.
19. McIntosh, K., J. McQuillin, S. B. Reed, and P. S. Gardner.1978. Diagnosis of human coronavirus infection by immunofluorescence: method and appli-cation to respiratory disease in hospitalized children. J. Med. Virol.2:341– 346.
20. Melnick, J. L., V. Rennick, B. Hampil, N. J. Schmidt, and H. H. Ho.1973. Lyophilized combination pools of enterovirus equine antisera: preparation and test procedures for the identification of field strains of 42 enteroviruses. Bull W. H. O.48:263–268.
21. Palmer, D. F., W. R. Dowdle, M. T. Coleman, and G. C. Schild.1975. Hemagglutination inhibition test, p. 25–62.InAdvanced laboratory tech-niques for influenza diagnosis. Immunology series no. 6. Procedural guide. U.S. Department of Health, Education and Welfare, Atlanta.
22. Panuska, J. R., R. Merolla, N. A. Rebert, S. P. Hoffman, P. Tsivitse, N. M. Cirino, R. H. Silverman, and J. A. Rankin.1995. Respiratory syncytial virus induces interleukin-10 production by human alveolar macrophages. Suppres-sion of early cytokine production and implications for incomplete immunity. J. Clin. Invest.96:2445–2453.
23. Pereira, M. S.1979. Global surveillance of Influenza. Br. Med. Bull.35:9–14. 24. Pothier, P., J. C. Nicolas, G. Prudhomme De Saint Maur, S. Ghim, A. Kazmierczak, and F. Bricout.1985. Monoclonal antibodies against respira-tory syncytial virus and their use for rapid detection of virus in nasopharyn-geal secretions. J. Clin. Microbiol.21:286–287.
25. Ray, C. G., and L. L. Minnich.1987. Efficiency of immunofluorescence for rapid detection of common respiratory viruses. J. Clin. Microbiol.25:355– 357.
26. See, D. M., and J. G. Tilles.1992. Treatment of coxsackievirus A9 myocar-ditis in mice with WIN 54954. Antimicrob. Agents Chemother.36:425–428. 27. Shepard, D. A., B. A. Heinz, and R. R. Rueckert.1993. WIN 52035-2 inhibits both attachment and eclipse of human rhinovirus 14. J. Virol.67:2245–2254. 28. Stuart-Harris, C.1979. Epidemiology of influenza in man. Br. Med. Bull.
35:3–8.
29. Van Lierde, S., L. Corbeel, and E. Eggermont.1989. Clinical and laboratory findings in children with adenovirus infections. Eur. J. Pediatr.148:423–425. 30. Woods, G. L., and A. M. Johnson.1989. Rapid 24-well plate centrifugation assay for detection of influenza A virus in clinical specimens. J. Virol. Meth-ods24:35–42.
31. Wright, S. A., and V. M. Bieluch.1993. Selected nosocomial viral infections. Heart Lung22:183–187.
![FIG. 1. Seasonal distributions of all specimens collected (�virus A;) and positive samples (å) (lines) and seasonal distributions of individual viruses (bars) [I, influenza �, influenza virus B; z, RSV; p, coronavirus])](https://thumb-us.123doks.com/thumbv2/123dok_us/8217522.820666/3.612.61.556.477.702/distributions-specimens-collected-distributions-individual-inuenza-inuenza-coronavirus.webp)
