Major histocompatibility complex class I
molecule expression is normal on peripheral
blood lymphocytes from patients with
insulin-dependent diabetes mellitus.
W Hao, … , C Greenbaum, J P Palmer
J Clin Invest.
1996;
98(7)
:1613-1618.
https://doi.org/10.1172/JCI118955
.
Recent work from one laboratory has shown, in both nonobese diabetic mice and humans,
an association between insulin-dependent diabetes mellitus (IDDM) and quantitative
difference in MHC class I molecule expression. This reported decrease in MHC class I
molecule expression is very controversial in the nonobese diabetic mouse model of IDDM,
but to our knowledge, it has not been evaluated by another group in human IDDM. To
evaluate this question, we studied 30 patients with IDDM and 30 age- and sex-matched
normal controls. MHC class I molecule expression was measured by flow cytometry with
conformational-dependent MHC class I mAbs. The mean antigen density of MHC class I
molecule expression in IDDM vs. normal control is 454+/-34 vs. 440+/-28 for lymphocytes
and 1,440+/-117 vs. 1,494+/- 117 for monocytes, both P > 0.05. Three
conformational-dependent MHC class I antibodies showed consistent results. To estimate the biological
variation of MHC class I molecule expression in normal controls, we also studied 10
age-and sex-matched normal control pairs. Using X +/-SD of the percentage difference of mean
antigen density in the normal control pairs as our definition of normal, we found that 70%
(21/30) of IDDM patients had normal, 13% (4/30) of IDDM patients had decreased, and 17%
(5/30) of IDDM patients had increased MHC class I molecule expression on lymphocytes.
All IDDM patients showed […]
Research Article
Find the latest version:
The Journal of Clinical Investigation
Volume 98, Number 7, October 1996, 1613–1618
Major Histocompatibility Complex Class I Molecule Expression Is Normal
on Peripheral Blood Lymphocytes from Patients with Insulin-dependent
Diabetes Mellitus
Wei Hao,*‡ Paul Gladstone,§ Susan Engardt,§ Carla Greenbaum,*‡ and Jerry P. Palmer*‡
*Department of Veterans Affairs Puget Sound Health Care System, Seattle, Washington 98108; ‡Department of Medicine, University of
Washington, Seattle, Washington 98195; and §Bristol-Myers Squibb Pharmaceutical Research Institute, Seattle, Washington 98121
Abstract
Recent work from one laboratory has shown, in both non-obese diabetic mice and humans, an association between in-sulin-dependent diabetes mellitus (IDDM) and quantitative difference in MHC class I molecule expression. This re-ported decrease in MHC class I molecule expression is very controversial in the nonobese diabetic mouse model of IDDM, but to our knowledge, it has not been evaluated by another group in human IDDM. To evaluate this question, we studied 30 patients with IDDM and 30 age- and sex-matched normal controls. MHC class I molecule expression was measured by flow cytometry with conformational-dependent MHC class I mAbs. The mean antigen density of MHC class I molecule expression in IDDM vs. normal con-trol is 454634 vs. 440628 for lymphocytes and 1,4406117 vs. 1,4946117 for monocytes, both P . 0.05. Three confor-mational-dependent MHC class I antibodies showed consis-tent results. To estimate the biological variation of MHC class I molecule expression in normal controls, we also stud-ied 10 age- and sex-matched normal control pairs. Using X6SD of the percentage difference of mean antigen density in the normal control pairs as our definition of normal, we found that 70% (21/30) of IDDM patients had normal, 13% (4/30) of IDDM patients had decreased, and 17% (5/30) of IDDM patients had increased MHC class I molecule expres-sion on lymphocytes. All IDDM patients showed normal MHC class I expression on monocytes. In conclusion, we find that there is no consistent decrease in MHC class I mol-ecule expression on either lymphocytes or monocytes from patients with IDDM. The MHC class I molecule expression observed in IDDM patients is largely within the expected bi-ological variation of MHC class I molecule expression that has been observed in normal controls. (J. Clin. Invest. 1996. 98:1613–1618.) Key words: major histocompatibility com-plex class I • insulin-dependent diabetes mellitus • lympho-cytes
Introduction
MHC class I molecules contain two separate polypeptide chains: an MHC-encoded a or heavy chain, and a non-MHC
encoded b chain. In humans, the a chain is a 44-kD transmem-brane glycoprotein, and the b chain is a nonpolymorphic 12-kD polypeptide (b2 microglobulin). The b chain interacts nonco-valently with the a chain. The association of the a chain with the b chain occurs intracellularly within the endoplasmic retic-ulum and appears to be critical for maintaining MHC class I molecules in their original conformation (1, 2). The surface ex-pression of MHC class I molecules is also dependent on the binding to the peptides that are being processed within the cell. Association of such peptides with the MHC class I pep-tide–binding cleft promotes association of the a chain with b
chain and correct folding of the complete MHC class I mole-cules, thus maintaining the conformational stability of MHC class I molecules (1, 2).
Antigen-processing (TAP)1 genes encode peptide
trans-porters that carry peptides (derived from self or viral peptides) from the cytoplasm into the endoplasmic reticulum, where the peptides complex with the MHC class I molecules. This trimo-lecular complex of a chain, b chain, and peptides is conforma-tionally stable and is expressed on the cell surface (3–7).
The principal function of MHC class I molecules is to present endogenous antigens (peptides) to CD81 T
lympho-cytes. The expression and presentation of MHC class I mole-cules is necessary for establishing self-tolerance, and decreased expression of such molecules has been hypothesized to lead to autoimmune diseases secondary to impaired self-tolerance. Decreased expression of MHC class I molecules on lympho-cytes from patients with insulin-dependent diabetes mellitus (IDDM) and nonobese diabetic (NOD) mice, an animal model of autoimmune diabetes, has been reported (8, 9). Mu-tation and defective expression of TAP-1 has been reported to result in decreased MHC class I molecule expression in NOD mice (8, 9). Since the TAP gene is located within the class II lo-cus, the TAP gene is a candidate MHC class II–related diabe-tes susceptibility gene in the NOD mice (8, 9). In addition, de-creased MHC class I molecule expression has been reported with other autoimmune diseases (10). Other groups, however, have reported no decreased expression of MHC class I mole-cules on lymphocytes from NOD mice (11–13). To evaluate this question in human IDDM, we made a careful study of the MHC class I molecule expression on PBLs from patients with IDDM.
Methods
We studied 30 patients with IDDM (mean age 5 32.5766.15 yr; fe-male/male ratio (F/M) 5 13/17), which include 12 recent onset (, 2.5 Address correspondence to Wei Hao, M.D., DVA Puget Sound
Health Care System, Endocrinology (111), 1660 South Columbian Way, Seattle, WA 98108. Phone: 206-764-2774; FAX: 206-764-2693; E-mail: [email protected]
Received for publication 10 May 1996 and accepted in revised form 23 July 1996.
yr) IDDM (duration 5 11.4667.27 mo, age 5 28.2565.74 yr, F/M 5
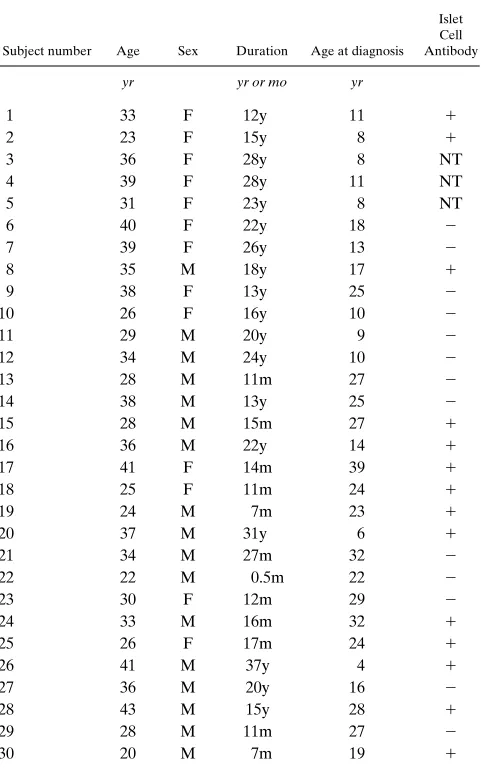
4/8), 18 long duration (. 10 yr) IDDM (duration 5 21.2866.90 yr, age 5 35.4464.62 yr, F/M 5 9/9), 30 age- and sex-matched normal controls (age 5 30.5067.05 yr, F/M 5 13/17) without a family history of IDDM or other autoimmune diseases (Table I).
MHC class I molecule expression was measured by flow cytome-try using the methods described by Faustman et al. (8, 10). PBL were prepared from anticoagulant-treated blood by Ficoll-Hypaque gradi-ent separation. 106 freshly isolated PBLs were stained with MHC
class I mAb W6/32 at a final concentration of 1.5 mg/ml in 100 ml RPMI 1640 medium containing 2% FBS for 15 min at room tempera-ture. mAb W6/32 is a conformational-dependent antibody that reacts preferentially with peptide-occupied MHC class I molecules and rec-ognizes all alleles of human MHC class I molecules. The mAb W6/32 used in this study was kindly provided by Dr. Faustman (Immunology Laboratory, Harvard Medical School, Cambridge, MA), and the centration of the antibody used in this study was identical to the con-centration used by Faustman et al. (8, 10). This low concon-centration of W6/32 has been previously demonstrated to maximize the measure-ment of conformational-dependent (peptide-occupied) MHC class I molecules (10). After washing, the cells were incubated with goat anti–mouse IgG2a-FITC–conjugated secondary antibody (1:50; South-ern Biotechnology Associates, Inc., Birmingham, AL) for 15 min at room temperature in the dark and followed by washing. Flow
cytom-etry analysis was then performed immediately. Mean antigen density was measured by a FACScan® (Becton Dickinson & Co., Mountain
View, CA). Two gates were set up on the FACScan® by size to
distin-guish between lymphocytes and monocytes. The setting of the lym-phocyte and monocyte gates was demonstrated to be efficient by two-color staining using the monocyte marker CD14-PE–conjugated antibody (Becton Dickinson). In the monocyte gate, . 95% of cells were positive for the monocyte marker; in the lymphocyte gate, there was , 2% of cells that were positive for the monocyte marker. 50,000 cells were assayed in each sample.
We studied individual sex- and age-matched IDDM and normal controls on the same day to allow direct comparison of the IDDM pa-tient and control. The FACScan® measurement was performed
[image:3.612.314.480.252.695.2]within 2–3 h after blood withdrawal. This procedure was followed to prevent low temperature from correcting defective MHC class I mol-ecule expression in vitro (9). Two different anticoagulants (heparin
Table I. Clinical Information on Patients with IDDM
Subject number Age Sex Duration Age at diagnosis Islet Cell Antibody
yr yr or mo yr
1 33 F 12y 11 1
2 23 F 15y 8 1
3 36 F 28y 8 NT 4 39 F 28y 11 NT 5 31 F 23y 8 NT 6 40 F 22y 18 2
7 39 F 26y 13 2
8 35 M 18y 17 1
9 38 F 13y 25 2
10 26 F 16y 10 2
11 29 M 20y 9 2
12 34 M 24y 10 2
13 28 M 11m 27 2
14 38 M 13y 25 2
15 28 M 15m 27 1
16 36 M 22y 14 1
17 41 F 14m 39 1
18 25 F 11m 24 1
19 24 M 7m 23 1
20 37 M 31y 6 1
21 34 M 27m 32 2
22 22 M 0.5m 22 2
23 30 F 12m 29 2
24 33 M 16m 32 1
25 26 F 17m 24 1
26 41 M 37y 4 1
27 36 M 20y 16 2
28 43 M 15y 28 1
29 28 M 11m 27 2
30 20 M 7m 19 1
ICA, islet cell antibody, NT, not tested.
[image:3.612.58.307.332.721.2]and acid citric dextrose) were tested to determine the potential effect on results.
We also studied 12 IDDM patients and matched controls with other MHC class I mAbs: HIDE and P10.1. These are also conforma-tional-dependent antibodies that react with peptide-occupied MHC class I molecules and recognize all alleles of human MHC class I mol-ecules (14). The mAbs HIDE and P10.1 were provided by Bristol-Myers Squibb Pharmaceutical Research Institute (Seattle, WA). In addition, we studied 10 age- and sex-matched normal control pairs (age 5 28.0565.56 yr, F/M 5 4/6) with mAb W6/32 to determine the variation of MHC class I molecule expression that would be expected in normal controls studied together on the same day.
A cell line with missing MHC class I transporter and a mutation in the MHC class II diabetes mellitus allele (5.2.4) was used as a posi-tive control. A cell line with a mutation only in the MHC class II dia-betes mellitus allele (9.5.3) and a cell line with normal expression of MHC class I molecules (COX) were used as negative controls. The mutant cell lines 5.2.4 and 9.5.3 were derived from a human B-lym-phoblastoid cell line (15) and were kindly provided by Drs. Pious and Mellins (Departments of Pediatrics, Immunology and Genetics, Uni-versity of Washington, Seattle, WA).
Statistical analysis. Results are shown as mean6SEM. The Stu-dent’s t test was used to compare the mean antigen density of MHC class I molecule expression between IDDM patients and normal con-trols, and statistical significance is defined as , 0.05.
Results
Using mAb W6/32, the cell line 5.2.4 with the missing MHC class I transporter showed dramatically decreased fluorescence
intensity (the peak of fluorescence intensity shifts to left) com-pared with the cell line 9.5.3 with mutation only in MHC class II DM allele and the cell line COX with normal expression of MHC class I molecules (Fig. 1).
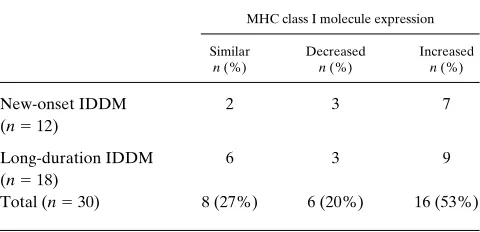
[image:4.612.65.513.57.187.2] [image:4.612.57.297.623.739.2]Using only visual inspection of the results, we find that there are three patterns of MHC class I molecule expression (similar, decreased, and increased) on lymphocytes from pa-tients with IDDM compared with age- and sex-matched con-trols (Fig. 2). Analyzed in this manner, 27% (8/30) of IDDM patients showed similar, 20% (6/30) showed decreased, and 53% (16/30) showed increased MHC class I molecule expres-sion on lymphocytes compared with the matched controls. This pattern of MHC class I molecule expression was observed in both recent onset IDDM and long-duration IDDM patients (Table II). MHC class I molecule expression on monocytes showed a similar pattern (Table III). In addition, there was no difference in the mean antigen density of MHC class I mole-cule expression on either lymphocytes or monocytes between IDDM patients and normal controls (mean antigen density of IDDM vs. normal control (X6SEM): 454634 vs. 440628 for lymphocytes and 1,4406117 vs. 1,4946117 for monocytes, both P. 0.05).
To determine the normal variation of MHC class I mole-cule expression in normal controls using this methodology, we studied 10 sex- and age-matched normal control pairs as if they were a matched pair consisting of an IDDM patient and a con-trol. The mAb W6/32 was used. As shown in Table IV, X6SD of the percentage difference of mean antigen density of MHC
[image:4.612.316.557.623.738.2]Figure 2. Patterns of MHC class I expression on lymphocytes from IDDM patients compared with the matched normal controls. Solid line peak, IDDM; dash line peak, normal control. The IDDM patient showed (A) similar, (B) decreased, and (C) increased MHC class I molecule expres-sion vs the control. (D) The gate of lymphocytes selected on FACScan®.
Table II. MHC Class I Molecule Expression on Lymphocytes from IDDM Patients Compared with the Matched Normal Controls (Visual Inspection)
MHC class I molecule expression
Similar
n (%)
Decreased
n (%)
Increased
n (%)
New-onset IDDM (n5 12)
2 3 7
Long-duration IDDM (n5 18)
6 3 9
Total (n5 30) 8 (27%) 6 (20%) 16 (53%)
Table III. MHC Class I Molecule Expression on Monocytes from IDDM Patients Compared with the Matched Normal Controls (Visual Inspection)
MHC class I molecule expression
Similar
n (%)
Decreased
n (%)
Increased
n (%)
New-onset IDDM
(n5 12) 2 6 4 Long-duration IDDM
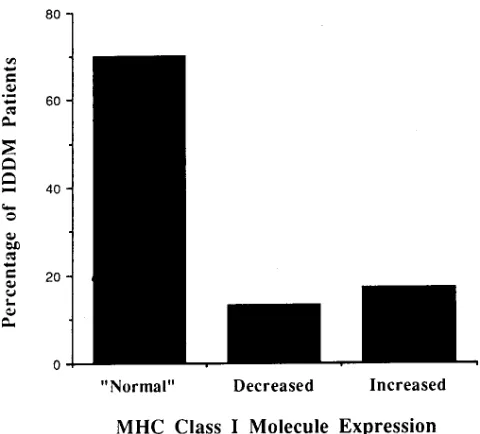
class I molecule expression from these normal control pairs is 3.58611.9(%) on lymphocytes and 10.54631.9(%) on mono-cytes. The X62SD of the percentage difference of mean anti-gen density from the normal control pairs was defined as nor-mal. Using this definition of normal, we determined the frequency of IDDM patients with normal, decreased, and in-creased MHC class I molecule expression: 70% (21/30) of IDDM patients were normal, 13% (4/30) of IDDM patients had decreased, and 17% (5/30) of IDDM patients had in-creased MHC class I molecule expression on lymphocytes (Fig. 3). All IDDM patients showed normal MHC class I mole-cule expression on monocytes.
In addition, we studied 12 IDDM patients and their matched normal controls with other conformational-depen-dent MHC class I mAbs: HIDE and P10.1. When compared to antibody W6/32, consistent results were obtained in each indi-vidual pair (Table V).
Discussion
Faustman et al. originally reported decreased expression of MHC class I molecules on lymphocytes from human IDDM and NOD mice (8, 9). This decreased expression of MHC class I molecules on the surface of PBLs was predictive of the pro-gression to hyperglycemia in genetically susceptible popula-tions of both humans and mice (8). A mutation of TAP-1 has also been reported to contribute to this decreased MHC class I molecule expression (8, 9). Furthermore, T cells from IDDM patients were reported to have decreased activation and prolif-eration response to self-antigen presented by autologous cells in autologous mixed lymphocyte reaction (8). Therefore, Faustman et al. concluded that deficient surface expression of peptide-occupied MHC class I molecules is closely associated with autoimmune diabetes. They proposed that the defect in antigen presentation may impair the development of self-toler-ance leading to autoimmunity. Further study by this group re-ported decreased MHC class I molecule expression on lym-phocytes in other autoimmune diseases (10), and they concluded that autoimmune diseases are characterized by
[image:5.612.315.555.56.273.2]de-creased expression of MHC class I on lymphocytes. More re-cently, this group reported that in NOD mice, there was an abnormal assembly and peptide presentation, and reestablish-ment of endogenous MHC class I and self-peptide presenta-tion by CFA and mouse hepatitis virus restored MHC class I molecule expression, increased TAP-1 mRNA abundance, eliminated in vitro autoreactivity to self-MHC class I in autolo-gous mixed lymphocyte reactions, and prevented diabetes in NOD mice (16, 17). Others have reported, however, that TAP-1 and MHC class I molecule expression are normal in NOD mice. Gaskins et al. specifically addressed the question
Table IV. The Percentage Difference of Mean Antigen Density of MHC Class I Molecule Expression on Lymphocytes and Monocytes in Normal Control Pairs
Pair number Lymphocytes Monocytes
1 28.6% 61.4% 2 214.9% 214.3% 3 6.4% 221.1% 4 16.2% 44.2% 5 210.7% 0.3% 6 21.9% 215.9% 7 10.6% 25.9%
8 8.2% 41.3%
9 0.4% 232.2% 10 6.3% 15.8% X6SD 3.58611.9(%) 10.54631.9(%)
The percentage difference was calculated by the difference of mean antigen density between the two matched control (NC1-NC2) divided by mean antigen density of NC2 3 100. A minus difference means that the NC1
[image:5.612.56.296.93.246.2]has decreased MHC class I molecule expression compared with NC2. Figure 3. The frequency of IDDM patients with normal, decreased, and increased MHC class I molecule expression on lymphocytes.
Table V. The Percentage Difference of Mean Antigen Density of MHC Class I Molecule Expression with Multiple
Conformational-dependent MHC Class I Antibodies in IDDM Patients Compared with the Matched Normal Controls
Pair number HIDE P10.1 W6/32
1 IDDM vs NC 224.6% 259.2% NT 2 IDDM vs NC 219.1% 245.3% NT 3 IDDM vs NC 16.2% 85.4% NT 4 IDDM vs NC 24.4% 17.9% NT 5 IDDM vs NC 11.5% 21.5% NT 6 IDDM vs NC 222.0% 241.7% 230.8% 7 IDDM vs NC 210.8% 217.6% 212.4% 8 IDDM vs NC 39.6% 22.3% 38.0% 9 IDDM vs NC 18.1% 6.7% 12.1% 10 IDDM vs NC NT 32.1% 17.3% 11 IDDm vs NC NT 21.4% 29.1% 12 IDDM vs NC NT 12.3% 27.4%
[image:5.612.315.555.510.675.2]of TAP-1 activity by examining constitutive and upregulated level of TAP-1 mRNA in NOD mice and control mice. They observed no reduction in resting or cytokine- and LPS-acti-vated TAP-1 levels in macrophages from NOD mice com-pared with C57BL/KsJ mice (11). Consistent with normal reg-ulation of the TAP gene, they observed normal levels of MHC class I molecule expression on the cell surface of freshly iso-lated splenic lymphocytes from prediabetic NOD/Lt mice (18). Wicker et al. reported that MHC class I molecule expression on T cells from NOD mice is slightly lower than on BALB/C T cells, but MHC class I molecule expression on B cells from 6-wk-old NOD mice is nearly identical to that on BALB/C B cells. By 16 wk of age, however, the B cells from NOD mice exhibited 40% more MHC class I molecule expression than B cells from 6-wk-old NOD mice (12). More recently, Pearce et al. reported that MHC class I molecule expression was slightly but significantly lower on NOD lymphocytes than on BALB/C T cells, but this difference was caused by the smaller size of the NOD splenic lymphocytes, suggesting that MHC class I den-sity on the surface of splenic lymphocytes was the same be-tween the two strains. They also reported that there was no difference in the resting levels of TAP-1 mRNA comparing NOD mice and control mice, and no difference in TAP-1 or TAP-2 mRNA when comparing diabetic and nondiabetic NOD mice. They concluded that constitutive TAP activity and class I expression are normal in female NOD mice, irrespec-tive of age or diabetic status (13).
We were especially interested in studying MHC class I mol-ecule expression in IDDM because of the potential possibility initially reported by Faustman et al. that decreased MHC class I molecule expression differentiates progressors from nonpro-gressors to IDDM (8–10). In contrast to the reports by Faust-man et al., we find no consistent decrease in MHC class I mol-ecule expression on lymphocytes or monocytes from patients with IDDM. In addition, there is no size difference of lympho-cytes or monolympho-cytes between IDDM patients and normal con-trols.
If in fact measurable levels of MHC class I molecule ex-pression were lower in IDDM patients, this could be the result of a number of distinct causes that are divisible into genetic and acquired types. Faustman et al. appear to favor the idea that a genetic defect in the TAP genes results in low expres-sion of conformational-dependent MHC class I molecules. The limited nature of the allelic difference in the TAP genes argues against this possibility. Other genetic explanations are possi-ble; different MHC class I alleles have been shown to differ subtly in the amount of antigen they produce (19). Since IDDM patients tend to be of certain class I genotypes (e.g., B8, B18), if one or more of the genotypes are low expressors, this could account for the reported differences between IDDM subjects and normal controls. The population of subjects in our study is somewhat different from that of Faustman et al. We specifically studied IDDM patients, including both recent on-set and long duration, whereas Faustman et al. studied long-duration IDDM patients as well as high risk relatives of IDDM patients and diabetic vs. nondiabetic twins (8, 10). If our IDDM patients represented a population with different MHC class I genotypes from those of Faustman et al. and MHC class I molecule expression was predominately controlled by class I genotypes, this might help explain our apparently discrepant results. There is no reason to suspect such a difference. Nu-merous acquired differences, such as degree of hyperglycemia,
could result in lower MHC class I molecule expression. Alter-natively, since B lymphocytes generally bear more surface MHC class I molecules than T lymphocytes, if IDDM patients had a higher T/B ratio than normals, MHC class I expression on lymphocytes would be found to be decreased in IDDM pa-tients. Such acquired differences might well be expected to be highly variable in different groups of IDDM patients.
Since we found no consistent difference in MHC class I molecule expression on lymphocytes from IDDM patients, we wondered whether the degree of variability reflects the biolog-ical variation of MHC class I expression in normal controls. To answer this question, we studied 10 pairs of age- and sex-matched normal controls. Using the X62SD of mean antigen density as the criterion to define MHC class I molecule expres-sion in IDDM patients as normal, decreased, and increased, we found that 70% of IDDM patients had normal and 15% of IDDM patients had either decreased or increased MHC class I molecule expression on lymphocytes. If we had studied more normal controls, the normal range would probably have been greater, and consequently more IDDM patients would proba-bly have been considered normal. All IDDM patients showed normal MHC class I molecule expression on monocytes. Therefore, the MHC class I molecule expression on lympho-cytes from IDDM patients observed in this study is largely within the expected biological variation of MHC class I mole-cule expression observed in the normal controls.
Several technical points regarding the measurement of MHC class I molecule expression by flow cytometry are im-portant to consider. First, since there is considerable variation seen in the same sample analyzed on different days because of the analysis day effect on flow cytometry, we studied the indi-vidual IDDM patient and his or her age- and sex-matched con-trol on the same day. This allows direct comparison of mean antigen density of MHC class I molecule expression of the IDDM patient and control. Second, peptide binding is re-quired for efficient assembly, intracellular transport, and main-taining stability of MHC class I molecules on the cell surface, and nonpeptide bound (empty) MHC class I molecules are more rapidly degraded. Exposing cells to low temperature (less than body temperature) and high serum concentration in vitro will decrease the degradation rate of empty MHC class I molecules and result in partial correction of the apparent de-fective pattern of MHC class I molecule expression (9, 16, 20, 21). Faustman et al. reported that exposure of NOD spleno-cytes to 10% serum-containing medium at room temperature for 3–5 h before flow cytometry analysis partially corrects the defective pattern of MHC class I expression (9, 16). To prevent low temperature and high serum concentration from correct-ing decreased MHC class I molecule expression in vitro, we re-quested IDDM patients to come to our laboratory for blood withdrawal, performed the separation of PBLs immediately af-ter blood withdrawal, exposing cells only to low serum–con-taining media (2% FBS) at room temperature during the stain-ing procedure, as suggested by Dr Faustman, and performed flow cytometry analysis immediately after staining. All sam-ples were measured by a FACScan® within 2–3 h of blood
of conformational-dependent (peptide-occupied) MHC class I molecules, as suggested by Dr. Faustman. We also studied a subset of our subjects with other conformational-dependent MHC class I mAbs including HIDE and P10.1 as well as W6/ 32. We found consistent results of MHC class I molecule ex-pression in each individual pair. There was no consistent de-creased expression of MHC class I molecule on PBLs using any of these three conformational-dependent MHC class I an-tibodies. Fourth, we tested two different anticoagulants, hep-arin and acid citrate dextrose, to determine the potential effect on the result. We found that the two different anticoagulants did not affect the measurement of MHC class I molecule ex-pression (data not shown). Fifth, Faustman et al. reported that in IDDM patients, decreased MHC class I molecule expres-sion showed more dramatically on monocytes than on lympho-cytes (10). We set up two gates on flow cytometry by size to distinguish lymphocytes from monocytes and measured MHC class I molecule expression on the two cell populations, respec-tively. The setting of the lymphocyte and monocyte gates was demonstrated to be . 95% efficient using specific cell mark-ers. We found that similar to lymphocytes, there was no consis-tent decreased MHC class I molecule expression on mono-cytes from IDDM patients. Sixth, we had set up positive and negative controls in our study. The cell line with known defec-tive class I molecule expression showed dramatically de-creased MHC class I molecule expression compared with the cell lines with known normal expression of MHC class I mole-cules.
In conclusion, we find in this study that MHC class I mole-cule expression is normal on PBLs from patients with IDDM.
Acknowledgments
We would like to thank Dr. Faustman for providing mAb W6/32, opening her laboratory to us, working with us to establish this meth-odology, and sharing with us the technical concerns regarding mea-surement of MHC class I molecule expression by flow cytometry. We are grateful to Bristol-Myers Squibb Pharmaceutical Research Insti-tute for providing mAbs HIDE, P10.1, and experimental equipment for performing this study. We also thank the administration staff of Diabetes Endocrinology Research Center for assistance in prepara-tion of the manuscript.
This work was supported in part by a grant from the Juvenile Dia-betes Foundation, by the Medical Research Service of the Depart-ment of Veteran Affairs through a VA Merit Review grant, and by National Institutes of Health grants DK17047 and DK02456.
References
1. Bjorkman, J.P., and P. Parham. 1990. Structure, function and diversity of class I major histocompatibility complex molecules. Annu. Rev. Biochem. 59:
253–288.
2. Auffray, C., and J.L. Strominger. 1986. Molecular genetics of the human major histocompatibility. Adv. Hum. Genet. 15:197–247.
3. Deverson, E.V., I.R. Gow, W.J. Coadwell, J.J. Monaco, G.W. Butcher, and J.C. Howard. 1990. MHC class II region encoding proteins related to the multidrug resistance family of transmembrane transporters. Nature (Lond.). 348:738–741.
4. Monaco, J.J., S. Cho, and M. Attaya. 1990. Transport protein genes in the murine MHC: possible implications for antigen processing. Science (Wash. DC). 250:1723–1726.
5. Spies, T., M. Bresnahan, S. Bahrarn, D. Arnold, G. Blanck, E. Mellins, D. Pious, and R. DeMars. 1990. A gene in the human major histocompatibility complex class II region controlling the class I antigen presentation pathway. Nature (Lond.). 348:744–747.
6. Trowsdale, J., I. Hanson, I. Mockridge, S. Beck, A. Townsend, and A. Kelly. 1990. Sequences encoded in the class II region of the MHC related to the ABC superfamily of transporters. Nature (Lond.). 348:741–744.
7. Neefjes, J.J., F. Momburg, and G.J. Hammerling. 1993. Selective and ATP-dependent translocation of peptides by the MHC-encoded transporter. Science (Wash. DC). 261:769–771.
8. Faustman, D., X. Li, H.Y. Lin, Y. Fu, G. Eisenbarth, J. Avruch, and J. Guo. 1991. Linkage of faulty major histocompatibility complex class I to au-toimmune diabetes. Science (Wash. DC). 254:1756–1761.
9. Faustman, D., X. Li, H.Y. Lin, R. Huang, and J. Guo. 1992. Expression of intra-MHC transporter (Ham) genes and class I antigens in diabetes-suscepti-ble NOD mice—Technical Comments. Science (Wash. DC). 256:1830–1831.
10. Fu, Y., D.M. Nathan, F. Li, X. Li, and D.L. Faustman. 1993. Defective major histocompatibility complex class I expression on lymphoid cells in au-toimmunity. J. Clin. Invest. 91:2301–2307.
11. Gaskins, H.R., J.J. Monaco, and E.H. Leiter. 1992. Expression of intra-MHC transporter (Ham) genes and class I antigens in diabetes-susceptible NOD mice—Technical Comments. Science (Wash. DC). 256:1826–1828.
12. Wicker, L.S., P.L. Podolin, P. Fischer, A. Sirotina, R.C. Boltz, Jr., and L.B. Peterson. 1992. Expression of intra-MHC transporter (Ham) genes and class I antigens in diabetes-susceptible NOD mice—Technical Comments. Sci-ence (Wash. DC). 256:1828–1830.
13. Pearce, R.B., L. Trigler, E.K. Svaasand, H.-M. Chen, and C.M. Peter-son. 1995. Levels of Tap-1 and Tap-2 mRNA and expression of Kd and Db on splenic lymphocytes are normal in NOD mice. Diabetes. 44:572–579.
14. Gladstone, P., P. Antonelli, and J.A. Hansen, 1984. (Spatial localization of allospecific HLA class I epitopes by antibody blocking studies (original con-tribution). In Histocompatibility Testing. E.D. Albert, M.P. Baur, and W.R. Mayr, editors. Springer Verlag, New York. 75–76.
15. Fling, S.P., B. Arp, and D. Pious. 1994. HLA-DMA and -DMB genes are both required for MHC class II/peptide complex formation in antigen-pre-senting cells. Nature (Lond.). 368:554–558.
16. Li, F., J. Guo, Y. Fu, G. Yan, and D. Faustman. 1994. Abnormal class I assembly and peptide presentation in the nonobese diabetic mouse. Proc. Natl. Acad. Sci. USA. 91:11128–11132.
17. Huang, R., J. Guo, X. Li, and D.L. Faustman. 1995. Elimination of self-peptide major histocompatibility complex class I reactivity in NOD and b2
-micro-globulin-negative mice. Diabetes. 44:1114–1120.
18. Leiter, E.H., G.J. Christianson, D.V. Serreze, A.T. Ting, and S.M. Worthen. 1989. MHC antigen induction by interferon gamma on cultured mouse pancreatic beta cells and macrophages. J. Exp. Med. 170:1243–1262.
19. Gladstone, P., L. Fueresz, and D. Pious. 1982. Gene dosage and gene ex-pression in the HLA region: evidence from deletion variants. Proc. Natl. Acad. Sci. USA. 79:1235–1239.
20. Rock, K.L., C. Gramm, and B. Benacerraf. 1991. Low temperature and peptides favor the formation of class I heterodimers on RMA-S cells at the cell surface. Proc. Natl. Acad. Sci. USA. 88:4200–4204.