Quantitative trait locus mapping of human
blood pressure to a genetic region at or near
the lipoprotein lipase gene locus on
chromosome 8p22.
D A Wu, … , J I Rotter, Y D Chen
J Clin Invest.
1996;
97(9)
:2111-2118.
https://doi.org/10.1172/JCI118648
.
Resistance to insulin-mediated glucose disposal is a common finding in patients with
non-insulin-dependent diabetes mellitus (NIDDM), as well as in nondiabetic individuals with
hypertension. In an effort to identify the generic loci responsible for variations in blood
pressure in individuals at increased risk of insulin resistance, we studied the distribution of
blood pressure in 48 Taiwanese families with NIDDM and conducted quantitative sib-pair
linkage analysis with candidate loci for insulin resistance, lipid metabolism, and blood
pressure control. We found no evidence for linkage of the angiotensin converting enzyme
locus on chromosome 17, nor the angiotensinogen and renin loci on chromosome 1, with
either systolic or diastolic blood pressures. In contrast, we obtained significant evidence for
linkage or systolic blood pressure, but not diastolic blood pressure, to a genetic region at or
near the lipoprotein lipase (LPL) locus on the short arm of chromosome 8 (P = 0.002, n =
125 sib-pairs, for the haplotype generated from two simple sequence repeat markers within
the LPL gene). Further strengthening this linkage observation, two flanking marker loci for
LPL locus, D8S261 (9 cM telomeric to LPL locus) and D8S282 (3 cM centromeric to LPL
locus), also showed evidence for linkage with systolic blood pressure (P = 0.02 and 0.0002
for D8S261 and D8S282, respectively). Two additional centromeric markers (D8S133, 5 cM
from LPL […]
Research Article
Find the latest version:
http://jci.me/118648/pdf
Linkage of Human Blood Pressure to Lipoprotein Lipase Locus 2111 J. Clin. Invest.
© The American Society for Clinical Investigation, Inc. 0021-9738/96/05/2111/08 $2.00
Volume 97, Number 9, May 1996, 2111–2118
Quantitative Trait Locus Mapping of Human Blood Pressure to a Genetic
Region at or near the Lipoprotein Lipase Gene Locus on
Chromosome 8p22
Du-An Wu,*iXiangdong Bu,‡ Craig H. Warden,* David D.C. Shen,i C.-Y. Jeng,i Wayne H.H. Sheu,i Martin M.T. Fuh,i
Tomohiro Katsuya,§ Victor J. Dzau,§ Gerald M. Reaven,§ Aldons J. Lusis,* Jerome I. Rotter,‡ and Y.-D. Ida Chen§
*Department of Medicine, Department of Microbiology and Molecular Genetics, and Molecular Biology Institute, UCLA, Los Angeles, California 90024; ‡Departments of Medicine and Pediatrics, Cedars-Sinai Research Institute and UCLA, Los Angeles, California 90048; §Department of Medicine, Stanford University, Stanford, California 94305; and iDepartment of Medicine, Triservice General Hospital,
Taipei, Taiwan
Abstract
Resistance to insulin-mediated glucose disposal is a com-mon finding in patients with non–insulin-dependent diabe-tes mellitus (NIDDM), as well as in nondiabetic individuals with hypertension. In an effort to identify the generic loci responsible for variations in blood pressure in individuals at increased risk of insulin resistance, we studied the distribu-tion of blood pressure in 48 Taiwanese families with NIDDM and conducted quantitative sib-pair linkage analysis with candidate loci for insulin resistance, lipid metabolism, and blood pressure control. We found no evidence for linkage of the angiotensin converting enzyme locus on chromosome 17, nor the angiotensinogen and renin loci on chromosome 1, with either systolic or diastolic blood pressures. In con-trast, we obtained significant evidence for linkage of systolic blood pressure, but not diastolic blood pressure, to a genetic region at or near the lipoprotein lipase (LPL) locus on the short arm of chromosome 8 (P 5 0.002, n 5 125 sib-pairs,
for the haplotype generated from two simple sequence re-peat markers within the LPL gene). Further strengthening this linkage observation, two flanking marker loci for LPL locus, D8S261 (9 cM telomeric to LPL locus) and D8S282 (3 cM centromeric to LPL locus), also showed evidence for linkage with systolic blood pressure (P5 0.02 and 0.0002
for D8S261 and D8S282, respectively). Two additional cen-tromeric markers (D8S133, 5 cM from LPL locus, and NEFL, 11 cM from LPL locus) yielded significant P values
of 0.01 and 0.001, respectively. Allelic variation around the LPL gene locus accounted for as much as 52–73% of the to-tal interindividual variation in systolic blood pressure levels in this data set. Thus, we have identified a genetic locus at or near the LPL gene locus which contributes to the varia-tion of systolic blood pressure levels in nondiabetic family members at high risk for insulin resistance and NIDDM. (J.
Clin. Invest. 1996. 97:2111–2118.) Key words: sib-pair • can-didate gene • insulin resistance • diabetes • flanking marker
Introduction
Resistance to insulin-mediated glucose disposal is a character-istic feature of individuals with non–insulin-dependent
diabe-tes mellitus (NIDDM)1 and has been shown to be present
be-fore the development of hyperglycemia (1–3). It has also been suggested that resistance to insulin-mediated glucose disposal and/or compensatory hyperinsulinemia increase the likelihood that nondiabetic individuals will develop a cluster of abnor-malities, including mild glucose intolerance, high plasma tri-glyceride and low high density lipoprotein-cholesterol concen-tration, and high blood pressure (4). In addition, family studies having shown that nondiabetic individuals with relatives hav-ing NIDDM share many of these features as well, suggesthav-ing an appreciable genetic component to the familial aggregation of the metabolic abnormalities associated with insulin resis-tance (5–9).
Patients with NIDDM are not only insulin resistant, but also have an increased prevalence of hypertension (10). In ad-dition, insulin resistance is a common finding in patients with high blood pressure (4, 11). We have attempted to take advan-tage of the relationships between insulin resistance, NIDDM, and hypertension in a study aimed at examining the genetic mechanisms contributing to regulation of blood pressure. Spe-cifically, we studied the variation in blood pressure and the segregation of molecular genetic markers at candidate gene loci in 48 Taiwanese families with at least one parent affected with NIDDM. Nonparametric sib-pair linkage methodology, which compares the quantitative variation of a trait with the number of marker alleles shared identical-by-descent, was used since it makes no assumptions regarding the mode of in-heritance (12–14). To avoid analytic complications resulting from metabolic consequences of diabetes, only the blood pres-sures in the nondiabetic offspring in these families were used in the genetic statistical analysis. The results reveal evidence for linkage between systolic blood pressure, and not diastolic, and markers at the lipoprotein lipase (LPL) locus on chromo-some 8p22.
Address correspondence to Jerome I. Rotter, M.D., Division of Med-ical Genetics, SSB-3, Cedars-Sinai MedMed-ical Center, 8700 Beverly Blvd., Los Angeles, CA 90048. Phone: 310-855-6467; FAX: 310-659-0491.
Received for publication 21 February 1995 and accepted in revised form 20 February 1996.
2112 Wu et al.
Methods
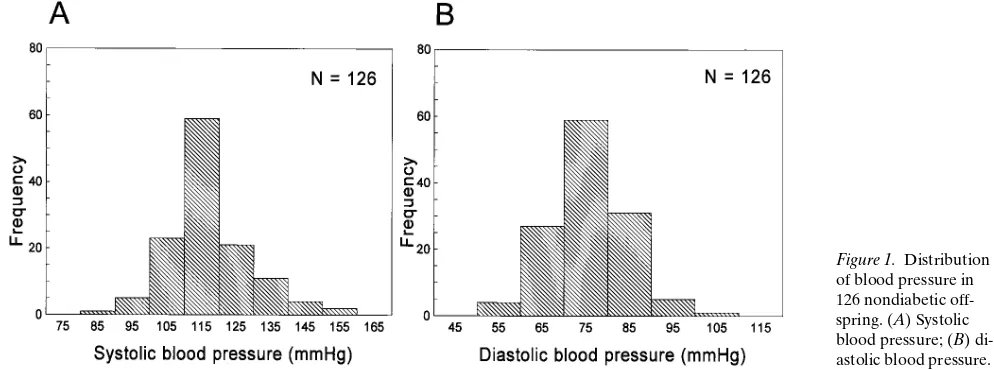
Family ascertainment.48 Chinese nuclear families were ascertained through a proband with documented NIDDM at the Diabetes Clinics of Triservice General Hospital, Taipei, Taiwan. In 31 families, both parents had documented NIDDM, whereas in 17 families only one parent was affected. A total of 222 individuals and 96 parents from these 48 families was included in the study, including 126 nondiabetic offspring defined by the oral glucose tolerance test criteria (15). The investigation was approved by the institutional Human Subjects Pro-tection Committee (Triservice General Hospital, Taiwan).
Phenotypic traits. Age, sex, onset age of NIDDM, weight, and height were obtained in each participating individual. Levels of sys-tolic and diassys-tolic pressure were measured in the sitting position three times at 20-min intervals by an experienced nurse, and the mean value was taken for systolic or diastolic pressure, respectively. The sphygmomanometer had a cuff width of 14.5 cm (Nitirin, Nippon Rinsho Kikai, Kogyo Co. Ltd., Tokyo, Japan). For each participating offspring, a total of 20 ml of blood was obtained at 0, 30, 60, 90, and 120 min in an oral glucose tolerance test (75 grams of glucose). Plasma glucose and insulin levels were measured by enzymatic colori-metric method (16) and by radioimmunoassay (17), respectively. Sur-veillance samples measured quarterly using these protocols met the criteria of standardization required by the Centers for Disease Con-trol (Atlanta, GA).
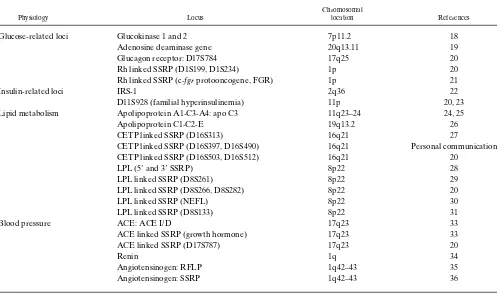
Genotyping. DNA was extracted from peripheral white cells. Polymorphic microsatellite markers at or near candidate gene loci were typed (Table I). PCR was performed in a 96-well plate using a programmable thermal cycler (PTC-100; MJ Research, Inc., Water-town, MA) 948C for 1 min, 588C for 30 s, 728C for 1 min, for a total of 30 cycles. The labeled PCR products were denatured and separated on a 5% sequencing gel. Autoradiography was performed without an intensifying screen for 5–6 h at room temperature. The genotypes
were scored by sizing. The angiotensinogen-converting enzyme (ACE) polymorphism was typed as described (32).
Analytic strategy including statistical linkage analysis. Before for-mal statistical and linkage analyses, each variable was adjusted for age, sex, and body mass index (BMI) by linear regression analysis us-ing the BMDP computer program package (37). However, to maxi-mize the information for the reader, the distributions of blood pres-sure and the mean6SD are shown as their original raw values. For data quality control, we used the LODLINK subroutine computer program of the Statistical Analysis for Genetic Epidemiology com-puter program package to check for any genotype inconsistencies (14). For a given region with multiple typed markers, we also used the LODLINK program to calculate the marker–marker linkage dis-tance. No significant deviation from published data was observed.
Linkage analyses were performed on sib-pairs with the SIBPAL computer program of the S.A.G.E. package (14). The underlying ba-sis for the sib-pair linkage approach is to compare the quantitative variation in a trait between siblings as a function of the number of marker alleles they share identical-by-descent. The underlying trait can follow either Mendelian or non-Mendelian modes of inheritance. In this study, linkage was assessed for continuous traits such as sys-tolic blood pressure and diassys-tolic blood pressure against various can-didate gene loci. A one-tailed Student’s t statistic was used to test the significance of the regression of the squared trait differences versus the number of marker alleles shared identical-by-descent among sib-pairs. If any sib-pair square difference was . 3 SD from the mean sib-pair squared difference, then the regression was determined after de-leting these outlying values.
[image:3.612.59.559.73.367.2]In our sib-pair linkage analysis, we took several measures to con-trol any possible bias and to avoid false-positive results. Firstly, we have excluded from our analyses those sibs with extreme trait values, i.e., beyond the mean63 SD. Secondly, we used the more conserva-tive unweighted least-squares option during the sib-pair analysis. Table I. Candidate Gene Loci Examined in Taiwan NIDDM Families
Physiology Locus
Chromosomal
location References
Glucose-related loci Glucokinase 1 and 2 7p11.2 18
Adenosine deaminase gene 20q13.11 19
Glucagon receptor: D17S784 17q25 20
Rh linked SSRP (D1S199, D1S234) 1p 20
Rh linked SSRP (c-fgr protooncogene, FGR) 1p 21
Insulin-related loci IRS-1 2q36 22
D11S928 (familial hyperinsulinemia) 11p 20, 23
Lipid metabolism Apolipoprotein A1-C3-A4: apo C3 11q23–24 24, 25
Apolipoprotein C1-C2-E 19q13.2 26
CETP linked SSRP (D16S313) 16q21 27
CETP linked SSRP (D16S397, D16S490) 16q21 Personal communication
CETP linked SSRP (D16S503, D16S512) 16q21 20
LPL (59 and 39 SSRP) 8p22 28
LPL linked SSRP (D8S261) 8p22 29
LPL linked SSRP (D8S266, D8S282) 8p22 20
LPL linked SSRP (NEFL) 8p22 30
LPL linked SSRP (D8S133) 8p22 31
Blood pressure ACE: ACE I/D 17q23 33
ACE linked SSRP (growth hormone) 17q23 33
ACE linked SSRP (D17S787) 17q23 20
Renin 1q 34
Angiotensinogen: RFLP 1q42–43 35
Angiotensinogen: SSRP 1q42–43 36
Thirdly, we have restricted our analysis to only those families with both parental marker genotypes available. This makes the linkage analyses independent of marker allele frequency. This is particularly relevant since the frequency of most of these marker alleles in the Chinese are not as well characterized as in the Caucasian population. Lastly, due to the fact that one or both parents for a given family can be homozygous for the marker typed and, thus an unambiguous iden-tical-by-descent status of sib-pairs could not always be determined, we repeated our analysis a second time using only those families with both parents who were heterozygous for the marker typed. Given ad-equate sample size, a true linkage result will be robust to all of the above listed maneuvers. Given these maneuvers and the fact that this study used a candidate gene approach, and thus individual hypothe-ses were being tested, we used P, 0.05 as our initial criteria for link-age. To further reduce the possibility of a type I error, we genotyped additional flanking markers for any tentative linkage finding.
The contribution of locus variation in the LPL gene to raw ad-justed systolic blood pressure levels was estimated by using the sib-pair method (12) adopted in Boerwinkle et al. (38) with modification (see Eq. 7 below). More formally, let Yj, pj, and f1j be the squared pair
differences of a quantitative trait between two siblings, the propor-tion of genes shared identical-by-descent, and the probability of shar-ing only one allele for sib pair j, respectively. It has been demon-strated (12) that there is a linear regression of the squared differences
Yj on pj and f1j, i.e.:
(1)
where the coefficients of the regression are:
(2)
(3)
and
(4)
In the above three equations, c 5u 1 (1 2u)2, where u is the
recom-bination fraction between the trait and marker locus and s2 is the
variance with subscript g, d, and e standing for the genetic, domi-nance, and residual components. The heritability (the contribution of the marker loci or nearby genetic region to the variance of the quanti-tative trait) can be defined as:
(5)
It has been shown (13) that when the parental marker data are avail-able and the marker is codominant, the estimated coefficient of the
E Y( )j =α βπ+ j+γflj;
α 2ψσg 2
σe 2
2ψ(1–ψ) σd 2
,
+ +
=
β 2 1( –2ψ) σg 2
, =
γ (1–ψ) σd 2
. =
h2 σg 2 = / σg
2
σe 2 +
( ).
regression of Yj on pj, ignoring fj, is an unbiased estimator of b,
irre-spective of what the values of sg2 or u may be. Assuming no
domi-nance (sd25 0) and no recombination (u 5 0, as is the case for the
candidate gene approach), Eqs. 1–3 can be rewritten as:
(6)
and
(7)
(8)
As a supplement to the sib-pair method, an additional method was used to estimate the contribution of locus variation in the LPL gene to systolic blood pressure levels in this data set. At a given locus, in analytic terms, a sib-pair can be considered to be equivalent to a monozygotic twin pair (sharing two alleles identical-by-descent), a dizygotic twin pair (sharing one allele identical-by-descent), or a pair of totally unrelated individuals (sharing zero), respectively. This for-mulation enables the estimation of heritability from twin data by cal-culating the contribution of locus variation in the LPL gene to systolic blood pressure levels (39). If we assume that there are no genotype– environment interactions, we have a lower estimate of heritability re-ferred to as H (proportion of variance due to genetic factors by the authors [39]):
(9)
and the standard error:
(10)
where VMZ and VDZ are the variances (between a sibpair) of n1
sib-pairs sharing two LPL alleles identical-by-descent and n2 sib-pairs
sharing one LPL allele identical-by-descent, respectively.
Results
Descriptive statistics and sib-sib correlations for systolic and di-astolic blood pressures. Only nondiabetic offspring were in-cluded in this study to avoid the potentially confounding ef-fects of NIDDM on blood pressure. Raw systolic and diastolic blood pressure values in these nondiabetic offspring are shown in Fig. 1; normal distributions were observed. All individuals were normotensive, except for three individuals with mildly el-evated blood pressures (defined as diastolic blood pressure
E Y( )j =α βπ+ j
α 2σg 2
2σe 2 + =
β 2σg 2 – =
H = (VDZ–VMZ)/VDZ,
S E2( )H 2 V( MZn2)
2
n1–1
( )(n1+n2–4)
VDZn1 ( )2
n2–3
( )2
n2–5
( )
[image:4.612.53.550.555.740.2]---; =
2114 Wu et al.
. 90 mmHg). No nondiabetic individuals were taking
medica-tion before or at the time of study. Table II lists the mean (6SD) age, BMI, systolic blood pressure, diastolic blood pres-sure, fasting glucose, and fasting insulin of the 126 nondiabetic offspring who were genotyped within these 48 Chinese nuclear families. This is a relatively lean population, with a mean BMI of 23. Sib-sib correlations were 0.18 for systolic blood pressure (P, 0.02 in 126 sib-pairs), and 0.21 for diastolic blood pres-sure (P, 0.005 in 126 sib-pairs).
Evidence for linkage of systolic blood pressure to the LPL locus on 8p22. We obtained significant evidence for linkage of the LPL gene locus to adjusted systolic blood pressure (P5
0.002 in 125 sib-pairs), but not adjusted diastolic blood pres-sure (P5 0.73). As one way to control for potential type I er-ror, we further genotyped five flanking simple sequence repeat polymorphism (SSRP) markers, consisting of two telomeric markers and three centromeric markers. Four of these five markers demonstrated evidence for linkage with systolic blood pressure, and again none demonstrated any evidence for link-age with diastolic blood pressure (Table III). Two of the mark-ers, D8S282 and neurofilament light polypeptide (NEFL), yielded levels of significance which further support the linkage of LPL locus to systolic blood pressure. Since the levels of sig-nificance may be dependent on the informativeness of differ-ent markers in individual families, Table III reports the het-erozygosity index calculated from this population for each marker. The LODLINK program of S.A.G.E. package was used for calculating two-point linkage distances among LPL and the five other flanking markers. The LOD scores for these two-point linkage analyses ranged from 15 to 21. Fig. 2 gives
the graphic P values and genetic distances among these six
linked markers. The genetic distances calculated from this data set for these six linked markers are comparable with those published previously (20, 29).
Since one or both parents can be homozygous for a given marker, the identical-by-descent status of a sib-pair in such a case will not be fully determined. This could potentially intro-duce statistical noise (i.e., loss of power) into our sib-pair link-age analysis. We therefore further analyzed our data, limiting this latter analysis to only those families with fully informative matings for the two most informative markers, LPL and D8S282. Fig. 3 A shows these latter linkage results (a negative regression line) of adjusted systolic blood pressure versus the LPL locus on chromosome 8p22 (81 sib-pairs, P5 0.001). In contrast, no linkage (a horizontal regression line) was ob-served for adjusted diastolic blood pressure with the LPL locus (81 sib-pairs, P5 0.97, Fig. 3 B). We observed similar results for the marker D8S282 which, based on the calculations with this data set, is 3 cM from the LPL locus. Fig. 4, A and B,
sum-marizes these linkage data of the D8S282 locus with adjusted systolic blood pressure (P5 0.0035 and n 5 78) and diastolic blood pressure (P5 0.56 and n5 78) in those families with fully informative parental matings.
The contribution of locus variation in the LPL gene to sys-tolic blood pressure levels and intraclass correlations among sib-pairs sharing two, one, and zero LPL alleles identical-by-descent. In this data set, there were 89 sib-pairs in which shar-ing two, one, and zero LPL alleles identical-by-descent can be unambiguously determined. As expected from the linkage
data, we obtained a strong positive correlation, r 5 0.37,
among those sib-pairs sharing both LPL alleles identical-by-descent and very interestingly, a negative correlation, r 5 20.40, among those sib-pairs sharing zero LPL allele identical-by-descent. Fig. 5 shows the scatter plot of raw systolic blood pressure for siblings sharing two, one, and zero LPL alleles identical-by-descent. Allelic variation around the LPL gene accounted for 73% of the total interindividual variation in ad-justed systolic blood pressure levels by the sib-pair method. By using the twin derived methodology, an estimate of 52% with a standard error of 19% was obtained for the percent contribu-tion of this locus.
Examination of other candidate gene loci for blood pres-sure. We also tested three other candidate gene loci that have been specifically hypothesized to have a role in the determina-Table II. Chinese NIDDM Families: Descriptive Statistics in
126 Nondiabetic Offspring
Trait Mean6SD
Age (yr) 3469
BMI (kg/m2) 2363
Systolic blood pressure (mmHg) 115613
Diastolic blood pressure (mmHg) 7469
Fasting glucose (mg/dl) 88612
[image:5.612.57.295.83.180.2]Fasting insulin (ml/ml) 1567
Table III. Evidence for Linkage of Systolic Blood Pressure to the LPL Gene Region on Chromosome 8p22
Marker locus
Heterozygosity index
Systolic blood pressure Diastolic blood pressure
No. of pairs P value No. of pairs P value
D8S265 0.34 120 0.14 120 0.97
D8S261 0.70 129 0.02 129 0.28
LPL 0.81 125 0.002 128 0.73
D8S282 0.81 126 0.0002 129 0.75
D8S133 0.79 118 0.01 119 0.26
[image:5.612.312.556.84.198.2]NEFL 0.74 123 0.001 126 0.29
[image:5.612.317.553.512.711.2]tion of blood pressure: the ACE gene locus on chromosome 17q23, the angiotensinogen gene locus on chromosome 1q42-43, and the renin gene locus on chromosome 1q32. Three poly-morphic markers, one within the ACE gene and two flanking SSRP markers, were genotyped for testing the linkage with
[image:6.612.59.550.56.315.2]ACE and the results of this analysis are given in Table IV. No evidence for linkage with ACE for either systolic blood pres-sure or diastolic blood prespres-sure was observed in the offspring (Table IV). For the angiotensinogen gene locus, we typed one RFLP marker and one flanking SSRP marker. Again, no evi-Figure 3. Significant regression of squared trait differences for blood pressure levels versus the number of LPL alleles that a sib-pair shares iden-tical-by-descent (IBD). This figure includes only those sib-pairs whose LPL marker IBD genotypes could be definitely assigned to sharing ex-actly two, one, and zero alleles at the LPL locus. (A) Systolic blood pressure; (B) diastolic blood pressure.
[image:6.612.61.552.442.692.2]2116 Wu et al.
[image:7.612.61.550.57.278.2]dence for linkage of the angiotensinogen locus with either sys-tolic blood pressure or diassys-tolic blood pressure was observed (Table IV). The renin gene locus was examined for linkage by typing an SSRP marker within the renin gene. Again, we did not observe evidence for linkage of this locus to a locus con-trolling either systolic blood pressure or diastolic blood pres-sure variation in this population (Table IV).
Other candidate gene loci tested in this population. We also tested a number of other candidate gene loci in this population at high risk for NIDDM (Table I). None of these loci, related to either glucose/insulin or lipid metabolism, showed evidence for linkage (P, 0.05) with either systolic blood pressure or di-astolic blood pressure.
Discussion
In an effort to identify genetic factors contributing to the asso-ciation between NIDDM and blood pressure, we have exam-ined the gene markers residing within or near various candi-date genes in families ascertained through probands with NIDDM. Quantitative sib-pair linkage analysis of the unaf-fected offspring of these families revealed evidence of linkage of systolic blood pressure to the LPL gene locus on chromo-some 8. Linkage was further supported with several closely linked informative markers. Allelic variation around the LPL gene locus accounted for an estimate of 52–73% of the total in-terindividual variation in systolic blood pressure levels in this data set, though this estimate has a large confidence interval. In contrast, no evidence of linkage with blood pressures was observed with markers at the ACE gene locus on chromosome 17q23, the angiotensinogen gene locus on chromosome 1q42-43, and the renin gene locus on chromosome 1q32.
The pathophysiologic basis of the linkage of the LPL gene with systolic blood pressure is not apparent at this time. In-deed, it could be argued that the association between blood pressure and the gene that codes for an extracellular enzyme that hydrolyzes triglycerides in plasma is unlikely to have any physiological meaning. On the other hand, there are recent
[image:7.612.315.554.573.739.2]ob-servations that suggest that there may well be a functional rela-tionship between mutations in the LPL gene and blood pres-sure. For example, it has been shown in one pedigree that heterozygotes with a specific missense mutation at codon 188 of the LPL gene were hypertensive when they were both over 40 yr old and hypertriglyceridemic (40–42). Moreover, a recent unpublished study of a number of families with different LPL mutations showed that individuals who were heterozygous for different LPL mutations had higher systolic blood pressure than their homozygous normal siblings (Sprecher, D., personal communication). Consistent with a possible role of the LPL gene in the regulation of blood pressure was the finding that the gene is located near the peak P value for the various mark-ers at the chromosome 8 locus linked with systolic blood pres-sure (Fig. 2). The fact that the LPL gene does not occur pre-cisely at the peak could be due to differences in informativeness of the markers in certain families which contribute differen-tially to the sib-pair linkage analysis, depending on the extent of variation of blood pressure in individual families. Therefore, Figure 5. Scatter plot of systolic blood pressure levels for sibling pairs sharing both LPL alleles (A), one LPL allele (B), or zero LPL alleles (C) identical-by-descent (IBD).
Table IV. Lack of Linkage of Blood Pressure to Vascular Candidate Gene Loci
Marker locus
Systolic blood pressure Diastolic blood pressure
No. of pairs P value No. of pairs P value
ACE locus on chromosome 17q23
ACE I/D 139 0.50 139 0.73
Growth hormone 137 0.26 137 0.49
D17S787 119 0.23 119 0.85
Angiotensinogen locus on chromosome 1q42–43
AGTN RFLP 139 0.11 138 0.87
AGTN SSRP 119 0.98 119 0.77
Renin gene locus on chromosome 1q32
uninformativeness of the LPL markers in one or more families with informative mating regarding systolic blood pressure phe-notypes, e.g., one sib low and one sib high, could explain the difference in P values in the sib-pair linkage analysis from one marker locus to the next. In the future, with the continued de-velopment of nonparametric linkage methodology, ap-proaches such as interval mapping of QTL proposed by Fulker and Cardon (43) could be applied to further narrow this inter-val. On the other hand, it is also possible that a gene other than LPL in this region is responsible for association with systolic blood pressure. For example, Hoehe et al. (44) reported that alpha-1C adrenergic receptor gene is closely linked (u 5 0.03) to the NEFL gene, which itself located about 11 cM centro-meric to the LPL gene. Obviously, the ultimate significance of the linkage between the LPL gene and systolic blood pressure observed in this study will depend upon further experiments aimed at evaluating that issue directly.
The quantitative contribution of variation at the LPL locus to systolic blood pressure levels was estimated by two different methods, i.e., sib-pair linkage and twin derived methodologies. Two estimates of the contribution of variation or heritability at the LPL locus to systolic blood pressure levels, 73 and 52%, re-spectively, were obtained with a standard error that would in-clude the range 14–18% to 90% to 94% for the latter one. Her-itability estimates for systolic blood pressure have ranged from 13 to 82% in various studies, with average levels of z 50%
(45). One classic twin study on MZ twins and their families yielded an estimate of 0.47 for the heritability of systolic blood pressure (46).
The renin-angiotensin system plays an important role in the functioning of cardiovascular system and the regulation of blood pressure (47). Neither the renin or the ACE genes have shown evidence for linkage with blood pressure in humans, al-though the renin gene variations influence blood pressure in rodent models (48). The angiotensinogen gene, on the other hand, exhibits linkage to essential hypertension in certain hu-man populations (35, 49) and in rodent models (50). In the population studied herein, no evidence of significant linkage was observed between renin, angiotensinogen, or the ACE gene loci and either measure of blood pressure. The failure to observe linkage with the angiotensinogen gene locus in our study may be due to population differences or the fact that the subjects in our population did not, in general, exhibit elevated blood pressure and were not primarily ascertained from fami-lies with hypertension. Both of these explanations imply that variation in human blood pressure can occur by different ge-netic mechanisms as a function of either ethnicity or disease process. In addition to these candidate gene approaches, tenta-tive evidence has been reported for a locus contributing to di-astolic blood pressure on the short arm of chromosome 1, us-ing classical protein polymorphic markers (51).
Some discussion regarding the statistical methods used in this study is warranted. The underlying basis for quantitative sib-pair linkage method is to compare the quantitative varia-tion in a trait between siblings as a funcvaria-tion of the marker alleles they share identical-by-descent at the test locus (12, 13, 52). When compared with the LOD score method, this approach has a major advantage of not requiring specification of a ge-netic model. This is particularly important for studying a com-plex trait such as blood pressure. The linkage of a gene con-trolling systolic blood pressure to the LPL gene locus on chromosome 8p22 should be considered preliminary, as should
all first linkage reports, especially for complex phenotypes. However, we feel that the systolic blood pressure linkage re-sult has a favorable likelihood of confirmation, given: (a) the robustness of the analysis to various restrictions on informa-tiveness of parental marker genotypes; (b) four linked markers in a 20 cM region flanking the LPL locus all providing evi-dence for linkage of systolic blood pressure; (c) published data showing that mutations in the LPL gene are associated with higher blood pressure; and (d) alternatively, that there is an-other prime candidate gene in this region, the alpha-1C adren-ergic receptor gene, which is physiologically related to regula-tion of blood pressure in human beings.
In conclusion, quantitative sib-pair analysis in the nondia-betic members of Chinese type II diabetes families living in Taiwan has provided evidence for genetic linkage between the D8S261, LPL, D8S282, and NEFL loci, all located on chromo-some 8p22, and a putative gene determining systolic blood pressure. Allelic variation at the LPL gene locus accounted for an estimated 52–73% of the total interindividual variation in systolic blood pressure levels in this data set. Because blood pressure is a major risk factor for coronary heart disease, it will be important to determine whether essential hypertension or hypertension in diabetic patients is linked to this identified locus.
Acknowledgments
This work was supported by National Institutes of Health grants 42481 (A.J. Lusis, C.H. Warden, X. Bu, and J.I. Rotter) and HL-08506 (G.M. Reaven and Y.-D.I. Chen). D.-A. Wu, D.D.C. Shen, C.-Y. Jeng, W.H.H. Sheu, and M.M.T. Fuh were supported by grant DOH 83,84-HR-302 (National Health Research Institute, Taiwan). J.I. Rotter and X. Bu were also supported by a grant from the Stuart Foundations, GCRC grant RR0042525S3, and the Cedars-Sinai Board of Governors’ Chair in Medical Genetics. The results of sib-pair analysis and two-point linkage analysis were obtained by using the program package S.A.G.E., which is supported by U.S. Public Health Service resource grant 1 P41 RR03655 from the Division of Research Resources.
References
1. Rich, S. 1990. Mapping genes in diabetes: genetic epidemiological
per-spective. Diabetes. 39:1315–1319.
2. Warram, J.H., B. C. Martin, A.S. Krolewski, J.S. Soeldner, and C.R. Kahn. 1990. Slow glucose removal rate and hyperinsulinemia precede the
de-velopment of type II diabetes in the offspring of diabetic parents. Ann. Intern.
Med. 113:909–915.
3. Rotter, J.I., C.M. Vadheim, and D.L. Rimoin. 1992. Diabetes mellitus. In
The Genetic Basis of Common Diseases. R.A. King, J.I. Rotter, and A.G. Mo-tulsky, editors. Oxford University Press, New York. 413–481.
4. Reaven, G.M. 1988. Role of insulin resistance in human disease.
Diabe-tes. 37:1595–1607.
5. Leahy, J.L., and A.E. Boyd III. 1993. Diabetes genes in
non-insulin-dependent diabetes mellitus. N. Engl. J. Med. 328:56–57.
6. Królewski, A.S., A. Czyzyk, J. Kopczynski, and S. Rywik. 1981. Preva-lence of diabetes mellitus, coronary heart disease and hypertension in the
fami-lies of insulin dependent and insulin independent diabetes. Diabetologia. 21:
520–524.
7. Eriksson, J., A. Franssila-Kallunki, A. Ekstrand, C. Saloranta, E. Widen, C. Schalin, and L. Groop. 1989. Early metabolic defects in persons at increased
risk for non-insulin-dependent diabetes mellitus. N. Engl. J. Med. 321:337–343.
8. Laws, A., M.L. Stefanick, and G.M. Reaven. 1989. Insulin resistance and hypertriglyceridemia in nondiabetic relatives of patients with
noninsulin-dependent diabetes mellitus. J. Clin. Endocrinol. & Metab. 69:343–347.
9. Ho, L.T., Z.Y. Chang, J.T. Wang, S.H.Li, Y.F. Liu, Y.D.I. Chen, and G.M. Reaven. 1990. Insulin insensitivity in offspring of parents with type 2
dia-betes mellitus. Diabetic. Med. 7:31–34.
10. Klein, R., B.E.K. Klein, S.E. Moss, and D.L. DeMets. 1986. Blood
pres-sure and hypertension in diabetes. Am. J. Epidemiol. 122:75–89.
dia-2118 Wu et al.
stolic blood pressure and risk of coronary heart disease. Am. J. Cardiol. 27:335–
346.
12. Haseman, J.K., and R.C. Elston. 1972. The investigation of linkage
be-tween a quantitative trait and a marker locus. Behav. Genet. 2:3–19.
13. Amos, C.I., R.C. Elston, A.F. Wilson, and J.E. Bailey-Wilson. 1989. A
more powerful robust sib-pair test of linkage for quantitative traits. Genet.
Epi-demiol. 6:435–449.
14. S.A.G.E. Statistical analysis for genetic epidemiology, release 2.1. 1992. Computer program package available from the Department of Biometry and Genetics, Louisiana State University Medical Center, New Orleans.
15. National Diabetes Data Group International Workgroup. 1979.
Classifi-cation of diabetes mellitus and other categories of glucose intolerance.
Diabe-tes. 28:1039–1057.
16. Kadish, A.H., R.L. Litle, and J.C. Sternberg. 1968. A new and rapid method for determination of glucose by measurement of rate of oxygen
con-sumption. Clin. Chem. 14:116–131.
17. Hales, C.N., and P.J. Randle. 1963. Immunoassay of insulin with
insulin-antibody precipitate. Biochem. J. 88:137–146.
18. Tanizawa, Y., K.C. Chiu, M. A. Province, R. Morgan, D.R. Owens, A. Ress, and M.A. Permutt. 1993. Two microsatellite repeat polymorphisms flank-ing opposite ends of the human glucokinase gene: use in haplotype analysis of
Welsh Caucasians with type 2 (non-insulin-dependent) diabetes mellitus.
Dia-betologia. 36:409–413.
19. Economou, E.P., A.W. Bergen, A.C. Warren, and S.E. Antonarakis. 1990. The polydeoxyadenylate tract of Alu repetitive elements is polymorphic
in the human genome. Proc. Natl. Acad. Sci. USA. 87:2951–2954.
20. Gyapay, G., J. Morissette, A. Vignal, C. Dib, C. Fizames, P. Millasseau, S. Marc, G. Bernardi, M. Lathrop, and J. Weissenbach. 1994. The 1993-1994
Genethon human genetics linkage map. Nat. Genet. 7:246–339.
21. Patel, M.S., B.S. Mankoo, and P.M. Brickell. 1992. A polymorphic mi-crosatellite repeat is located close to the promoter region of the c-fgr
proto-oncogene (FGR) at chromosome 1p36.2-p36.1. Hum. Mol. Genet. 1:65.
22. Stoffel, M., R. Espinosa, S. R. Keller, G.E. Lienhard, M.M. Le Beau, and G.I. Bell. 1993. Human insulin receptor substrate-1 (IRS1): chromosomal localization to 2q35-q36.1 and identification of a simple tandem repeat DNA
polymorphism. Diabetologia. 36:335–337.
23. Glaser, B., K.C. Chiu, R. Anker, A. Nestorowicz, H. Landau, H. Ben-Basset, Z. Shlomai, N. Kaiser, P. S. Thronton, C. A. Stanley, et al. 1994. Famil-ial hyperinsulinism maps to chromosome 11p14-15.1 cM centromeric to the
in-sulin gene. Nat. Genet. 7:185–188.
24. Bu, X., C. H. Warden, Y. R. Xia, C. DeMeester, D.L. Puppione, S. Te-ruya, B. Lokensgard, S. Daneshmand, J. Brown, R.J. Gray, J.I. Rotter, and A.J. Lusis. 1994. Linkage analysis of the genetic determinants of high density lipo-protein concentrations and composition: evidence for involvement of the
apoli-poprotein A-II and cholesterol ester transfer protein loci. Hum. Genet. 93:636–
648.
25. Zuliani, G., and H.H. Hobbs. 1990. Tetranucleotide repeat
polymor-phism in the apolipoprotein C-III gene. Nucl. Acids Res. 18:4299.
26. Weber, J.L., and P.E. May. 1989. Abundant class of human DNA
poly-morphisms which can be typed using the polymerase chain reaction. Am. J.
Hum. Genet. 44:388–396.
27. Hudson, T.J., M. Engelstein, M.K. Lee, E.C. Ho, M.J. Rubenfield, C.P. Adams, D.E. Houseman, and N.C. Dracopoli. 1992. Isolation and chromosomal assignment of 100 highly informative human simple sequence repeat
polymor-phisms. Genomics. 13:622–629.
28. Wood, S., M. Schertzer, M. Hayden, and Y. Ma. 1993. Support for founder effect for two lipoprotein lipase (LPL) gene mutations in French
Cana-dians by analysis of GT microsatellites flanking the LPL gene. Hum. Genet. 91:
312–316.
29. Matise, T.C., M. Perlin, and A. Chakravarti. 1994. Automated construc-tion of genetic linkage maps using an expert system (MultiMap): a human
ge-nome linkage map. Nat. Genet. 6:384–390.
30. Rogaev, E., E. Rogaeva, W.J. Lukiw, G. Vaula, Y. Liang, R. Hancock, D.C. McLachlan, and P.H. St. George-Hyslop. 1992. An informative microsat-ellite repeat polymorphism in the human neurofilament light polypeptide
(NEFL) gene. Hum. Mol. Genet. 1:781.
31. Wood, S., H.K. Mitchell, and M. Schertzer. 1991. Isolation and analysis of dinucleotide repeat polymorphisms from a flow-sorted chromosome 8
li-brary. Cytogenet. Cell Genet. 58:1932.
32. Cambien, F., O. Poiner, L. Lacerf, A. Evans, J.P. Cambou, D. Arveiler, G. Luc, J.M. Bard, L. Bara, S. Ricard, et al. 1992. Deletion polymorphism in the gene for angiotensin-converting enzyme is a potent risk factor for myocardial
infarction. Nature (Lond.). 359:641–644.
33. Jeunemaitre, X., R.P. Lifton, S.C. Hunt, R.R. Williams, and J.-M. La-louel. 1992. Absence of linkage between the angiotensin converting enzyme
lo-cus and human essential hypertension. Nat. Genet. 1:72–75.
34. Edwards, A., H.A. Hammond, L. Jin, C.T. Caskey, and R. Chakraborty. 1992. Genetic variation at five trimeric and tetrameric tandem repeat loci in
four human population groups. Genomics. 12:241–253.
35. Jeunemaitre, X., F. Soubrier, Y.V. Kotelevtser, R.P. Lifton, C.S. Will-iams, A. Charru, S.C. Hunt, P.N. Hopkins, R.R. WillWill-iams, J.M. Lalouel, and P. Corvol. 1992. Molecular basis of human hypertension: role of angiotensinogen.
Cell. 71:169–180.
36. Kotelevtsev, Y.V., E. Clauser, P. Corvol, and F. Soubrier. 1991.
Dinu-cleotide repeat polymorphism in the human angiotensinogen gene. Nucl. Acids
Res. 19:6978.
37. Dixon, W.J. 1992. BMDP Statistical Software Manual. University of California Press, Berkeley.
38. Boerwinkle, E., C.C. Leffert, J. Lin, C. Lackner, G. Chiesa, and H. Hobbs. 1992. Apolipoprotein(a) gene accounts for greater than 90% of the
variation in plasma lipoprotein(a) concentrations. J. Clin. Invest. 90:52–60.
39. Cavalli-Sforza, L.L., and W.F. Bodmer. 1971. The Genetics of Human Populations. W.H. Freeman and Company, San Francisco. 573–597.
40. Williams, R.R., S.C. Hunt, S.J. Hasstedt, P.N. Hopkins, L.L. Wu, T.D. Berry, B. M. Stults, G. K. Barlow, M. Catherine-Schmacher, R.P. Lifton, and J.M. Lalouel. 1990. Multigenic human hypertension: evidence for subtypes and hope
for haplotypes. J. Hyperten. 8(Suppl. 7):S39–S46.
41. Williams, R.R., S.C. Hunt, P.N. Hopkins, L.L. Wu, S. J. Hasstedt, T.D. Berry, B.M. Barlow, M. C. Schumacher, E.H. Ludwif, S.C. Elbein, et al. 1993. Genetic basis of familial dyslipidemia and hypertension: 15-year results from
Utah. Am. J. Hyperten. 6:319S–327S.
42. Wilson, D.E., M. Emi, P.H. Iverius, A. Hata, L.L. Wu, E. Hillas, R.R. Williams, and J. M. Lalouel. 1990. Phenotypic expression of heterozygous lipo-protein lipase deficiency in the extended pedigree of a proband homozygous for
a missense mutation. J. Clin. Invest. 86:735–750.
43. Fulker, D.W., and J.R. Cardon. 1994. A sib-pair approach to interval
mapping of quantitative trait loci. Am. J. Hum. Genet. 54:1092–1103.
44. Hoehe, M.R., W.H.Berrettini, D.A. Schwinn, and W.T. Hsieh. 1992. A
two-allele Pstl RFLP for the alpha-1C adrenergic receptor gene (ADRA1C).
Hum. Mol. Genet. 1:349.
45. Hopkins, P.N., and R.R. Williams. 1989. Human genetics and coronary
heart disease: a public health perspective. Ann. Rev. Nutr. 9:303–345.
46. Ewell, L.W., W.E. Nance, L.A. Corey, J.A. Boughman, and P.M.
Win-ter. 1978. Blood pressure studies on monozygotic twins and their families. In
Twin Research: Clinical Studies. W.E. Nance, editor. Alan R. Liss, Inc., New York. 29–38.
47. MacGregor, G.A., N.D. Markandu, J.E. Roulston, J.C. Jones, and J.J. Morton. 1981. Maintenance of blood pressure by the renin-angiotensin system
in normal man. Nature (Lond.). 291:329–331.
48. Kurtz, T.W., I. Simonet, K.M. Potear, S. Wolfe, L. Chan, and P.I. Hjelle. 1990. Cosegregation of the renin allele of the spontaneously hypertensive rat
with an increase in blood pressure. J. Clin. Invest. 85:1328–1332.
49. Caulfield, M., P. Lavender, M. Farrall, P. Munroe, M. Lawson, P. Turner, and A.J.L. Clark. 1994. Linkage of the angiotensinogen gene to
essen-tial hypertension. N. Engl. J. Med. 330:1629–1633.
50. Kimura, S., J.J. Mullins, B. Bunnenann, R. Metzger, U. Hilgenfeldt, F. Zimmermann, H. Jacob, K. Fuxe, D. Ganter, and M. Kahing. 1992. High blood
pressure in transgenic mice carrying the rat angiotensinogen gene. EMBO
(Eur. Mol. Biol. Organ.) J. 11:821–827.
51. Wilson, A.F., R.C. Elston, L.D. Tran, and R.M. Siervogel. 1991. Use of the robust sib-pair method to screen for single-locus, multiple-locus, and
pleio-tropic effects: application to traits related to hypertension. Am. J. Hum. Genet.
48:862–872.
52. Ott, J. 1991. Methods of linkage analysis: nonparametric approaches. In