Journal of Chemical and Pharmaceutical Research, 2016, 8(3):217-224
Research Article
CODEN(USA) : JCPRC5
ISSN : 0975-7384
Model-based kinetic parameters estimation in batch Pullulan fermentation
using Jaggery as substrate
V. S. Rama Krishna Ganduri
1,3, Ushakiranmayi Mangamuri
2, M. Vijayalakshmi
2and Sudhakar Poda
3*1Department of Biotechnology, K L University, Green Fields, Vaddeswaram, Guntur District, 522502, Andhra
Pradesh, India
2Department of Botany and Microbiology, Acharya Nagarjuna University, Nagarjunanagar, Guntur, 522510,
Andhra Pradesh, India
3
Department of Biotechnology, Acharya Nagarjuna University, Nagarjunanagar, Guntur, 522510, Andhra Pradesh, India
_____________________________________________________________________________________________
ABSTRACT
The research was focused on validation of unstructured, mathematical, kinetic model data obtained in batch shake-flask studies of Pullulan produced by Aureobasidium pullulans MTCC 2195. Logistic (L), Logistic Incorporated Leudeking-Piret (LILP) and Logistic Incorporated Modified Leudeking-Piret (LIMLP) models were used for kinetic parameters estimation. Very good fit of the data was observed between the experimental data and modelled data in biomass growth, substrate consumption and product formation kinetics. Estimated kinetic parameters like µmax, X0,
Xm, α, β, γ, and η, were compared for initial Jaggery and Sucrose (as substrate) concentrations of 50, 75 and 100
g/L. Furthermore, all these parameters were predicted accurately with reasonable R2 values.
Keywords: Kinetic model, Pullulan, Jaggery, Sucrose, Validation.
_____________________________________________________________________________________________
INTRODUCTION
Aureobasidium pullulans, a polymorphic fungus, produces an extracellular and linear polysaccharide called pullulan, which consists of maltotriose subunits interlinked by (1→6)-α-D-glucosidic and α-(1→4)-glycosidic bonds
[1, 2]. Due to distinctive physical, chemical and biological properties, pullulan offers excellent applications in food, pharma, cosmetic and packaging industries and environmental clean-up agents [3, 4, 5]. Several researchers varied the strategies for successful production of pullulan includes: effects of carbon substrates and their sources [6, 7, 8, 9, 10, 11]; operational parameters like shear stress, agitation, aeration, DO levels, etc. [12, 13]; medium optimization studies [14], etc.
Mathematical models of fermentation offer knowledge of kinetic and metabolic nature of product and also account biomass as one variable to represent the overall kinetics. Several rate models were successfully proven to estimate the kinetic parameters for growth studies in variety of biopolymers [15, 16, 17, 18, 19]. A very useful unstructured kinetic model for pullulan fermentation was developed for A.pullulans growth, limited substrate consumption and pullulan production [20, 21, 22, 23].
The logistic function model developed by Pearl and Reed, 1920 [24], can be applied to A.pullulans growth and logistic equation proposed by Mulchandani et al., 1988 [25] was used to calculate the kinetics of batch cultivation of microbial polysaccharide production. These models explain the microbial growth as a function of maximum cell concentration (Xm), maximum specific growth rate and time. Mohammad et al., 1995 [6] developed the use of
Pullulan production was initiated in the late exponential phase, which was more even higher when cells approach stationary phase [3, 26]. In the present investigation, experimental data obtained in shake-flask studies of pullulan fermentation using Jaggery as a new substrate with developed kinetic models were validated.
EXPERIMENTAL SECTION
Microorganism and culture media:
In this study, Aureobasidium pullulans MTCC 1991 obtained from Microbial Type Culture Collection and Gene Bank (MTCC), Institute of Microbial Technology (IMTECH), Chandigarh was procured to produce pullulan from Jaggery as carbon substrate. A. pullulans was maintained on potato dextrose agar (PDA) and grown on standard cultivation media with a composition of sucrose: 50.0 g/L; yeast extract: 3.0 g/L; KH2PO4: 5.0 g/L; KCl: 0.5 g/L;
MgSO4 · 7H2O: 0.2 g/L; NaCl, 1.0 g/L in 1 liter of distilled water. Jaggery was purchased from local market and
sucrose was replaced by jaggery in standard cultivation media and used further in shake flask fermentation studies.
Studies of shake flask fermentations were carried out with standard cultivation medium containing sucrose and also medium containing jaggery with varying concentrations of 50, 75 and 100 g/L. All the preparations were made to 100 ml aliquots in 500 ml Erlenmeyer flasks and sterilized. The sterilized media was incubated on an orbital incubator shaker at 300C and 150 rpm for 172 hours, after inoculating with 5% (v/v) inoculum. At regular intervals, samples from shake flasks were drawn and analyzed for dry cell weight of biomass, pullulan and sugar content. All the experiments were carried out in triplicates and the average values of data were used.
Biomass (cell dry weight), Pullulan and Sugar (residual) content estimation:
Estimation of dry cell weight of A.pullulans was followed as per Vijayendra et al., 2001 [27] and the residual sugar content in fermentation broth supernatant was measured as per Miller’s 1959 [28] method. Produced pullulan was estimated by solvent precipitation, subsequent filtration and drying [27, 29, 30].
Kinetic study model:
The kinetic models for cell growth, substrate consumption and pullulan (as product) synthesis in a batch system was developed by many researchers [6, 20, 21, 22, 23]. Under optimal growth conditions, growth kinetic model of A. pullulans (X) (as per Malthus’s law), in a batch fermentation is given as:
= 1 − (1)
The Logistic (L)- type model equation derived from the integration of above equation results:
( ) = ( ) (2)
A plot of ln (( ( )) vs t will yield maximum specific growth rate of biomass, µmax as slope.
The substrate utilization kinetics in microbial polysaccharide production can be taken from Modified Leudeking-Piret (MLP) equation:
− = = + " (3)
Logistic Incorporated Modified Leudeking-Piret (LIMLP) equation derived from integration of above equation results:
#( ) = #$− % ( )− $& +(' )* +1 − (1 − ,( )- (4)
Non-growth associated constant, η, in above equation can be calculated from stationary phase data (where = 0):
" =
/0
/ 1 234 56 78 19 (5)
And, a plot of (S0 – S(t))+(' )* +1 − (1 − ,( )- vs % ( )− $& will yield
Product formation kinetics follows Leudeking-Piret equation, as: := ; + <
(6)
Logistic Incorporated Leudeking-Piret (LILP) equation derived from integration of above equation results:
=( ) = =$+ ; % ( )− $& +>( )* +1 − (1 − ,( )- (7)
β, non-growth associated parameter can be determined from stationary phase data (where = 0):
< =
/?
/ 1 234 56 78 19 (8)
A plot of (Pt-P0) +
>
( )* +1 − (1 − ,( )- vs % ( )− $& yields growth-associated parameter,
α as slope.
In this study, equations (2), (4) and (7) were used to simulate the experimental data obtained in the shake-flask batch fermentations with initial sucrose and Jaggery concentrations of 50, 75 and 100 g/L. The software Microsoft Excel 2010 was employed to estimate the values of modelled kinetic parameters.
RESULTS AND DISCUSSION
Data, used in this study were taken from average of three shake-flask studies of pullulan fermentation. All models were developed in a manner that they contain growth related parameters. Mathematical models were evaluated between modelled data and experimental data and R-square values were also computed for all the plots.
Aureobasidium pullulans growth:
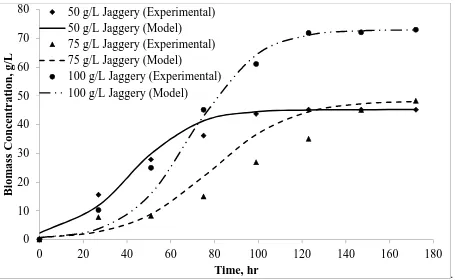
The lag phase of A.pullulans in fermentation was very short as the cells were already adapted before they were used for pullulan production. A.pullulans started to form pullulan instantly as the cells entered the logarithmic phase and therefore A.pullulans growth and pullulan production took place simultaneously. In order to validate the developed model, it is necessary to study the cell growth as function of time (i.e., Logistic growth). Sigmoidal curves are useful in describing the growth of organisms. The effect of initial substrate concentration changes on growth related parameters was done using 50, 75 and 100 g/L of jaggery and sucrose in batch fermentation for about 172 hrs. Other conditions of fermentation were kept at same values.
From experiments, maximum cell concentrations (Xm) were considered for the initial jaggery and sucrose
concentrations of 50, 75 and 100 g/L, respectively. Upon (linear) fitting the experimental data in to equation (2), Logistic (L) model equation parameters, maximum specific growth rate (µmax) and initial biomass concentrations
(X0) for increased concentrations of jaggery were determined. The resulting R2 values and calculated values were
summarized in Table 1. Figures 1 and 2 shows the comparison of experimental data and model predictions for A.pullulans growth from increasing concentrations of jaggery and sucrose, respectively.
Table 1. Kinetic parameters of Logistic (L) model for Aureobasidium pullulans growth on Jaggery and Sucrose
Parameters Initial Jaggery Concentration (g/L) Initial Sucrose Concentration (g/L)
50 75 100 50 75 100
µmax, hr-1 0.0706 0.0545 0.0679 0.048 0.0611 0.0586
R2 0.83 0.81 0.93 0.77 0.92 0.91
X0, g/L 2.28 0.667 0.636 4.29 0.547 1.0026
Xm, g/L 45.24 48.36 73.02 40 56 60.2
Table 2. Kinetic parameters of Logistic Incorporated Leudeking- Piret (LILP) model for Pullulan production on Jaggery and Sucrose
Parameters Initial Jaggery Concentration (g/L) Initial Sucrose Concentration (g/L)
50 75 100 50 75 100
α, g.P/g.X 0.069 0.2513 0.1895 0.0849 0.2227 0.1449
R2 0.81 0.83 0.98 0.84 0.91 0.94
.
Fig.1: Growth curves of A.pullulans fitted with the Logistic (L) model with increasing initial concentrations (50, 75 and 100 g/L) of Jaggery as substrate
[image:4.595.80.531.386.657.2].
Fig.2: Growth curves of A.pullulans fitted with the Logistic (L) model with increasing initial concentrations (50, 75 and 100 g/L) of Sucrose as substrate
Pullulan Production
Comparisons of pullulan production profile with Logistic Incorporated Leudeking-Piret (LILP) model (equation 7) were shown by plotting both the experimental data and the predicted values from the models in Figure 3 and 4. Figure 3 represents increasing concentrations of pullulan with increasing jaggery (as the initial substrate) concentrations (50, 75 and 100 g/L). Similar curves were also observed in case of increasing sucrose (as initial
0
10
20
30
40
50
60
70
80
0
20
40
60
80
100
120
140
160
180
B
iom
as
s
C
on
ce
n
tr
at
ion
, g/
L
Time, hr
50 g/L Jaggery (Experimental)
50 g/L Jaggery (Model)
75 g/L Jaggery (Experimental)
75 g/L Jaggery (Model)
100 g/L Jaggery (Experimental)
100 g/L Jaggery (Model)
0
10
20
30
40
50
60
70
0
20
40
60
80
100
120
140
160
180
B
iom
as
s
C
on
ce
n
tr
at
ion
, g/
L
Time, hr
50 g/L Sucrose (Experimental)
50 g/L Sucrose (Model)
75 g/L Sucrose (Experimental)
75 g/L Sucrose (Model)
substrate) concentrations (50, 75 and 100 g/L), in Fig. 4. The LILP model did properly fit the experimental data and the estimated kinetic parameters with resulted R2 values were listed in Table 2.
.
Fig.3: Profiles of produced Pullulan fitted with the Logistic Incorporated Leudeking-Piret (LILP) model with increasing initial concentrations (50, 75 and 100 g/L) of Jaggery as substrate
.
Fig.4: Profiles of produced pullulan fitted with the Logistic Incorporated Leudeking-Piret (LILP) model with increasing initial concentrations (50, 75 and 100 g/L) of Sucrose as substrate
Substrate (Jaggery and Sucrose) Consumption:
To study the substrate consumption in exopolysaccharide production, a Logistic Incorporated Modified Leudeking-Piret (LIMLP) model was applied. Subjective comparisons of actual substrate utilization by A. pullulans towards
0
2
4
6
8
10
12
14
16
18
20
0
20
40
60
80
100
120
140
160
180
P
u
ll
u
lan
C
on
ce
n
tr
at
ion
,
g/
L
Time, hr
50 g/L Jaggery (Experimental)
50 g/L Jaggery (Model)
75 g/L Jaggery (Experimental)
75 g/L Jaggery (Model)
100 g/L Jaggery (Experimental)
100 g/L Jaggery (Model)
0
2
4
6
8
10
12
14
16
18
20
0
20
40
60
80
100
120
140
160
180
P
u
ll
u
lan
C
on
ce
n
tr
at
ion
,
g/
L
Time, hr
50 g/L Sucrose (Experimental)
50 g/L Sucrose (Model)
75 g/L Sucrose (Experimental)
75 g/L Sucrose (Model)
pullulan production with LIMLP model were shown by plotting both experimental and predicted data from model. Figure 5 and 6 demonstrated the reasonable fit of experimental data with predicted values of model. Table 3 gives the comparison of estimated kinetic parameters of LIMLP models for initial Jaggery and sucrose concentration of 50, 75 and 100 g/L.
Table 3. Kinetic parameters of Logistic Incorporated Modified Leudeking- Piret (LIMLP) model for pullulan production on jaggery and Sucrose
Parameters Initial jaggery concentration (g/L) Initial sucrose concentration (g/L)
50 75 100 50 75 100
γ, g.S/g.X 0.8534 0.7817 1.0233 0.992 0.6138 1.2776
R2 0.96 0.61 0.82 0.965 0.66 0.88
η, g.S/(g.X.hr) 0.00168 0.003805 0.0023 0.0019 0.0017576 0.0027907
.
[image:6.595.63.550.536.684.2]Fig.5: Profiles of jaggery (as substrate) consumption fitted with the Logistic Incorporated Modified Leudeking-Piret (LIMLP) model with increasing initial concentrations (50, 75 and 100 g/L) of jiggery
Table 4. Comparison of kinetic parameters of L, LILP and LILMP models in Pullulan fermentation using different substrates
Kinetic Parameter
K. Thirumavalavan
et al., 2008 [29]
K.C.Cheng et al., 2010
[22]
Mohammad F.H.A.
et al., 1995 [6] In this study
Cashew Fruit Juice (g/L)
Sucrose (g/L)
Sucrose (g/L)
Jaggery (g/L)
Sucrose (g/L)
50 75.8 25 50 100 200 50 75 100 50 75 100
Logistic (L) Model parameters
µmax, hr-1 0.07 0.048 0.035 0.042 0.002 0.023 0.0706 0.0545 0.0679 0.048 0.0611 0.0586
X0, g/L 1.0 0.8 0.161 0.11 0.142 0.151 2.28 0.667 0.636 4.29 0.547 1.0026
Xm, g/L 92 28.3 0.501 0.792 0.923 0.721 45.24 48.36 73.02 40.0 56.0 60.2
Logistic Incorporated Leudeking-Piret (LILP) Model parameters
α, g.P/g.X 0.9 0.79 4.75 7.69 8.89 7.14 0.069 0.2513 0.1895 0.0849 0.2227 0.1449
β, .P/(g.X.hr) 0.001 0.0047 0.0092 0.01 0.0204 0.066 0.0014 0.00116 0.00071 0.0014 0.00042 0.00133
Logistic Incorporated Modified Leudeking-Piret (LIMLP) Model parameters
γ, g.S/g.X 0.98 2.61 3.67 3.16 4.8 5.6 0.853 0.7817 1.0233 0.992 0.6138 1.2776
η, .S/(g.X.hr) 0.001 0.007 0.008 0.0168 0.0168 0.064 0.0017 0.0038 0.0023 0.0019 0.00176 0.00279
0
20
40
60
80
100
120
0
20
40
60
80
100
120
140
160
180
Jagge
ry
C
on
ce
n
tr
at
ion
, g/
L
Time, hr
50 g/L Jaggery (Experimental)
50 g/L Jaggery (Model)
75 g/L Jaggery (Experimental)
75 g/L Jaggery (Model)
.
Fig.6: Profiles of sucrose (as substrate) consumption fitted with the Logistic Incorporated Modified Leudeking-Piret (LIMLP) model with increasing initial concentrations (50, 75 and 100 g/L) of sucrose
CONCLUSION
In this study, growth and non-growth related kinetic parameters, for an unstructured mathematical models of a batch shake-flask Pullulan fermentation using Aureobasidium pullulans using Jaggery and Sucrose (as substrate), were investigated and achieved. An increased concentrations (50, 75 and 100 g/L) of both Jaggery and sucrose were utilized for better pullulan production. Comparisons of parameters of Logistic (µmax, X0, Xm), Logistic Incorporated
Leudeking-Piret (α, β) and Logistic Incorporated Modified Leudeking-Piret (γ, η) models adequately fit the experimental results with predicted data. A good concurrence of the data was shown in A.pullulans growth, pullulan synthesis and jaggery & sucrose utilization profiles. Estimated values of kinetic parameters were also compared with literature (Table 4). The information obtained in this study would be helpful for further developments in scaled-up productions of Pullulan.
Acknowledgements
First and corresponding author thank the management of K L University, Green Fields, Vaddeswaram and Acharya Nagarjuna University, Nagarjuna Nagar, Guntur for their kind support.
REFERENCES
[1]S Ueda; Fujita K; Komatsu K; Nakashima Z, Appl. Microbiol., 1963, 11, 211-215.
[2]BJ Catley; A Ramsay; C Servis. Carbohy. Res, 1986, 153, 79–86.
[3]TD Leathers, Microbiol.Biotechnol, 2003, 62, 468–473.
[4]MR Rekha; CP Sharma. Trends Biomat. Artif.Organs, 2007, 20, 116-121.
[5]A Iyer; KH Mody; B Jha., Marine Pollu.Bull., 2005, 50, 340-343.
[6]FHA Mohammad; SM Badr-Eldin; OM El-Tayeb; OA Abd El-Rahman, Biomass Bioenergy, 1995, 8, 121-129.
[7]NS Madi; B McNeil; LM Harvey, J. Chem. Technol. Biotechnol., 1996, 66, 343-350.
[8]T Roukas; GC Biliaderis. Appl. Biochem. Biotechnol., 1995, 55, 27-44. [9]T Roukas, World J. Microbiol. Biotechnol., 1999, 15, 447-450.
[10]T Roukas; M Liakopoulou-Kyriakides, J. Food Eng., 1999, 40, 89-94.
[11]Y Goksungur; A Ucan; U Guvenc, Turkish J.Biology, 2004, 28, 23-30.
[12]PA Gibbs; RJ Seviour, Appl. Microbiol. Biotechnol, 1996, 46, 503-510. [13]PA Gibbs; RJ Seviour, Appl. Microbiol. Biotechnol,.1998, 49, 168-174.
[14]Y Goksungur; S Dagbagli; A Ucan; U Guvenc, J. Chem. Technol.Biotechnol., 2005, 80, 819-827.
[15]JE Bailey, DF Ollis. Biochemical Engineering Fundamentals, 2nd Edition, McGraw-Hill, New York, 1986.
0
20
40
60
80
100
120
0
20
40
60
80
100
120
140
160
180
S
u
cr
os
e C
on
ce
n
tr
at
ion
,
g/
L
Time, hr
50 g/L Sucrose (Experimental)
50 g/L Sucrose (Model)
75 g/L Sucrose (Experimental)
75 g/L Sucrose (Model)
[16]GD Najafpour. Biochemical Engineering and Biotechnology, 1st Edition, Elsevier, Amsterdam, 2007, 81-141.
[17]M Kellerhals; B Kessler; B Witholt; A Tchouboukov; H Brandtl, Macromolecules, 2000, 33, 4690-4698.
[18]E Heinzle; R Lafferty, Appl.Microbiol. and Biotechnol., 1980, 11, 8-16.
[19]R Dhansekar; T Viruthagiri; P Sabarathinam, Biochemical Engineering Journal, 2003, 16, 1-8.
[20]J Klimek; DF Ollis, Biotechnol Bioeng., 1980, 22, 2321-2342.
[21]N Thomson; DF Ollis, Biotechnol. Bioeng., 1980, 22, 859-873.
[22]KC Cheng; Ali Demirci; M Jeffrey; Catchmark; VM Puri, Journal of Food Engineering, 2010, 98 (3):353–359.
[23]VSRK Ganduri; P Sudhakar, Intl. J. Engg. Res.& Tech., 2014, 3(10), 1076-1079.
[24]R Pearl; LJ Reed, Proceedings of the National Academy of Sciences of the United States of America, 1920, 6,
275-288.
[25]A Mulchandani; JH Luong; A Leduy, Biotechnol.Bioeng., 1988, 32, 639-646.
[26]MH Zwietering; I Jongenburger; FM Rombouts; K. Van’t Riet. Appl. Environ.Microbiol, 1990, 56, 1875-1881.
[27]SVN Vijayendra; D Bansal; MS Prasad; K Nand, Process Biochemistry, 2001, 37, 359–364.
[28]GL Miller, Analytical Chemistry, 1959, 31(3):426-428.
[29]K Thirumavalavan; TR Manikandan; R Dhanasekar, Biotechnology, 2008, 7(2), 317-322.