Journal of Chemical and Pharmaceutical Research, 2016, 8(7):667-676
Research Article
CODEN(USA) : JCPRC5
ISSN : 0975-7384
667
Experimental studies on gasification of corn cobs in a fixed bed system
K. Arun
*and M. Venkata Ramanan
#*
Department of Mechanical Engineering, St. Joseph’s College of Engineering, Chennai, Tamil Nadu, India - 600119
#Institute for Energy Studies, College of Engineering Guindy, Anna University, Chennai, Tamil Nadu, India -600025
ABSTRACT
A closed top, 6 kWe, fixed, perforated bed, downdraft reactor had been designed, fabricated and was used to
experiment the gasification of corn cob under forced air circulation mode. Producer gas composition, HHV of producer gas, specific gas generation, cold gas efficiency had been investigated by varying the equivalence ratio from 0.1 – 0.45. Studies revealed that corn cob could be gasified successfully. An equivalence ratio of 0.3 was observed to be optimal for it yielded maximum cold gas efficiency (62.83%), highest HHV of producer gas (4.58
MJm-3) associated with an optimal specific gas generation rate (2.12 m3 of gas/kg of corn cob). The CO2/CO of the
producer gas at an ER of 0.3 was observed to be 0.907 and is the lowest among all ERs. Tar and particulates
content has been experimentally determined as 0.81 gm-3 and 0.355 gm-3 respectively. Fuel bridging was inferred to
be minimal as O2 content in the producer gas was zilch. Hence corn cob has been identified as a viable alternate
fuel for gasification that could be used for decentralized power generation.
Keywords: Biomass, Gasification, Corn Cobs, Tar, Particulate matter, CO2/CO
INTRODUCTION
It is projected that the global energy demand would be about 37% higher in 2035 than that was in 2015 with India and China accounting for almost 50% of the growth. Also the global per capita energy utilization is predicted to increase by 12% with total carbon emissions to increase by 25% [1]. Dependency on fossil fuels leads to severe environmental issues such as global warming, acid rain, emission of pollutants etc., [2]. Hence renewable energy resources such as biomass, wind, solar and geothermal attract great attention since they are clean and environmentally benign. It is estimated that among non-fossil fuels, usage of energy from renewables (including biofuels) is likely to grow from 3% to 8% in 2035 [1].
Of late attention is focused on biomass as an energy resource - as compared to other renewable sources - for energy generation, as it is evenly scattered over earth’s surface unlike fossil fuels and emits abysmally lower greenhouse gases. Plantation of biomass crops for energy harvesting helps to mitigate climate change; reduces acid rain; abates soil erosion and water contamination; curtails pressure on landfills and also enhances wildlife habitation. Energy is sourced from biomass by adopting any of the 3 mechanisms namely Thermo chemical (Combustion, Gasification, Pyrolysis and Carbonization), Biochemical (Biomethanation, Fermentation, Composting etc.) and Physiochemical (Briquetting, Pelletisation etc.). Among these technologies gasification holds abundant promise for its limited space requirement, fuel flexibility, better energy recovery [3] and modularity.
668
Corn, known as maize is one of the most emerging crops having wider adaptability under varied climatic conditions. In India corn is the 3rd most important food crop after wheat and rice. Estimated production of corn in India is 23.5 million tons in the year 2015 and is ranked as 8th based on its production [6]. Presently corn cobs generated during processing of maize is being dumped as a waste. This paper investigates the possibility of gasification of corn cob in a biomass reactor for to explore its potential as an alternate source of energy.
EXPERIMENTAL SECTION
Corn Cob – Physiochemical Characterization
Corn is used for various purposes such as animal fodder and food grain (sweet corn, baby corn, green cobs and popcorn). Indians widely consume corn flour for cooking. Corn is also being used as a basic raw material for many industrial products like oil [7], starch [8], alcoholic beverages [9], fiber [10], pharmaceutical, food sweeteners, food cereals, cosmetic, film, gum, textile, package and paper industries [11]. In the process of extraction of corn kernels residues such as cobs, leaves and stalks are obtained. Generally a corn crop upon processing yields 13% of its weight as kernels (useful product), 15% as cobs, 22% as leaves and remaining 50% as stalks [12, 13, 14]. Corn leaves and stalks are basically generated at field while cobs are generated at the processing units. Corn cobs, the hard cylindrical core bearing kernels comprises 3 layers namely pith, woody ring and chaff, as depicted in figure 1.
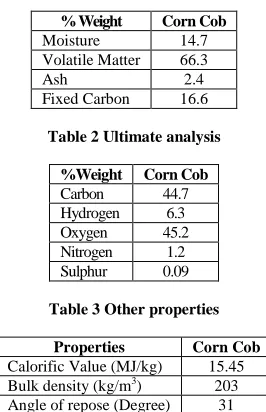
Efficient deployment of biomass necessitates proximate analysis, ultimate analysis and determination of HHV so as to establish the quality and quantitative energy content of these fuels [15]. Corn cob characteristics were determined using a proximate analyzer (muffle furnace + micro weigh balance with other supporting auxiliaries) and Ultimate analyzer. Moisture content (adopting ASTM E 871 – 82), volatile matter (adopting ASTM E 872 – 82) and ash content (adopting ASTM D 1102 – 84) were determined. Fixed carbon was assumed to be the rest. Calorific Value of the fuel was estimated using bomb Calorimeter (standardized using benzoic acid). Physical and chemical characteristics of corn cob – as obtained in these analyses - are presented in the tables 1, 2 & 3.
It was inferred from literatures that physical and chemical characteristics of biomass used in gasification shall conform to certain minimum criteria. Moisture and ash content should not be greater than 30% and 5% respectively [16]. HHV and bulk density of fuel shall be greater than 10 MJ/kg and 200 kg/m3 respectively [17]. Angle of repose for the biomass feed should be lesser than the angle of throat for its easiness to flow in throat zone [18]. Since corn cob satisfies all the above criteria, it can be used as a feedstock for the gasification.
669
Table 1 Proximate analysis (As received basis)
% Weight Corn Cob
Moisture 14.7
Volatile Matter 66.3
Ash 2.4
[image:3.595.239.372.85.291.2]Fixed Carbon 16.6
Table 2 Ultimate analysis
%Weight Corn Cob
Carbon 44.7
Hydrogen 6.3
Oxygen 45.2
Nitrogen 1.2
Sulphur 0.09
Table 3 Other properties
Properties Corn Cob
Calorific Value (MJ/kg) 15.45 Bulk density (kg/m3) 203 Angle of repose (Degree) 31
Literature analysis further revealed experimental investigation of various fuels like sugar cane leaves, bagasse, bajra stalks and sweet sorghum stalks [19], beachwood, nutshells, olive husks and grape residues [20], Furniture wood and wood chips [21], hazelnut shells [22], rubber wood chips [23], saw dust [24], Refuse Derived Fuel (RDF) pellets [25], Cashew nut shell char [26], olive residues [27], sesame wood waste [28], maritime pine woodchips [29], olive pomace [30], empty palm fruit bunches (EFB) [31], olive kernel [32] babul wood, groundnut shell briquettes, groundnut shell, mixture of babul wood & groundnut shell and cashew nut shell [33] for gasification. Hence it is evident that no major research work was carried out on gasification of corn cobs.
Experimental & Instrumentation set up
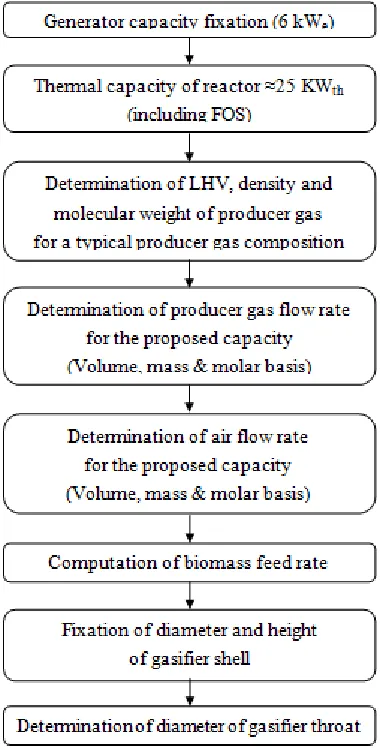
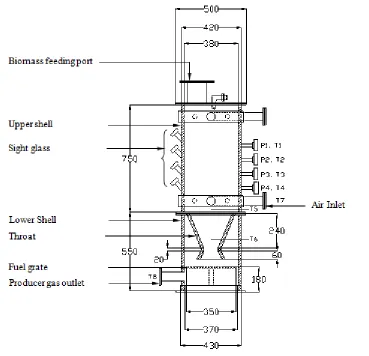
Lack of research / literature on corncob gasification had prompted us to design a gasifier using a proven and a widely adopted fuel viz., causarina wood and to use the same gasifier with suitable modifications for gasifying corncobs. It was planned to adopt a fixed bed (so as to accommodate bulky and denser fuels), forced draught (to avoid coating of tar in downstream equipment like blowers), dry bottom (to resist water induced corrosion and to eliminate accumulation of carcinogens) and down draught (to minimize tar as throat section induces thermal cracking of tar) gasifier for the experimental analysis. Figure 2 details the procedure adopted for designing the gasifier. Mild steel sheets were used for fabricating the designed setup for its lower cost and better machinability characteristics. The dimensions of the designed and fabricated gasifier are depicted in figure 3.
670
671
Figure 3 Gasifier dimensions
The entire reactor assembly was supported on a mild steel stand. The producer gas emanating from the reactor was passed through a cyclone separator for removing the suspended particulates and was burned through the flare pipe. Figure 4 & 5 depicts the schematic and the photographic view of experimental setup.
Flexib le Hose
Cyclone Separator Venturimeter
Flare
P1,T1
P2,T 2
P3,T 3
Fuel Supply
Throat
Fuel Grate Butterfly
Valve
Producer Gas
Air Fl ow
To U Tube Manometer
U-Tube Manometer I/P from Venturimeter
I/P from Orificemeter
Blower Vaccum Pump
Gas Flow Meter Rotameter
Particulate Separator Module Tar Separator Module Flow Monitoring Module
Gas Control Module Isopropanol
Cold Bath (Methanol at -16°C) Hot Bath (Water 45°C)
T5
T8
P4,T4
T6
To U Tube Manometer
Orificemeter
T7 Butterfly
Valve
[image:5.595.83.531.513.702.2]672
Figure 5 Photographic view of experimental setup
A Siemens make online gas analyzer (Oxymat 61 estimating O2 using paramagnetic prinicple, Calomat 6 estimating CO, CO2 & CH4 using Non Dispersive Infrared Multilayer technology and Ultramat 23 estimating H2 using thermal conductivity principle) were used to establish producer gas composition. An orifice meter coupled with water filled “U” tube manometer was connected after the butterfly valve in the air inlet line for measuring the air flow rate. Producer gas flow rate was measured by using venturi meter made up of mild steel with water filled “U” tube manometer, placed in the producer gas line. Venturi was chosen for measurement of producer gas flow while orifice for air flow monitoring for to avoid the possibility of erroneous reading due to deposition of tar in orifice meter since the cross section of orifice is smaller than the throat of venturi. K type (Chromel-Alumel) thermocouples (T1 to T8) were used to monitor air inlet temperature, temperature distribution inside the reactor and producer gas exit temperature at regular intervals. Temperature at various positions was logged using Agilent make (34907A) data acquisition system. Reactor surface temperature was measured with a Kane make Infrared Thermometer (UEI-INF 200). The pressure buildup across the reactor at different positions (P1 to P4) was measured using water filled “U” tube manometer. A slip stream of producer gas was sampled for quantifying the tar and particulate matter at the exit of the gasifier but prior to cyclone separator. The sampling set up was fabricated as per international guidelines [34]. Equipment like Soxhlet extractor, rotary vacuum flash evaporator, calibrated analytical balance (1 mg accuracy), quartz thimble filter, muffle furnace, desiccator, volumetric flask and funnel were used for quantification of tar.
EXPERIMENTAL SECTION
Pre weighed sacks comprising corn cobs, each weighing 5 kg, were prepared and placed near the reactor for continuous operation. To initiate the gasification process, a known quantity of charcoal was ignited and fed to the gasifier through the hopper. A metered quantity of air was admitted to the gasifier using a blower and butterfly valve arrangement to ensure sustenance of red hot charcoal bed above the grate, followed which corn cobs were fed. Flue gas was observed at the flare pipe within 5 minutes. A flammable gas was obtained at the flare pipe after 25 minutes of starting. Experimental studies were initiated after the gasifier attained steady state which was ensured by observation of constant temperature both in reduction zone and producer gas. Fuel feeding rate was noted by charging the gasifier with fuel - on an hourly basis - to a predetermined level.
Equivalence Ratio, bed temperature, volatile matter, moisture content and gasifying medium are the 5 main parameters that influence gasification [26]. As the designed reactor is of auto-thermal type, the bed temperature of the gasifier cannot be changed. Volatile matter and moisture content of the sourced corn cobs are invariably constant. Atmospheric air was used as the gasifying medium. Hence it is inferred that the only influential parameter that could be varied is the equivalence ratio. Thus it was decided to establish the gasifier performance for different equivalence ratios towards identifying the operating condition that yielded maximum efficiency.
RESULTS AND DISCUSSION
Influence of equivalence ratio on producer gas composition
673
Figure 6 depicts the variation of producer gas composition for different ER. There is subtle rise in H2 initially with increase in ER and at higher ER it follows a decreasing pattern which concur the observations of Lv et al. [35]. This trend in molar concentration of H2 may be attributed to increase in availability of O2 at higher equivalence ratios, thereby aiding formation of H2O. Molar concentration of CO increases up to 0.3 ER and then decreases. CO2 concentration follows a reverse trend as that of CO owing to the possibility of reverse Boudouard reaction. CO is observed to be maximum (15.43%) at 0.3 ER where CO2 reaches minimum (14%). The trend observed for CO and CO2 content are analogous to the experimental inferences cited by Zainal et al. [21] and Venkat et al. [26].
[image:7.595.81.540.279.429.2]Concentration of CH4 is found to be in receding trend with increase in ER. An increase in ER results in increased reaction temperature and hence CH4 formed at lower ERs undergo endothermic reaction with water vapour and are transformed to CO, CO2 and H2. CH4 content from the experimentation of corn cob is found to be hovering around 0.87% - 2.4% which is in line with the findings of Bacaicoa et al. [36]. In an ideal gasification system, the molar concentration of O2 in the producer gas should be zero. However during experimentation, presence of traces of O2 was noticed at lower ER, which might probably be due to bridging and channeling of fuels at lower fuel consumption rates. Table 4 presents the composition of producer gas observed by various researchers on different fuels with that of corn cob.
Figure 6 Influence of ER on gas composition Figure 7 Variation of CO2/CO
Variation of CO2/CO Vs Equivalence Ratio
Variation in the ratio of CO2 to CO for different ER is shown in figure 7. A least ratio of CO2 to CO indicates better gasification of the fuel. Analysis performed on the results reported by researchers (Dogru et al. [22], Jayah et al. [23], Paulo et al. [24], Rao et al. [25] and Venkat et al. [26]) reveal that the ratio of CO2 to CO ratio should be less than 1 for better gasification efficiency. During corncob gasification, the ratio attains value lesser than 1 between an ER of 0.25 to 0.3 and hence the optimum ER has been identified to lie within this range.
Variation of combustibles and inerts Vs Equivalence Ratio
The HHV of the producer gas is influenced by presence of combustibles. Since air gasification is adopted, the volumetric composition of inert constituents (N2 and CO2) outnumbers the volumetric composition of combustible constituents (CO, H2 and CH4). The range of combustible products with respect to varying ER was estimated to be between 25% – 33% of producer gas generated. Maximum % of combustible (32.53%) and minimum % of inert (67.47%) was observed at an ER of 0.3. Figure 8 illustrates the variation of % combustibles and % inerts, with respect to different ER.
Table 4 Composition of producer gas from various fuels
Fuel Volumetric composition of producer gas (%) Researcher
H2 CO CO2 CH4 C2H6 N2 O2
Furniture wood 14.05 24.04 14.66 2.02 0.01 43.62 1.69 [21]
Hazelnut shells 11.1 -14.7 8.56 -20.66 9.52 -10.33 1.4 -2.36 Traces NA NA [22]
Rubber wood 12.5 -18.3 18.4 -22.1 8.5 -11.4 1.1 -1.4 NA NA NA [23]
Sawdust 10.2 -18.9 15.7 -22.7 9.73 -14.57 1.08 -3.65 NA NA NA [24]
Casuarina Wood 14.4 16.3 11.0 2.0 NA 56.3 NA
[26]
Cashew nut shell char 11.1 21.6 2.9 0.4 NA 64.0 NA
Olive kernels 7.78 4.81 19.47 2.99 Traces NA NA [27]
674
The range of combustibles and inert yielded from gasification of corn cobs are comparable to that of gasification of other bio fuels like hazelnut shells [22], rubber wood [23], sawdust [24], RDF pellets [25], casuarina wood & cashew nut shell char [26], olive kernel [27], and empty palm fruit bunches [31].
Figure 8 Variation of combustibles & Inerts Figure 9 Variation of HHV of gas
HHV of producer gas Vs Equivalence Ratio
The HHV of the producer gas increases with equivalence ratio initially, attains a peak at the best operating point and then decreases with the increase in equivalence ratio. Figure 9 depicts the variation of HHV of producer gas with different ER. The decrease in HHV is due to the decrease in CO & H2 content in the producer gas generated. HHV of producer gas from corn cob attained a maximum value of 4.58 MJm-3 at an ER of 0.3. The presence of combustibles is found to be maximum at this ER. Rajeev et al. [19] reported HHV in the range of 3.56 – 4.82 MJm-3 while gasifying fuels like sugarcane leaves, bagasse, bajra stalks and sweet sorghum stalks while Bhoi et al. [33] experienced HHV of 4.37 MJm-3 – 4.79 MJm-3 from gasifying various biomass feeds.
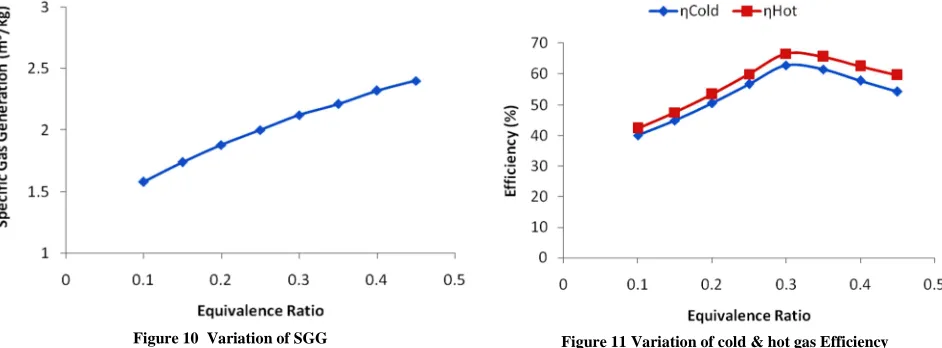
Specific gas generation Vs Equivalence Ratio
[image:8.595.93.523.131.283.2]Specific gas generation (SGG) is the volume of producer gas generated per kg of fuel. Figure 10 depicts the variation of specific gas generation with respect to increase in ER. The SGG is found to be increasing from 1.58 m3kg-1 to 2.4 m3kg-1 with increase in ER from 0.1 to 0.45. SGG at ER = 0.3 is found to be 2.12 m3kg-1. Comparison on the SGG using different fuels - as reported by other researchers – with that of corn cobs is presented in table 5. SGG reported from various researchers vary from 1.62 m3kg-1 – 4.18 m3kg-1 (Dogru et al. [22], Rao et al. [25], Venkat et al. [26], Sheth et al. [28], Bhoi et al. [33]).
Figure 10 Variation of SGG Figure 11 Variation of cold & hot gas Efficiency
Efficiency Vs Equivalence Ratio
[image:8.595.70.541.511.685.2]675
up to an ER of 0.3 and decline thereafter. This trend may be due to fact that combustibles in producer gas increases till ER of 0.3 and thereafter decreases.
Cold gas efficiency as reported by other researchers are : 50% to 60% for an ER range of 0.2 to 0.35 (Sheth et al. [28]), 38% to 62% while varying air-fuel ratio from 0.8 m3/kg to 1.78 m3/kg (Catharina Erlich et al. [31]), 64% to 72% (Bhoi et al. [33]), 42% to 82% by varying the ER from 0.15 to 0.4 (Bacaicoa et al. [36]), maximum of 70% (Singh et al. [37]) and 43.3% to 63.6% (Kuhe et al. [38]).
Tar and Particulates Vs Equivalence Ratio
Quantification of tar and particulate matter is a laborious process requiring a considerable amount of time. Hence, it was decided to ascertain the tar and particulate matter at the best gasification condition i.e., at an ER of 0.3 for the feedstock. Producer gas sampling for the estimation of tar and particulate matter is performed at the exit of the reactor but prior to the cyclone separator. The tar and particulate matter sampling system – devised adopting international norms - consists of 4 modules viz. gas preconditioning, particle filter, tar collection and volume metering. The sample gas after preconditioning was admitted in to a quartz thimble filter for estimation of particular matter. Difference in weight of the thimble filter was used for determination of particulate matter. Clogged tar in the thimble filter was duly accounted using a separate procedure involving soxhlet extractor and rotary vacuum flash evaporator.
[image:9.595.163.481.342.509.2]Tar collection module comprises 6 nos. of impinger bottles housed equally in hot bath and cold bath maintained between -15°C to -20°C and +35°C to +40°C respectively. The tar collected in the impinger bottles was quantified using rotary vacuum flash evaporator. Figure 12 depicts the tar and particulates content in a producer gas generated which had been experimentally estimated as 0.81 g/m3 and 0.355 g/m3 respectively.
Figure 12 Tar and Particulates in the producer gas
Presence of tar content in producer - as reported by researchers – ranges from 0.12 g/m3 (Adegoroye et al. [39]) to 7 gm-3 (Narvaez et al. [40]). The range of tar generation seems to be wide as it is influenced by a variety of site specific local conditions such as volatile matter, lignin content, moisture content, porosity and density of feedstock, ER, gasification temperature etc.,
CONCLUSION
676
REFERENCES[1] BP Energy Outlook 2035, February 2015.
[2] Meng Ni; Dennis YC Leung; Michael KH Leung; K Sumathy. Fuel Process. Technol., 2006, 87(5), 461-472. [3] Aly Moustafa Radwan. Der Chemica Sinica, 2012, 3(2), 323-335.
[4] http://biomasspower.gov.in/biomass-info-asa-fuel-resources.php
[5]Energy Statistics 2015, 22nd Issue, Central Statistics Office, Ministry of Statistics and Programme Implementation, Government of India, New Delhi, 2015; 12.
[6] http://www.keshrinandan.com/com/world-corn-production-20152016/
[7] Lauren M Comin; Feral Temelli; Marleny DA Saldana. J. Supercrit. Fluids, 2012, 61, 221-228.
[8] Bing Zhang; Dapeng Cui; Mingzhu Liu; Honghong Gong; Yinjuan Huang; Fei Han. Int. J. Biol. Macromol.,
2012, 50(1), 250-256.
[9] BP Lamsal; H Wang; LA Johnson. Bioresour. Technol., 2011, 102(12), 6680-6686. [10]Tejas S Pandya; Radhakrishnan Srinivasan. Indus. Crops Products, 2012, 35(1), 37-43. [11] http://agrifarming.in/maize-farming
[12] Shahab Sokhansanj; Anthony Turhollow; Janet Cushman; John Cundiff. Biomass Bioenergy, 2002, 23(5), 347-355.
[13] S Sokhansanj; S Mani; S Tagore; AF Turhollow. Biomass Bioenergy, 2010, 34(1), 75-81. [14] World agricultural production archives, United States Department of Agriculture, 2011 [15]Jigisha Parikh; SA Channiwala; GK Ghosal. Fuel, 2005; 84(5), 487-494.
[16]Peter McKendry. Bioresour. Technol., 2002, 83(1), 55-63.
[17] PVR Iyer; TR Rao; PD Grover. Biomasss Thermo-Chemical Characterization, 3rd Edition, Chemical Engineering Department - IIT Delhi, New Delhi, 2002.
[18]ZA Zainal. Performance and characteristic of biomass gasifier systems, Ph.D. thesis, UK: Division of Mechanical Engineering and Energy Studies, School of Engineering, University of Wales, College of Cardiff, 1996. [19]Rajeev Jorapur; Anil K Rajvanshi. Biomass Bioenergy, 1997, 13(3), 141-146.
[20]Colomba Di Blasi; Gabriella Signorelli; Giuseppe Portoricco. Ind. Eng. Chem. Res., 1999, 38(7), 2571-2581. [21]ZA Zainal; Ali Rifau; GA Quadir; KN Seetharamu. Biomass Bioenergy, 2002, 23(4), 283-289.
[22]M Dogru; CR Howarth; G Akay; B Keskinler; AA Malik. Energy, 2002, 27(5), 415-427. [23] TH Jayah; Lu Aye; RJ Fuller; DF Stewart. Biomass Bioenergy, 2003; 25(4), 459- 469.
[24]Paulo R Wander; Carlos R Altafini; Ronaldo M Barreto. Biomass Bioenergy, 2004; 27(5), 467-476. [25] MS Rao; SP Singh; MS Sodha; AK Dubey; M Shyam. Biomass Bioenergy, 2004, 27(2), 155-171.
[26]M Venkataramanan; M Sundaresan; S Kasiraman; R Sethumadhavan. J. Biobased Mater. Bioenergy, 2008, 2(1), 33-42.
[27] V Skoulou; A Zabaniotou; G Stavropoulos; G Sakelaropoulos. Int. J. Hydrogen Energy, 2008, 33(4), 1185-1194.
[28] Pratik N Sheth; BV Babu. Bioresour. Technol., 2009, 100(12), 3127-3133.
[29] L Van de steene; JP Tagutchou; F Mermoud; E Martin; S Salvador. Fuel, 2010, 89(11), 3320-3329. [30] Hayati Olgun; Sibel Ozdogan; Guzide Yinesor. Biomass Bioenergy, 2011, 35(1), 572-580.
[31]Catharina Erlich; Torsten H Fransson. Appl. Energy, 2011, 88(3), 899-908.
[32]Nikolaos K Margaritis; Panagiotis Grammelis; David Vera; Francisco Jurado. Procedia – Social and Behavioral
Sciences, 2012, 48, 857-867.
[33]PR Bhoi; RN Singh; AM Sharma; SR Patel. Biomass Bioenergy, 2006, 30(6), 575-579.
[34] Technical report CEN BT/TF 143, Sampling and analysis of tar and particles in biomass producer gases, prepared under “Organic contaminants (“tar”) in biomass producer gases, 2005.
[35]PM Lv; ZH Xiong; J Chang; CZ Wu; Y Chen; JX Zhu. Bioresour. Technol., 2004, 95(1), 95-101.
[36]Pedro Garcia-Bacaicoa; Rafael Bilbao; Jesus Arauzo; M Luisa Salvador. Bioresour. Technol., 1994, 48(3), 229-235.
[37]RN Singh; U Jena; JB Patel; AM Sharma. Renew. Energy, 2006, 31(4), 481-487. [38] A Kuhe; EI Kucha; HA Iortyer. Int. J. Adv. Ren. Energy Res., 2012, 1(6), 307-312.
[39]A Adegoroye; N Paterson; X Li; T Morgan; AA Herod; DR Dugwell; R Kandiyoti. Fuel, 2004; 83(14-15) : 1949–1960.