Quantitatively Structuring A Trabecular Network Using
Computational Geometry Techniques
Yi Xiao
*, Ali Abdollahi, Qing H. Qin
Research School of Engineering, Australian National University, Canberra, ACT 0200, Australia *Corresponding Author: [email protected]
Copyright © 2014 Horizon Research Publishing All rights reserved.
Abstract
Osteoporosis or ‘porous bones’ is the major cause of bone fracture in elderly post-menopausal women. As such, predicting fracture occurrence can significantly reduce the associated morbidity and reduce health-care expenditures. Examining local micro-structure of trabecular bone is becoming increasingly important for investigating bone fracture behavior. Conventional voxel based measures of bone architecture cannot provide morphology information regarding the fractures occurring at individual trabeculae. In this paper, the Delaunay triangulation, a computational geometry technique is used for assessing the effect of trabeculae structure on local micro-fracture, from sequential 2D images of the cross section of a hamster femur surface undergone a multistage loading until fracture occurrence. The most significant structural parameters to characterizethe strength of cancellous bone and the change in morphology of individual trabeculae during the fracture process are investigated. The results from different regions were compared to describe the possible architectural factors affecting the local micro-damages.Keywords
Trabecular bone, Image processing, Delaunay Triangulation.1. Introduction
Osteoporosis is a major public health problem which will worsen as the global population ages. Accurate diagnosis of osteoporosis can reduce the occurrence of fractures and the associated mortality rates and healthcare costs. The current standard in bone health assessment is to measure Bone Mineral Density (BMD) using dual x-ray absorptiometry (DXA) [1]. However, BMD is not a comprehensive indicator of bone strength, which is also highly dependent on the structure of trabecular bone [2]. In basic bone research, structural parameters are key measures in characterising the structure of cancellous bone [3]. The effect of morphological heterogeneity has been studied using these parameters. Several studies have been performed to identify the contribution of these indices to
bone strength and on how they are altered with age and by pharmaceutical intervention [4]. This was based on the intuitive idea that the mechanical properties of trabecular bone depend strongly on its apparent density or bone volume [5,6]. The most widely used structural indices are trabecular width (Tb.Wi), trabecular separation (Tb.Sp), trabecular number (Tb.N) and mean lntercept length. The calculation of these indices is mainly voxel based, only the means of physical features of a bone structure can be calculated [7, 8]. Meanwhile, Qin et al [9-12] presented a multifield theory for analysing bone remodelling and porosity which can be used for analyzing bone structure and density behaviours due to both mechanical and electric fields changes. According to its definition and theory, bone strength depends not only on the quantity of bone tissue and density but also on the quality, which is characterized by the bone architecture, mineralization, turnover, and micro-fracture accumulation. Besides, micromechanics approaches [13-16] were also used for evaluating effective bone or dental properties [17, 18] and then evaluating bone strength.
As we know, in a trabecular structure the longitudinally oriented trabeculae are longer and thinner than trabeculae in transverse direction, and width of individual trabeculae is not uniformly distributed. In individuals with osteoporosis the longitudinal trabeculae are typically maintained, and in fact, become thicker to withstand the loads typically applied to them; while the transverse trabeculae are generally lost to a greater extent compared with controls without osteoporosis [19, 20]. As the cross-struts between longitudinally oriented trabeculae become discontinuous, the remaining trabeculae become relatively longer. Common voxel based measures of bone architecture do not provide morphology information regarding the fracture occurring at individual trabeculae, thus cannot be used for accurate fracture prediction and monitoring response of bone architecture to drug treatments [21-23].
individual trabeculae during the fracture process are investigated.
2. Methodology
2.1. Trabecular Bone
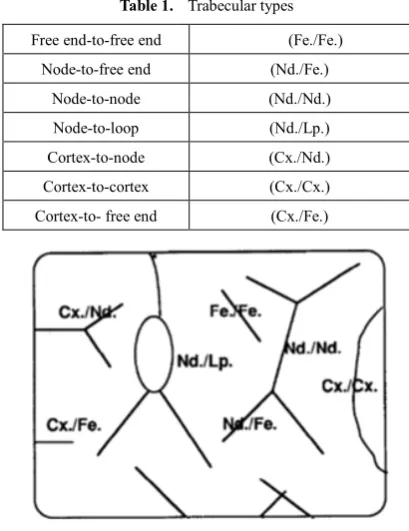
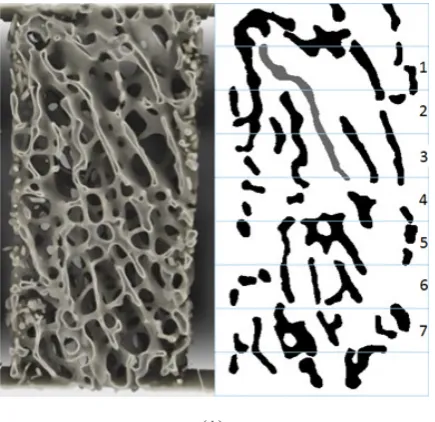
[image:2.595.313.552.155.275.2]Trabecular bone is a form of skeletal tissue found at the ends of long bones, near joints and inside vertebrae. Though its composition of hydroxyapatite, collagen and water is similar to dense cortical bone, there is significant difference in structure. Trabecular bone is highly porous, made up of elements known as trabeculae. The pores of the trabecular structure are filled with bone marrow. The complex structure of a trabecular bone gives it unique mechanical properties [24]. In order to characterize properties of individual trabeculae, the topological structure that exists in trabecular bone is presented here. In the skeleton of 2D micro-architectural images, individual trabeculae are joined together at nodes, and stop at free ends and the image border. These trabeculae are usually classified into 7 different groups (see Table 1 and Figure 1 for details).
Table 1. Trabecular types Free end-to-free end (Fe./Fe.)
Node-to-free end (Nd./Fe.) Node-to-node (Nd./Nd.) Node-to-loop (Nd./Lp.) Cortex-to-node (Cx./Nd.) Cortex-to-cortex (Cx./Cx.) Cortex-to- free end (Cx./Fe.)
Figure 1. Different trabecular types
2.2. Bone Segmentation
Delaunay triangulation geometry has been shown efficiency in dividing the image into simpler segments [25]. The proposed method makes use of this geometrical computation technique to decompose the image into sets of triangles for representing different trabecular structures. To construct the image partition, boundary points of individual
trabeculae are taken as the input of Delaunay triangulation construction. These points are found by a contour extraction method [26] (Figure 2). The result is a set of segments which can be divided into two distinct groups. Using the gray-scale value of the centre of each triangle, it is identified as a bone segment or a marrow segment.
Figure 2. a) Trabecular bone image obtained from microCT; b) Binary representation; c) boundaries of individual trabeculae; d) Bone and marrow segments
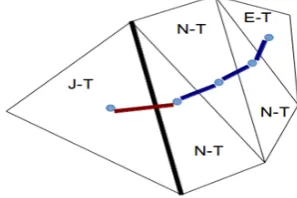
Bone segments are divided into four different groups (See Table 2 and Figure 3) where neighbouring triangles are defined as triangles sharing a common edge [27]:
• Isolated triangle: a bone segment with no other bone segment(s) in its neighbourhood.
• End triangle: a bone segment with only one other bone segment in its neighbourhood.
• Normal triangle: a bone segment with two other bone segments in its neighbourhood.
[image:2.595.74.279.365.631.2]• Junction triangle: a bone segment with three other bone segments in its neighbourhood.
Table 2. Segment types
Triangle type No of adjacent bone segment Isolated (I-T) 0
End (E-T) 1
Normal (N-T) 2
Junction (J-T) 3
Figure 3. Different segment types
[image:2.595.320.546.462.682.2]each E-T is assigned to only one trabecula. Therefore, E-T can be used as a start point in tracing the N-Ts. The tracing process is terminated by approaching a junction (for Nd./Fe. trabeculae) or unprocessed end triangle (for Fe./Fe. Tr trabeculae abeculae). Applying this method to all identified E-Ts in trabecular structure and tracing N-Ts to find the associated branch, results in extraction the entire structure (Figure 4).
Figure 4. Different branches extracted are shown in different colours
2.3. Trabeculae MEASUREMENT
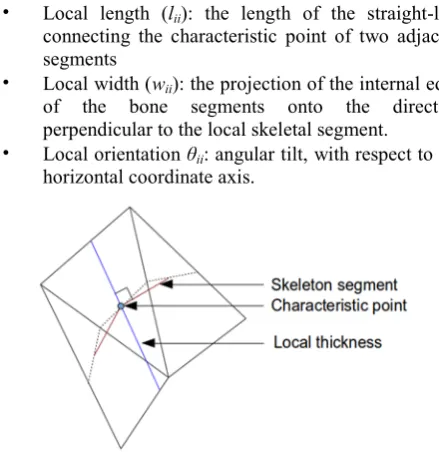
Trabeculae are measured by the following parameters (Figure 5):
• Local length (lii): the length of the straight-line connecting the characteristic point of two adjacent segments
• Local width (wii): the projection of the internal edge of the bone segments onto the direction perpendicular to the local skeletal segment.
• Local orientation θii: angular tilt, with respect to the horizontal coordinate axis.
Figure 5. Local length and width of individual trabeculae Total area of each trabecula is calculated form summation of rectangular areas (Figure 6) obtained via local measurements of each skeletal line segment.
i ii
A =
∑
Awhere Ai is the total area of individual trabeculae and Aii is
the area of rectangular sub-region of individual trabeculae:
=
×
ii ii ii
A w l
Average width of individual trabeculae is defined as follow: ii ii
i
ii
w A w
A
×
=
∑
∑
Average orientation of individual trabeculae is obtained from the following equation:
ii ii i
ii
A A
θ
θ =
∑
×∑
Length of individual trabeculae is obtained from summation of the length of local skeletal segments.
i ii
[image:3.595.66.286.401.630.2]l =
∑
lFigure 6. Local rectangular sub-region of individual trabeculae
2.4. The skeleton of a Trabecular Structure
The skeleton of a trabecular structure is represented by characteristic local symmetry points. Two different characteristic points exist in bone segments:
• The characteristic skeleton point of an N-T is the mid-point of a straight-line segment connecting the mid-points of two internal edges of the triangle [28]. An edge of an internal triangle is an external edge if it is a contour segment. Otherwise, it is an internal edge.
• The characteristic skeleton point of an I-T, E-T, or J-T is the centroid of the triangle.
Since the skeleton obtained from this process contains many unwanted short line segments, it is called the primary skeleton of the shape (Figure 7).
Figure 7. Characteristic points of bone segments shown in blue colour
2.5. Artifact Removal
[image:3.595.371.503.581.688.2]triangulation may not always conform to human perceptions of the shape. For instance, a J-T may be found in a place which should not be an intersection of the shape (Figure 8 (A)). Consequently, the primary skeleton generated using Delaunay triangulation contains many unwanted skeletal elements which may induce error in measured properties and increase the time and computation required to evaluate the entire trabecular structure. Skeletonisation artifacts include two different types of artifacts:
• • Periphery artifacts correspond to shape protrusions which are perceptually insignificant. • • Intersection artifacts refer to extra skeleton
branches between split skeleton junction points after skeletonisation.
(A)
(B)
Figure 8. Medial axis of trabecular structure before (A) and after (B) artifact removal
To reduce periphery artifacts, the initial skeletonisation of the shape needs modification. Two criteria were used in artifact identification:
1. It is noted that the length of a branch should be greater than or equal to its width. Thus, a protrusion of a shape is considered as being perceptually insignificant if its length is shorter than its maximum local width. The shortest trabecula is one whose length is equal to its maximum local width (Figure 9).
2. If the length of a protrusion skeleton laying outside the junction segment is less than its length inside the junction segment, it is considered insignificant and hence, can be removed (Figure 9). In the proposed method, these lengths are approximated using first skeletal line segment in each branch.
The characteristic point of a junction polygon which is
comprised of two or more adjacent J-Ts has to be obtained via a different approach. The good continuation principle of human perceptual organisation [29] suggests that visual elements that require the fewest number of changes will be grouped into wholes. Thus, characteristic point of a junction polygon can be approximated by assuming that trabeculae do not change their orientation after entering the intersection. As such, the new characteristic point of the junction polygon is defined as the mean value of the center of junction segments weighted with the number of branches entering each junction segment.
Figure 9. Maximum local width of a protrusion (bold black) and its external (blue) and internal (red) medial axis
For several images, this procedure was repeated consecutively and terminated in the case that no artifact was found in the skeletonised image. The removal of all artifacts was validated for all loading stages after 3 iterative operations using visual inspection (Figure 8 (B)).
2.6. Trabecular Parameters Calculation
Bone surface fraction (BS/TS), trabecular width (Tb.Wi), trabecular spacing (Tb.Sp) and trabecular number are the most commonly used parameters to quantify structure of trabecular bone. In our method, they are measured as follows.
• BS/TS
BS/TS may be calculated in two ways. The first is a mesh-based BT/TS which is done by dividing the total area occupied by bone segments by the total area of the 2D projection of trabecular structure:
bone segments
/
(Width Length)image
Area
BS TS=
×
∑
The second is voxel-based BS/TS: Number of bone voxels /
Total number of voxels
BS TS=
[image:4.595.356.505.224.323.2] [image:4.595.103.245.254.531.2]• Tb.Wi
Tb.Wi is calculated as the area weighted mean width using the area (Ai) and width (wi) of individual trabeculae.
. i i
mesh based i w A TbWi A × =
∑
∑
Tb.Wi represents the mean thickness value of all the beams of trabecular bone of the 2D structure.
• Tb.Sp
Area weighted mean can also be used to estimate the average separation of the struts when applied to the inverse of the structure. Tb.Sp here is defined as the mean width of the inter-trabecular spaces or pores.
• Tb.N
Trabecular number, Tb.N is taken as the inverse of the mean distance between the mid-axes of the structure to be examined. / . . BS TS Tb N TbWi =
Tb.N gives an idea of the percentage of trabecular bone present in the volume against the mean trabecular thickness.
2.7. Numerical Results in Fracture Process
To study the failure behaviour of trabecular architecture, time-lapsed 2D images of a cancellous at 6 stepwise micro-compression loading were acquired [30]. In the uni-axial compression, the mounted specimen is subjected to a set of progressive mono-cyclic nominal strains at a constant strain rate. The specimen is allowed to relax after each incremental strain. This process is continued until fracture occurrence at the fourth stage.
The BS/TS of trabecular structure for different stages of loading was measured and summarised in Table 3. It can be seen that the incremental load applied to the specimen increased the value of bone surface fraction for the entire structure before fracturing. This is mainly due to reduction in the area occupied by pores in trabecular structure. However, it can also be justified by 3D nature of trabecular structure. Applying the compression load to this structure results in displacement of trabeculae in three different dimensions. As such, movements along the dimension perpendicular to the imaging plane results in variation of BS/TS at different stages of loading. From Table 3 we see that our vector based calculation has the same trend with the voxel based method.
Trabecular width for different stages of loading was measured and along with surface fraction was used to calculate trabecular number (Table 4). During fracture process, the value of Tb.Wi increased, which can also be explained by 3D displacements of individual trabeculae. Despite the same trend in values of Tb.Wi and BS/TS, increase in the value of Tb.N indicates a higher load sensitivity of bone surface fraction, and hence, reduction of
[image:5.595.312.554.111.224.2]average trabecular width when compared against BS/TS. Table 3. Nominal strain and BS/TS of different stages of loading Loading
stage Total strain Voxel based BS/TS Mesh based BS/TS
0 0 0.212 0.136
1 0.017 0.212 0.138
2 0.026 0.218 0.142
3 0.054 0.228 0.153
4 0.082 0.268 0.192
5 0.097 0.225 0.150
Table 4. Tb.Wi and Tb.N at different stages of loading Loading
stage Mesh based BS/TS Voxel based Tb.Wi (px) Tb.Wi (px) (1/px) Tb.N 0 0.136 14.591 12.15 1.12 1 0.138 14.503 12.19 1.13 2 0.142 14.846 12.46 1.14 3 0.153 15.202 12.66 1.21 4 0.192 17.511 14.62 1.31 5 0.150 15.046 12.61 1.19
In table 4, voxel based Tb.Wi is calculated by 2
.
. / voxel based
TbWi
B Pm BS
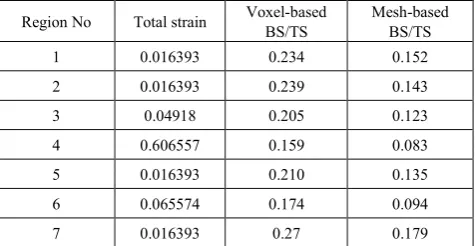
= (B.Pm = Bone perimeter) To study the effect of heterogeneity in fracture mechanism of trabecular structure, the resulting images before loading (A) and after fracture occurrence (B) were shown in Figure 10. The initial structure of trabeculae was divided into sub-regions perpendicular to the direction of loading. The size of the sub-region was chosen based on minimization of the least subregion BS/TS in trabecular structure. The deformation of the subregion with the minimum BS/TS relative to the other subregions comprising the specimen (including the deformation of individual trabeculae) was tracked during sequential compression steps to identify the weakest (least rigid) subregion of the specimen. The first and the last sub-region were excluded from the measurements in order to avoid the effects of end attachments in the calculations of micro-structural indices. The BS/TS for different regions are shown in Table 5.
Table 5. Nominal strain and BS/TS of different sub-regions in trabecular structure
[image:5.595.314.552.633.756.2]Table 6. Change in dimensions of trabeculae oriented along three main directions
Direction Apparent Number Fraction
Average
Length (px) Width (px) Average
Trabecular Latitudinal Strain Trabecular Transverse Strain
Apparent
Number Fraction Strain (%) Average Apparent Number Fraction Strain (%) Average
Longitudinal 0.40 96.97 11.77 0.37 -0.08 0.48 -0.07 0.63 +0.06 0.52 +0.15
Oblique 0.51 65.73 12.60 0.33 -0.13 0.42 -0.17 0.66 +0.13 0.58 +0.12
Transverse 0.09 40.64 12.03 0 0 0.5 -0.2
1 +0.17 0.5 0.07
BS/TS measurement for different sites demonstrated that the least rigid segment of the specimen where the most deformation occurred had the minimum value for BS/TS. The same results were reported by previous studies [31]. The change in geometrical parameters of individual trabeculae during fracture process for different subregions and orientations was computed and summarised in Table 6. As can be seen, longitudinal trabecula were greater in number and thinner than trabeculae in transverse direction. No significant change in the length of longitudinal trabeculae was observed. However, majority of these trabeculae thickened during the fracture process. In oblique direction, 66% of total trabeculae oriented in this direction, were stretched as a result of incremental load. The main changes in trabeculae geometry were observed in transverse direction. All the trabeculae oriented in this direction were stretched with 17% average nominal strain. Half of these trabeculae experienced 20% reduction in average width, while the rest thickened with 7% mean nominal strain.
(A)
[image:6.595.71.289.536.747.2](B)
Figure 10. Trabecular structure obtained from microCT and binary representation before loading (A) and after fracture occurrence (B)
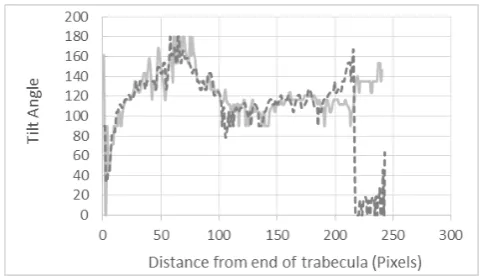
Figure 11. Width profile of a sample trabecula shown in Figure 10
[image:6.595.311.553.565.695.2]deformation (sharp orientation change) occurred at the sites with the lowest value of local width.
Figure 12. Orientation profile of a sample trabecula shown in Figure 10
3. Conclusion
Many researchers have examined the effect of changing bone density on the structural properties of whole trabecular structure, but few have evaluated the biomechanical consequences of specific changes in trabecular morphology due to compression.
In this paper, structural histomorphometric parameters for morphology measurements are obtained in two ways: mesh based measurement at multiple locations by Delaunay Triangulation or voxel based calculation. Changes in dimensions of individual trabeculae subjected to incremental load have been studied, especially, the values of the most significant structural parameters of the cancellous bone, BS/TS, Tb.Wi, and Tb.N in different stages of incremental loading were calculated. The values of Tb.Wi obtained from traditional voxel based approach were on average 20% larger than the results from mesh based method. The Tb.Wi obtained from voxel based method can be a good measure for comparing the thickness of trabecular structures. However, as this is a scalar this measure may not be able to describe all structural changes. This calculation does not differentiate between length and width, and is statistically equivalent to the mean of all intercept length measures. Hence, due to larger number of thinner horizontal trabeculae as compared with the number of thicker vertically oriented trabeculae, Tb.Wi falls between the mean true width computed for the horizontal and vertical trabeculae. Thus, it could be useful to rather compare the histograms, where the two cases could clearly be distinguished. While the width obtained from the proposed method is based on true width estimation of individual trabeculae.
It was also observed that least rigid segment of the specimen where the most deformation occurred had the minimum value for BS/TS. Moreover, thinning of trabeculae did not occur uniformly during overloading of trabecular bone. Trabeculae oriented along transverse direction tended to be perforated, become thinner, or
eventually disappear while those oriented longitudinally tended to retain their thickness. Local orientation is an efficient indice to indicate the occurance of fracture. Local thickness changes homogeniousely during the loading procedure.
REFERENCES
[1] G. M. Blake, H. W. Wahner, I. Fogelman. The Evaluation of Osteoporosis: Dual Energy X-Ray Absorptiometry in Clinical Practice”. 2nd edition, Informa Healthcare, Martin Dunitz 1998.
[2] D. Ulrich, B. Van Rietbergen, A. Laib, P. Ruegsegger. The ability of three-dimensional structural indices to reflect mechanical aspects of trabecular bone, Bone, Vol.25, No. 1, 55-60, 1999.
[3] B. Vidal, A. Pinto, M. J. Galvão, A. R. Santos, A. Rodrigues, R. Cascão, S. Abdulghani, J. Caetano-Lopes, A. Ferreira, J. E. Fonseca, H. Canhao. Bone Histomorphometry revisited, Acta Reumatol Port, Vol. 37, 294-300, 2012.
[4] L. Mosekilde Age-related changes in vertebral trabecular bone architecture assessed by a new method, Bone, Vol.9, No. 4, 247-250, 1988.
[5] J. C. Rice, S. C. Cowin and J. A. Bowman. On the dependence of the elasticity and strength of cancellous bone on apparent density, Journal of Biomechanics, Vol. 21, No. 2, 155-168, 1988.
[6] D. R. Carter, W. C. Hayes. The compressive behavior of bone as a two-phase porous structure, J Bone Joint Surg Am, Vol. 59, No. 7, 954-962, 1977.
[7] D. Steines, S. W. Liew, C. Arnaud, R. Vargas-Voracek, A. Nazarian, R. Müller, et al. Radiographic trabecular 2D and 3D parameters of proximal femoral bone cores correlate with each other and with yield stress. Osteoporosis international. Vol. 20, 1929-1938, 2009.
[8] E. M. Lochmüller, J. Kristin, M. Matsuura, V. Kuhn, M. Hudelmaier, T. Link, et al. Measurement of trabecular bone microstructure does not improve prediction of mechanical failure loads at the distal radius compared with bone mass alone, Calcified tissue international, Vol. 83, 293-299, 2008. [9] Q.H. Qin. Mechanics of Cellular Bone Remodeling: Coupled
Thermal, Electrical, and Mechanical Field Effects, CRC Press, Boca Raton, 2013.
[10] Q.H. Qin, J.Q. Ye, Thermoelectroelastic solutions for internal bone remodeling under axial and transverse loads, International Journal of Solids and Structures, Vol. 41, 2447-2460, 2004.
[11] C. Qu, Q. H. Qin, Y. Kang. A hypothetical mechanism of bone remodeling and modeling under electromagnetic loads, Biomaterials, Vol. 27, 4050-4057, 2006.
[12] Q. H. Qin, C. Qu, J. Q. Ye, Thermoelectroelastic solutions for surface bone remodeling under axial and transverse loads, Biomaterials, Vol. 26, 6798-6810.
material with microcavities, International Journal of Solids and Structures, Vol. 35, 5085-5095, 1998.
[14] S. W. Yu, Q. H. Qin. Damage analysis of thermopiezo- electric properties: Part II. Effective crack model, Theoretical and Applied Fracture Mechanics, Vol. 25, 279-288, 1996.
[15] Q.H. Qin. Micromechanics-BE solution for properties of piezoelectric materials with defects, Engineering analysis with boundary elements, Vol. 28, 809-814, 2004.
[16] Q. H. Qin, Y. W. Mai, S. W. Yu. Effective moduli for thermopiezoelectric materials with microcracks, International Journal of Fracture, Vol. 91, 359-371, 1998. [17] Q. H. Qin, M. V. Swain. A micro-mechanics model of dentin
mechanical properties, Biomaterials, Vol. 25, 5081-5090, 2004.
[18] Y. Wang, Q. H. Qin. A generalized self-consistent model for effective elastic moduli of human dentine, Composites science and technology, Vol. 67, 1553-1560, 2007.
[19] J. S. Thomsen, E. N. Ebbesen, L. I. Mosekilde. Age-related differences between thinning of horizontal and vertical trabeculae in human lumbar bone as assessed by a new computerized method, Bone, Vol. 31, 136-142, 2002.
[20] K. Oda, Y. Shibayama, M. Abe, T. Onomura.
Morphogenesis of vertebral deformities in involutional osteoporosis. Age-related, three-dimensional trabecular structure, Spine, Vol. 23, 1050-1055, 1998.
[21] A. Odgaard. Three-dimensional methods for quantification of cancellous bone architecture, Bone, Vol. 20, 315-328, 1997.
[22] A. M. Parfitt, M. K. Drezner, F. H. Glorieux, J. A. Kanis, H. Malluche, P. J. Meunier, S. M. Ott, R. R. Recker. Bone
histomorphometry: Standardization of nomenclature, symbols, and units: Report of the asbmr histomorphometry nomenclature committee, Journal of Bone and Mineral Research, Vol. 2, No. 6, 595-610, 1987.
[23] T. Hildebrand, P. Rüegsegger. A new method for the model-independent assessment of thickness in three-dimensional images, Journal of Microscopy, Vol. 185, 67-75, 1997.
[24] T. M. Keaveny, E. F. Morgan, G. L. Niebur, O. C. Yeh. Biomechanics of trabecular bone, Annual review of biomedical engineering, Vol. 3, 307-333, 2001.
[25] J. R. Shewchuk. Triangle: Engineering a 2D quality mesh generator and Delaunay triangulator, Applied Computational Geometry Towards Geometric Engineering, Vol. 1148, 203-222, 1996.
[26] Y. Xiao, J. J. Zou, H. Yan, An adaptive split-and-merge method for binary image contour data compression, Pattern Recognition Letters, Vol 22, 299-307, 2003.
[27] J. J. Zou, H. Yan, Skeletonization of Ribbon-Like Shapes Based on Regularity andSingularity Analyses, IEEE Transactions on Systems, Man, And Cybernetics, Part B: Cybernetics, Vol. 31, 401-407, 2001.
[28] M. Brady. Criteria for Representation of Shape, in: Human and Machine Vision, J. Beck, B. Hope and A. Rosenfeld, Eds. New York:Academic, pp. 39–84, 1983.
[29] I. Rock. An Introduction to Perception, New York: Macmillan, 1975.
[30] J. Wolff. Das Gesetz der Transformation der Knochen, Berlin: Hirschwald, 1892.