IOP Conference Series: Earth and Environmental Science
PAPER • OPEN ACCESS
Simulation of Shear and Bending Cracking in RC
Beam: Material Model and its Application to Impact
To cite this article: S N Mokhatar et al 2018 IOP Conf. Ser.: Earth Environ. Sci. 140 012130
View the article online for updates and enhancements.
Related content
Dynamic response of RC beams strengthened with near surface mounted Carbon-FRP rods subjected to damage R Capozucca, M G Blasi and V Corina
-Damage assessment in PRC and RC beams by dynamic tests
R Capozucca
-Strengthening and repair of RC beams with sugarcane bagasse fiber reinforced cement mortar
Mohamad Syamir Senin, Shahiron Shahidan, M Z Md Maarof et al.
1234567890 ‘’“”
IConCEES 2017 IOP Publishing
IOP Conf. Series: Earth and Environmental Science 140 (2018) 012130 doi :10.1088/1755-1315/140/1/012130
Simulation of Shear and Bending Cracking in RC Beam:
Material Model and its Application to Impact
S N Mokhatar1, Y Sonoda2, S S M Zuki3, A F Kamarudin4 and M S Md Noh5
1,3,4,5 Repair, Strengthening and Rehabilitation Structures Focus Group, Jamilus Research Centre,
Faculty of Civil & Environmetal Engineering, Universiti Tun Hussein Onn Malaysia, 86400, Parit Raja, Batu Pahat, Johor, Malaysia
2 Structural Analysis Laboratory, Department of Civil Engineering, Kyushu University, Motooka
744, Nishi-ku, Fukuoka, Japan
Corresponding author: [email protected]
Abstract. This paper presents a simple and reliable non-linear numerical analysis incorporated with fully Lagrangian method namely Smoothed Particle Hydrodynamics (SPH) to predict the impact response of the reinforced concrete (RC) beam under impact loading. The analysis includes the simulation of the effects of high mass low-velocity impact load falling on beam structures. Three basic ideas to present the localized failure of structural elements are: (1) the accurate strength of concrete and steel reinforcement during the short period (dynamic), Dynamic Increase Factor (DIF) has been employed for the effect of strain rate on the compression and tensile strength (2) linear pressure-sensitive yield criteria (Drucker-Prager type) with a new volume dependent Plane-Cap (PC) hardening in the pre-peak regime is assumed for the concrete, meanwhile, shear-strain energy criterion (Von-Mises) is applied to steel reinforcement (3) two kinds of constitutive equation are introduced to simulate the crushing and bending cracking of the beam elements. Then, these numerical analysis results were compared with the experimental test results.
1.Introduction
Currently, the developments of mesh-free particles method such as Smoothed Particle Hydrodynamics (SPH) become a new trend as a valuable computational tool besides the FE Method. Previous application of SPH has been widely used for the high velocity impact computation to solve the problems of solids mechanics. Swaddiwudhipong et al. [1] and Johnson [2] have successfully applied this kind of mesh-free method to the high impact velocity of 170 m/s and higher to study the perforation/penetration of target materials such as steel and plain concrete. On the other hand, tensile responses simulation of RC structures have been extensively presented such as in the study of Fukazawa et al. [3] and Mokhatar et al. [4], however, limited research study can be found on the compressive behavior subjected to the low velocity impact loads using SPH method .
2
1234567890 ‘’“”
IConCEES 2017 IOP Publishing
IOP Conf. Series: Earth and Environmental Science 140 (2018) 012130 doi :10.1088/1755-1315/140/1/012130
.
2.Numerical Simulation Setting
2.1. Adaptive Smoothed Particle Hydrodynamics (ASPH)
Generally, the procedure of this method is similar to the conventional SPH. Some modification has been made to the kernel function by implementing three independent smoothing kernel functions on the orthogonal three coordinates, in which considering anisotropic kernel function instead isotropic. The first derivative of an ASPH method as shown in equation (1):
z z y x z y y x z y x W W W W W W W W x W W
, , (1)
In general, the performance of ASPH calculation can be summarized by:
1) The interactive particle in the influence area is defined prior updating the time increment.
2) Calculate the kernel function or integral approximation. For impact calculation, the contact
forces are calculated by using kernel function.
3) The momentum equation that replacing the gradient of stress to the kernel approximation was
computed under the force thread. In this formulation, the artificial viscosity of Monaghan has been used in order to simulate shock and to prevent the unnecessary penetration for particle during impact
4) Compute the strain rate tensor by replacing the velocity gradient to the kernel approximation.
5) Update the strain due to the time increment and update the stress by applying the constitutive
equation.
2.2 RC Beam Model
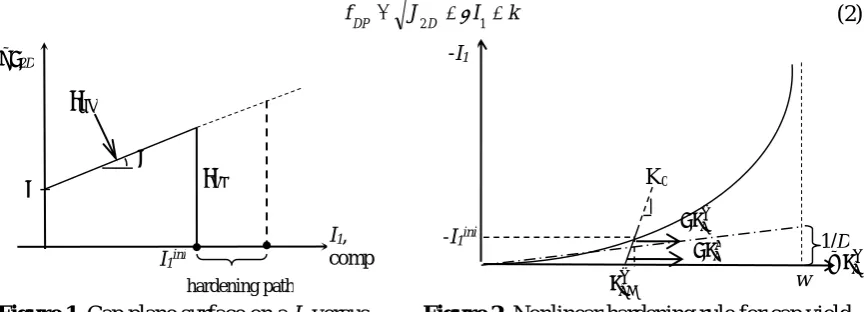
The strength of the concrete is predicted by using pressure dependent Drucker-Prager yield criterion. Meanwhile, plane-cap yield surface is utilized to control the volumetric expansion as well as to bound the model in the hydrostatic compression axis [7]. Refer Figure 1, equation (2) and equation (3),
k I J f
D
[image:3.595.83.516.473.629.2]DP 2 1 (2)
Figure 1. Cap plane surface on a I1 versus
√J2D plot
Figure 2. Nonlinear hardening rule for cap yield surface
whereJ2Dis second invariant of the deviatoric tensor, I1 is first invariant of the stress tensor and α is
positive material constant. The hardening rule of plane cap is shown in Figure 2 and the yield surface is written as p v p v PC d wD I f ) ( 1 1 (3)
I1ini 𝛼 𝑓𝐷𝑃 √J2D 𝑓𝑃𝐶 hardening path 𝑘
I1,
comp 𝑑𝜀𝑣𝑡 1/D
K0
𝜀𝑣0 𝑝
𝑑𝜀𝑣𝑝
w -I1ini
−𝜀𝑣 𝑝
1234567890 ‘’“”
IConCEES 2017 IOP Publishing
IOP Conf. Series: Earth and Environmental Science 140 (2018) 012130 doi :10.1088/1755-1315/140/1/012130
where 𝜔 = 1 − 𝜀𝑣0𝑝 , while 𝜀𝑣𝑝 is denoted as current degree of compaction, w and D are denoted as
materials constant. 𝜀𝑣0𝑝 and 𝑑𝜀𝑣𝑝is defined as initial degree of compaction and incremental volume
plastic strain, respectively, while 𝑑𝜀𝑣𝑡 is denoted as total volumetric strain. Hydrostatic pressure I1ini of
60 MPa is used as initial limit value. According to Poinard et al. [8[, this value initiated the damage of cement matrix.
In order to define the accurate strength of material during the short period, Dynamic Increase Factor (DIF) has been employed for the effect of strain rate on the compression and tensile strength of the concrete. The constitutive equation of the DIF in compression and tension given by Bischoff et al. [9] and Zhou et al. [10] are expressed in equation (4) and (5), respectively.
1.026
cs cd CDIF
for cd ≤ 30s-1 (4a)
3 1cd
CDIF for cd
> 30s
-1 (4b)where, 𝜀𝑐𝑑̇ is the strain rate for the dynamic compressive strength, based on literatures, for impact
loading, the magnitude of strain rate can range from 10-6 to 1000s-1. Therefore, the value of static
compressive strength 𝜀𝑐𝑠̇ =30.0e-6 is used. logγ = 6.156α – 0.49, α = [5.0 + 3.0(fcu/4.0)]-1, where fcuis the
compressive strength of static cube,
1.016
ts d TDIF
for d≤ 30s-1 (5a)
3 / 1 ts d ts td f f
TDIF
for d>30s-1 (5b)
In tension, the range of 10-6 to 100s-1 strain rate
d
for the dynamic tensile strength is utilized. In this
empirical formula, the value of logβ is [7.11δ – 2.33], where, δ = 1/[10+6(fcu/fc’)], fc’ is 10Mpa.
In this model, two kinds of constitutive models are developed to simulate the crushing, shear cracking as well as bending cracking. For crushing phenomena, the constitutive equations of the cap model is used as below
klp v e ijkl kl ep ijkl ij d W D D d D d 3 2 9 2 3 2 (6)
The mechanism of cracking in tension side is simulated by the softening technique, where, the damage variable is multiplied to the fourth-order undamaged elastic stiffness tensor. In which, the variables were employed during the softening phase to give the real shear cracking behavior of RC beam after impact phenomena. Thus, orthotropic constitutive equation is applied as
kl e ijkl z y x kl ep ijkl
ij D d D
[ ]
, ,
4
1234567890 ‘’“”
IConCEES 2017 IOP Publishing
IOP Conf. Series: Earth and Environmental Science 140 (2018) 012130 doi :10.1088/1755-1315/140/1/012130
Three principle strains x,y,z (positive value) components are used for the damage factor,
z y x i
di i; , , , where, these principal strains corresponds with 3 directions x,y,z are calculated based
on the local coordinate. Equation (8) shows the classical damage formulation, φ for the damage variable;
x
x 1d
(8a)
y y 1d (8b)
z
z 1d
(8c)
3. Analysis Result
In order to validate the proposed material model, the numerical results were compared with two practical tests that were carried out by [5] and [6]. The first experimental results is by Chen et al. [5]. Chen et al. [5] investigated high mass – low velocities (7.3 m/s and 5.3 m/s) impact behavior of reinforced concrete beam and resulting dynamic response of the total structure, where, the symmetric model of 1800 mm (1500 mm span) and 3000 mm (2700 mm span) length of pin-supported beams are examined. The total size of the beam is 200 mm x 100 mm in depth and width. All of these beams were pinned 150 mm from the ends. The beam is reinforced with 6 mm diameter and 12 mm diameter high yield steel bars as top and bottom reinforcement, respectively. The concrete cover between the main reinforcement bars and the top and bottom edges of the beam is 20 mm. The stirrups of 6 mm are spaced at 200 mm intervals. In addition, a flat impact mass is used. The diameter and weight of flat impact mass is 100 mm and 98.7 kg, respectively.
[image:5.595.73.511.669.758.2]The second validation used the experimental data from Fujikake et al. [6]. Fujikake et al. [6] examined high mass low-velocity impact behavior of RC beam. The RC beam is 250 mm, 150 mm and 1700 mm in depth, width and length respectively. Total span of RC beam is 1400 mm. The details of reinforcement arrangement and test setup used in the tests can be found in [6]. The drop mass is acted vertically from a certain height about 1.2 m (correspond to 4.9 m/s velocity), and its weight is 400 kg. the failure mode of the RC beam can be obtained in Table 1.
Table 1. Reinforcement size and its failure characteristics by [6]
Denotation of beam
specimens
Compression Tension
Velocity
(m/s) Failure mode
Number-size (mm) Number-size (mm)
S1616 2-D16 2-D16 4.9 Vertical flexure crack,
crushing
S1322 2-D13 2-D22 4.9 Vertical flexure crack,
total crushing
3.1 Numerical simulation for experimental results by Chen et al. [5]
From Figure 3, it can be clearly seen that this proposed model give similar crack pattern and failure modes with the experimental results. Extensive crushing under the projectile was calculated by constitutive equation (6). Furthermore, bending cracking are also obtained from tensile softening technique by reducing the elastic stiffness tensor. Finally, the orthotropic constitutive equation (7) is used to simulate the shear cracking phenomena.
(a) Simulation results (quarter model) (b) Experimental results
Figure 3. Comparisons between numerical results with experimental results for 1500 mm span beam
Extensive crushing beneath the impactor
Shear cracking Bending cracking Shear cracking
CL
Bending cracking
Crushing
1234567890 ‘’“”
IConCEES 2017 IOP Publishing
IOP Conf. Series: Earth and Environmental Science 140 (2018) 012130 doi :10.1088/1755-1315/140/1/012130
The velocity of projectile is reduced to 5.3 m/s velocity. As shown in Figure 4, the results from numerical simulations show good agreement with experimental investigations by Chen et al. [5]. Based on Figure 4(a), the proposed model presents comparable results in term of propagations of vertical cracking, bending cracking and inclined cracking tendency.
(a) Simulation results (quarter model)
(b) Experimental results
Figure 4. Comparisons between numerical results with experimental results for 2700 mm span beam
In addition, the calculation of maximum displacement for the 2700 mm span beam and its displacement curve are accurately analyzed as shown in Figure 5. This figure also verified that the bending behavior is well correspond to the experimental results. However, some differences in the oscillation periods are investigated. This phenomenon could be improved by modifying the artificial viscosity parameter used in this calculation.
Figure 5. Displacement-time histories at 300 mm from mid span
3.2 Numerical simulation for experimental results by Fujikake et al. [6]
In experimental tests, shear design strength of specimens must be larger than that of bending strength in order to generate bending failure. Thus, the flexural behavior is investigated critically in the bottom side of a specimen as shown in Figure 6(b). In this study, the numerical result in Figure 6(a) shows the comparable results with Figure 6(b). Flexural bending cracks for specimen S1616 was simulated efficiently by using the proposed constitutive equation (7). The model utilizes the decreasing of elastic material’s stiffness as explained in the section 2.2. Conversely, in the compression side, some local failure in the impact region can be calculated similarly with an experimental overall response by utilizing equation (6). The degree of compaction in this region is controlled by the hardening rule of the PC model.
-35.00 -30.00 -25.00 -20.00 -15.00 -10.00 -5.00 0.00 5.00
0 10 20 30 40 50 60 70 80 90 100
disp (mm)
time (ms)
Simulations
Practical results Shear cracking
Bending cracking
Shear cracking Shear cracking
Bending cracking
CL
6
1234567890 ‘’“”
IConCEES 2017 IOP Publishing
IOP Conf. Series: Earth and Environmental Science 140 (2018) 012130 doi :10.1088/1755-1315/140/1/012130
(a) Numerical results (quarter model)
(b) Experiment results (full view) (c) Mid-span displacement-time histories
Figure 6. Comparison results between numerical and experimental test (S1616)
The investigation of accuracy of numerical results was extended to the displacement-time relationships as shown in Figure 3(c). Based on the graph, it is indicated that the maximum mid-span displacement and its curve are accurately analyzed with the experimental tests.
The proposed numerical analyses were further validated with the lower amount of longitudinal compressive reinforcement in order to calculate the increasing of damage failure in the impact region. Fujikake et al. [6] discovered that the degree of local failure in the impact region is related to the increasing amount of tensile reinforcement. As shown in Figure 7(b), the specimen S1322 and S1616 failed by crushing at the impact point.. This phenomenon can be analyzed by using the proposed constitutive equation of PC model [refer Fig. 7(a)], where the calculation of volumetric plastic change in the hydrostatic compression is capable to simulate this mechanism.
(c) Mid-span displacement-time histories (a) Numerical results (quarter model)
(b) Experiment results (full view)
Figure 7. Comparison results between numerical and experimental test (S1322)
-40.00 -35.00 -30.00 -25.00 -20.00 -15.00 -10.00 -5.00 0.00
0 5 10 15 20 25 30 35
disp (mm)
time (ms)
Proposed model
Experiment
-25.00 -20.00 -15.00 -10.00 -5.00 0.00
0 5 10 15 20 25 30
disp(mm)
time (ms)
Proposed model
Experiment Flexural crack
Crushing Flexural crack
CL
Crushing
Pin-support
CL
Total crush
Flexural crack
Total Crush
1234567890 ‘’“”
IConCEES 2017 IOP Publishing
IOP Conf. Series: Earth and Environmental Science 140 (2018) 012130 doi :10.1088/1755-1315/140/1/012130
The data from the analyses and experimental test of specimen S1322 is compared to obtain the mid-span displacement.. In general, the shape of the displacement curves from the analysis are in reasonable agreement with the tests, however, there is some difference in the peak displacement value about 2 mm. This comparison can be found in Figure 7(c). It shows that the strong dependence on hydrostatic pressure can decrease the displacement values under a certain impact phenomena.
4. Conclusion
The results have shown that an application of the SPH method incorporated with a new Drucker Prager-Plane Cap model is able to simulate crushing phenomenon under the compaction (compression) region, while the tensile-cut off followed by softening technique that utilizing orthotropic constitutive equation can give the reliable calculation of flexure/bending mechanism. Besides, the Plane Cap model defines the motion of subsequent yield surface during plastic loading by controlling the volumetric change. However, to obtain more reasonable and realistic estimation of damage behavior of RC elements, further study on SPH calculations and other numerical technique should be conducted numerously.
Acknowledgement
The authors would like to acknowledge financial support provided by University Tun Hussein Onn Malaysia under Research Supporting Grant Scheme RSGS Code U100.
References
[1] Swaddiwudhipong S, Islam M J and Liu Z S 2010 High Velocity Penetration/Perforation Using
Coupled Smoothed Particle Hydrodynamics-Finite Element Method. Int. J. of Protective
Struct.1 pp. 489- 506.
[2] Johnson G R 2011 Numerical algorithms and material models for high-velocity impact
computations. Int. J. of Impact Eng. 38 pp. 456-472.
[3] Fukazawa J and Sonoda Y 2011 Analysis accuracy of impact failure response of reinforced
concrete beam using ASPH method. J. of Struct. Eng. (JSCE)57A pp 1205-1212 (Japanese).
[4] Mokhatar S N, Sonoda Y and Fukazawa J 2016 Application of orthotropic constitutive model
incorporated with SPH to simulate tensile failure of RC beam. ARPN J. of Eng. and Applied
Sc. 11 pp 2614 – 2621.
[5] Chen Y and May I M 2009 Reinforced concrete members under drop-weight impacts. Proc. of
Inst. of Civil Eng. Structures and Buildings 162 pp 45-56.
[6] Fujikake K, Li B and Soeun S 2009 Impact Response of Reinforced Concrete Beam and Its
Analytical Evaluation. J. of Struct. Eng. American Society of Civil Eng. 135 pp. 938-950.
[7] Resende L 1987 A Damage mechanics constitutive theory for the inelastic behaviour of concrete.
Computer Methods in App. Mech. and Eng. 60, pp. 57-93.
[8] Poinard C, Malecot Y, and Daudeville 2010 Damage of concrete in a very high stress state:
experimental investigation. Materials and Struc.43 pp. 15-29.
[9] Bischoff P H and Perry S H 1991 Compressive Behaviour of Concrete at high strain rates. J. of
Materials and Struct.24 pp. 425-450.
[10] Zhou X Q and Hao H 2008 Modelling of Compressive Behaviour of Concrete-Like Materials at
![Table 1. Reinforcement size and its failure characteristics by [6] Compression Tension](https://thumb-us.123doks.com/thumbv2/123dok_us/8756821.893069/5.595.73.511.669.758/table-reinforcement-size-failure-characteristics-compression-tension.webp)
