Photoactive thin silver films by
atmospheric pressure CVD
Yates, HM, Brook, LA and Sheel, DW
http://dx.doi.org/10.1155/2008/870392
Title
Photoactive thin silver films by atmospheric pressure CVD
Authors
Yates, HM, Brook, LA and Sheel, DW
Type
Article
URL
This version is available at: http://usir.salford.ac.uk/18576/
Published Date
2008
USIR is a digital collection of the research output of the University of Salford. Where copyright
permits, full text material held in the repository is made freely available online and can be read,
downloaded and copied for noncommercial private study or research purposes. Please check the
manuscript for any further copyright restrictions.
Volume 2008, Article ID 870392,8pages doi:10.1155/2008/870392
Research Article
Photoactive Thin Silver Films by Atmospheric Pressure CVD
Heather M. Yates, Lucy A. Brook, and David W. Sheel
Institute for Materials Research, Salford University, Manchester M5 4WT, UK
Correspondence should be addressed to Heather M. Yates,h.m.yates@salford.ac.uk
Received 24 July 2007; Revised 22 November 2007; Accepted 26 March 2008
Recommended by Russell Howe
We report the visible and UV activity of thin silver films. The films are grown using a CVD process employing aqueous-based silver precursors, flame-assisted chemical vapour deposition. This approach overcomes many of the previously encountered limitations to silver deposition by employing an atmospheric pressure process, low-cost and low-toxicity precursors. The resultant films are assessed for activity using stearic acid destruction as a model compound. We also report on the addition of titania to these silver films to increase the potential functionality. This activity is also demonstrated, where the films appear largely transparent to the eye, further widening the potential application of this work. It is speculated that the nanoparticulate nature, of the CVD silver, is crucial in determining photoactivity.
Copyright © 2008 Heather M. Yates et al. This is an open access article distributed under the Creative Commons Attribution License, which permits unrestricted use, distribution, and reproduction in any medium, provided the original work is properly cited.
1. INTRODUCTION
In recent years, photoactive films have attracted increasing attention, particularly based on titania. Significant efforts have been directed at developing the photoactivity of titania into the visible. Methods have included use of other photoac-tive materials in conjunction with TiO2 including WO3[1]
and PdO [2], or by doping with anionic [3,4], or cationic [5] species. To date, the results have been mixed. In many cases, the doping itself leads to a reduction in photoactivity, often attributed to disruption of the crystal structure [6] and/or the introduction of compensation centres [7]. Some papers do claim visible activity [8], although the form and mechanism of how the photoactivity works is often in dispute [9].
The combination of Ag and TiO2 produced mainly by
sol-gel techniques has been shown to improve TiO2 UV
photoactivity, under the correct conditions. In some cases, this has been shown to relate to the modification of the sample morphology by the Ag with, for example, a change in crystallite size [10] or rutile/anatase [11]. The addition of Ag is considered to promote charge separation of the electron-hole pairs from TiO2after photon absorption by acting as an
electron sink.
Research literature of the behaviour of just Ag under illuminated light relates mainly to its own transition rather than its effect on other chemical compounds. The reduction
of Ag+ions to Ag metal is well documented, and use of UV to
form the metal from ions is common practice. Commercial uses of the reduction of Ag+ ions include photography [12]
and photochromic glass [13]. Films of AgCl were found to be photocatalytic for the oxidation of water, but only in the presence of excess Ag+. This activity expanding from the UV
to visible due to self-sensitisation [14].
Other research relating to use of Ag in catalysis is usually in conjunction with zeolites, where the presence of Ag+
clusters increases the photodecomposition rate of specific organics by acting as active sites, or electron trapping sites [15], or decomposition of inorganics such as NO and H2O
[16]. In these cases, the zeolite is needed to isolate and stabilize the Ag+ions (and their clusters). The zeolite itself is
playing a role in the photoactivity of the catalyst, for example, the increased efficiency of the N2O decomposition reaction
with ZSM-5 opposed to zeolite Y [17]. There is only very limited literature available on the photoactivity of thin Ag films with organic materials. Research by Guo et al. [18] states that there is a possible photocatalyic reaction under laser excitation.
2 International Journal of Photoenergy
be produced by MOCVD [23,24]. Although these processes are effective at producing thin films, the degree of silver nanostructure control is typically limited.
In this paper, we report the use of flame-assisted chemical vapour deposition (FACVD) to produce silver nanostructured layers and coatings. The process can use aqueous precursors, which are in many cases very soluble, and of relatively low toxicity. Growth rates are also rapid in comparison to previous APCVD reports, and a high degree of nanostructure control can be achieved with this approach. Indeed, the nanostructured silver deposition control arising from our described approach appears to give an enhancement to photoactivity and also to the bioactivity of the various film structures, as previously shown [25]. We will report on the photoactivity of Ag films in both the visible and the UV, along with examples of Ag/TiO2 films. The
added attraction of the TiO2/Ag combination is the increased
durability of the samples, over that of Ag which is relatively soft and the additional high photoactivity expected of the TiO2under UV.
2. EXPERIMENTAL
2.1. Growth
All films were grown on commercially supplied silica-coated barrier glass substrates. The barrier is a thin (60 nm), amorphous film of SiO2to prevent diffusion of impurity ions
within the float glass. These would all cause a reduction in the quality and photoactivity of the films.
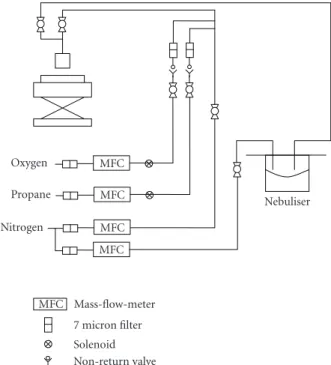
All silver films were produced by flame-assisted chemical vapour deposition (FACVD). The FACVD reactor used is of in-house construction. Basically, it consists of a burner head which allows gas mixing, a translational substrate stage and a precursor delivery system (electronic mass-flow controllers and a nebuliser). A schematic of the system is shown in
Figure 1. The substrate stage is made up of a carbon block which can be translated beneath the flame at a rate of 3.6 cm/s. The number of passes under the burner head is related to the sample thickness. The carbon block was held at 300◦C for optimum growth. The nebuliser is a commercially available ultrasonic system (ultra-neb2000 Devilbiss 200HS-042), with water used as the transmission medium. The precursor solution sits within a cup that in turn is in contact with the water in the nebuliser, such that ultrasonic waves are passed through to the precursor solution, hence producing droplets of precursor solution. Nitrogen carrier gas then passes through the nebuliser, collecting solution droplets, which are then transported to the flame. Fuelling the burner is a mixture of propane and oxygen gases, flowing at 0.99 L min−1and 3.65 L min−1, respectively, generating a flame output power of 1.50 kW. The precursor is carried in 1.70 L min−1 of nitrogen. These gases are also mixed with 13.90 L min−1 of make-up nitrogen for flame control. The precursor reagent used was silver nitrate supplied by Aldrich, with a purity of 99.99% dissolved in deionised water to the required concentration.
Electroplated silver was also deposited as a comparison to the FACVD films. These films were deposited using
Oxygen
Propane
Nitrogen
MFC
MFC
MFC
MFC
Nebuliser
MFC Mass-flow-meter
7 micron filter
Solenoid Non-return valve
Figure 1: Schematic of the FACVD system.
0.15 M silver nitrate in deionised water (solution A), 0.8 M potassium hydroxide in deionised water (solution B), and a 0.49 M glucose solution (solution C). The glucose solution was made up of 88% deionised water, 11% ethanol, and 1% concentrated nitric acid. The solutions were mixed in the ratio 16 : 8 : 1 of A : B : C, respectively, and deionised water was added to control the speed of the reaction. Concentrated ammonia was used to react with any oxide precipitation.
Titania films were grown using an atmospheric pres-sure CVD coater. The precursors used were titanium tetrachloride (4.9×10⁻⁴mol min−1) and ethyl acetate (3.65× 10⁻³mol min−1) (Aldrich), which were transported through
the reactor by a carrier gas of nitrogen. The substrate temperature was 650◦C. Silver was deposited both under and over these films by FACVD.
2.2. Characterisation
X-ray diffraction (Siemens D5000) was used to confirm the sample crystallinity. The morphology assessed by SEM (Philips XL30). Film thickness (for titania) was estimated by relating the reflected colour to a calibrated chart for thickness versus refractive index. Film thickness for the Ag was determined by cross-sectional SEM and the use of a surface profiler (Dektak 3ST) on an etched edge. X-ray pho-toelectron spectroscopy, XPS, (Kratos AXIS Ultra) with an Al (monochromated)Kαradiation source was used to check the
surface composition and stoichiometry of the films.
To test the photocatalytic behaviour under UV (365 nm), the degradation of stearic acid was followed by FTIR (Bruker, Vector 22). The software allows integration of the area under the peaks over a range of 2800–3000 cm−1. A typical
Acc.V 10 kV
Spot 2
Magn 12500×DetSE
WD
10.4 140905C 2μm
(a)
Acc.V 10 kV
Spot 2
Magn 12500×DetSE
WD
10 170204c 2μm
(b)
Acc.V 10 kV
Spot 2
Magn 12500×DetSE
WD
10 2302041100p Ag 2μm
(c)
Acc.V 10 kV
Spot 2
Magn 12500×DetSE
WD 10 080306a
2μm
(d)
Figure 2: SEM images of (a) Ag 2 passes, (b) Ag 30 passes, (c) Ag 100 passes, (d) electroplate Ag.
molecules cm−2[26]. The stearic acid (100μl of 10 mmoL
in methanol) was spun coated onto the sample. After drying in an oven, the sample was exposed to UV light with an intensity of 3 mW/cm2. For visible light measurements,
a high-intensity tungsten/halogen lamp (300 W) with a 400 nm cut-offfilter was used.
3. RESULTS AND DISCUSSION
In order to understand the influence of the various layer structures, both silver (by FACVD) and titania (by thermal CVD) were grown. The silver films were analysed, and both the silver and titania films were tested for photoactivity in the visible and the UV regions.
3.1. Visual
The Ag films were produced with a range of thickness (60–250 nm), by increasing the number of passes of the moving substrate under the flame. The comparison TiO2
films were all transparent (80 nm) with a brown tinge due to interference colouration. Visually, all the Ag films were highly reflective, with a pale pink tinge which darkens to purple for thicker coatings. The films could withstand gentle rubbing or sonification. Those with an upper layer of TiO2were slightly
more robust.
3.2. X-ray diffraction
All Ag films (FACVD and electroplated) were crystalline showing metallic cubic Ag only (JCPDS 04-0783). That of the titania was anatase (JCPDS 21-1272) when grown directly on a glass substrate (or under Ag film), while it contained some rutile (calculated at 33 wt%) when grown on top of the Ag film. Use of Scherrers formula [27] allows calculation of crystallite size (Table 1). The calculation is ideally for a powder not a thin film, so will contain line width broadening from strain as well as crystallite size. Despite
Table 1: Number of passes, thickness, and crystallite size.
Deposition time (number of passes)
Thickness, nm Crystallite size, nm
2 60 11
4 61 12
30 93 20
100 250 38
Electroplate 104 33
these reservations, the values obtained will give an idea of the changes occurring.
3.3. Chemical composition
Confirmation that the Ag films consisted of metallic Ag, not oxides (or sulphides) came from the XPS. The high-resolution scan only showed the 3d signals at 3d5/2 =
368.7 eV and 3d3/2=374.7 eV with a splitting of 6 eV which
are characteristic of metallic Ag. From the wide scan, a small amount of Si was detected, which almost certainly comes from the glass substrate. The O 1s signal consisted only of a single peak at 532.7 eV relating to absorbed water on the surface. No O 1s or Ag 3d signal was present for an oxide.
Both TiO2 deposited over Ag and the inverse (Ag over
TiO2) established that there was both TiO2 and Ag on the
surface. Obviously, in the case of Ag over TiO2the intensity
of the Ag signal was greater. The high-resolution scan showed Ti 2p signals at 2p1/2=464.7 eV and 2p3/2=459.0 eV, with a splitting of 5.7 eV, characteristic of TiO2. This was confirmed
by the O 1s signal at 530.2 eV.
3.4. Morphology
4 International Journal of Photoenergy
0 20 40 60 80 100 120 140 160 180 200 220 240 Time (min)
2 passes 4 passes 30 passes
100 passes Electroplate Titania 0.3
0.4 0.5 0.6 0.7 0.8 0.9 1 1.1
N
o
rm
aliz
ed
int
eg
ra
te
d
ar
ea
(cm
−
1)
Figure 3: UV photoactivity for Ag films of differing thickness (2, 4,
30, and 100 passes). Also included are the results for the electroplate silver ( ) and an 80 nm thick film of titania ( ).
a continuous film. The exact size and spacing depend on the growth conditions [28]. It is also important to note that the sample thickness is more correctly the height of the individual islands. As the number of passes is increased the particles gradually coalesce and form a continuous sheet. As can be seen inFigure 2(d), the electroplate Ag forms a continuous film with a granular surface.
3.5. Photoactivity
The photoactivity was assessed by use of stearic acid as a model system, as stearic acid simulates a typical type of solid organic film that deposits on glass and ceramic surfaces. However, it is important to note that if a material is highly photoactive with one model compound, it does not necessarily mean that it is as active with another, or even that the same relative rates of activity can be determined. This has been previously clearly shown with titania [29,30].
3.5.1. Photoactivity under UV radiation
The rate at which the stearic acid was decomposed is shown by the integrated area under the IR signals from the stearic acid (2957.5, 2922.8, and 2853.4 cm−1), which are directly
proportional to the concentration. For a period of up to 70 minutes, the FACVD Ag films showed signs of photoactivity, which then levelled out, as seen below in Figure 3. This is particularly obvious for the thinnest sample of 2 passes (60 nm). This behaviour does not occur for the thickest FACVD film of 100 passes (250 nm) or the electroplate film (104 nm).
There is an increased scatter in some of the measure-ments (enhanced by the normalisation). This is particularly obvious for the thickest film (100 passes) due to increased roughness and haziness. The hazy appearance of the thick
samples is due to increased crystalline disorder and increased crystallite size (i.e., above a critical particles size a film is perceived as hazy as more light is scattered).
That these decay curves for silver are real and not an artefact of the experimental set up (or instrument fault), a film of TiO2 was run over the same experimental period,
showing the expected zero-order curve as the stearic acid decomposes, (as seen in Figure 3). This is of a similar order to the initial rate of reaction (0–70 minutes) of the thinnest Ag layer (60 nm). A linear fit giving 0.0026 ±
0.0002 cm−1min−1(8.13×10¹² molecules cm−2min−1) for
the TiO2film and 0.0025±0.0002 cm−1min−1(7.81×10¹²
molecules cm−2min−1) for the initial rate of the Ag layer (2
passes). Most of the curves shown are obviously not linear, so have been fitted by a sigmoidal fit.
The lack of activity for the thick films may relate to differences in the morphology (continuous rather than island formation) and the crystallite size. As previously noted the thinner films have much smaller crystallite sizes (11– 20 nm) than that for the thicker films (33–38 nm). This change in crystallite size relates to the extent of deposition. Also, the smaller the nanoparticles, the greater the surface area and hence increased rate of photoactivity.
FromFigure 3, in particularly those for 4 and 2 passes, it can be seen that a point is reached at which no more stearic acid is decomposed. These coatings are noncontinuous, but previous research has shown that a pollutant can be removed from incomplete coatings of TiO2due to the mobile
electron/hole during the photoactive process [31]. This is not occurring here, suggesting that the mechanism for TiO2
photoactivity is different to that of the Ag.
3.5.2. Photoactivity under visible radiation
Before running the experiments, the emission of the “visible” lamp with and without the 400 nm cut-offfilter was checked. This confirmed that no obvious emission below 398 nm was detected with the filter in place.
Considering the UV experiments, a sharp reduction of the stearic acid is followed by a point of no change for the thinner samples (Figure 4), while the thicker samples do not show this behaviour, and confirming lack of photoactivity. For reference, a film of TiO2(which is not expected to show
any visible activity) has been added. This can be seen to show a slight reduction in values with time (10−4cm−1min−1,
3.12×10¹² molecules cm−2min−1), relating to stearic acid
changes due to temperature fluctuations and possibly UV undetected by the emission spectra. This trend is in line with that seen for the thicker samples (100 pass FACVD and electroless plate). The thinner samples show a much more pronounced change.
0 50 100 150 200 250 300 Time (min)
2 passes 4 passes 30 passes
100 passes Electroplate Titania 0.3
0.4 0.5 0.6 0.7 0.8 0.9 1 1.1
N
o
rm
aliz
ed
int
eg
ra
te
d
ar
ea
(cm
−
1)
Figure 4: Visible photoactivity for Ag films of differing thickness
(2, 4, 30, and 100 passes). Also included are the results for the electroplate silver ( ) and an 80 nm thick film of titania ( ).
0 50 100 150 200 250
Time (min) 0.4
0.5 0.6 0.7 0.8 0.9 1
N
o
rm
aliz
ed
int
eg
ra
te
d
ar
ea
(cm
−
1)
Figure 5: Repeated addition of stearic acid on a single Ag sample (2
passes). First stearic acid run , additional stearic acid added, and the experiment repeated once , twice .
energy levels lower than those in the bulk metal, and so enable a new transition, extending the process from the UV into the visible.
Interestingly, it was possible to repeat this behaviour on addition of more stearic acid, as shown in Figure 5
using the thinnest Ag layer (2 passes). After the standard stearic acid test had been carried out, more stearic acid was spun coated onto the sample and the test repeated. As can be seen the same trend occurs. The initial rate of the reaction (gradient) showed no significant change at 0.0033±
0.0004 cm−1min−1(1.25×10¹³ molecules cm−2min−1). In
fact, this value is compatible to the UV activity of a TiO2film
(80 nm).
A possible explanation for this behaviour is that the stearic acid would react with the Ag at the islands, but no
Acc.V 10 kV
Spot 2
Magn 50000×DetSE
WD
10 310105c 500 nm
Figure 6: SEM image of an Ag sample (2 pass) after stearic acid
decomposition has stopped.
reaction would occur between them (being on glass not Ag). When all the stearic acid on the island was used up, no more reaction would occur. On addition of more stearic acid, the process would begin again. This would seem to be in agreement with the SEM (Figure 6) taken after the reaction had finished, showing a patchy coating of stearic acid rather than a film.
As in the case of UV photoactivity, the presence of smaller nanoparticles will increase the surface area available and so increase any reaction between the stearic acid and the film.
As standard practice, the samples were exposed to UV light for 4 hours before the visible experiment as previous work had shown that this gave improved visible photoac-tivity of sol-gel produced, Ag-doped TiO2samples [32,33].
This is considered due to the UV partially reducing the TiO2
and favouring the electron transfer to Ag [34]. However, the above experiment with repeated layers of stearic acid showed that this was not necessary for just Ag films (opposed to TiO2-Ag). Exposing the sample to UV light should reduce
any Ag+ ions to Ag metal, as is common practice for the
formation of Ag/TiO2 from TiO2/AgNO3 for sol-gel films
[35].
It has previously been mentioned that under UV light any Ag+ would be reduced to Ag metal. However, under
visible light in the presence of O2this process can be reversed
with O2acting as an electron acceptor for the photoexcited
Ag. This was shown to be a reversible sequence (between UV/visible) by Ohko et al. [36]. Films of AgCl were found to be photocatalytic for the oxidation of water, but only in the presence of excess Ag+. This photoactivity expanding from
the UV to visible due to self-sensitisation [14]. The presence of the excess Ag+ was considered to be responsible for the
self-sensitisation with the band gap of AgCl being decreased due to these Ag ion 5s states. For our experiments, there is no initial high concentration of Ag+ions, as no other chemical
species than Ag metal were detectable by the limits of XRD or XPS.
Similar experiments were done using multilayers of TiO2
and Ag. As previously mentioned, if TiO2 was deposited
on top of Ag, anatase with a small amount of rutile was produced. Also, the layer was not continuous, so both Ag and TiO2were present on the top surface.
6 International Journal of Photoenergy
0 50 100 150 200 250
Time (min) 0.5
0.6 0.7 0.8 0.9 1
N
o
rm
aliz
ed
int
eg
ra
te
d
ar
ea
(cm
−
1)
Figure 7: Visible stearic acid tests for TiO2over Ag (2 passes). First stearic acid run , additional stearic acid and experiment repeated
, titania film .
experiment. The TiO2 film is also plotted, so the contrast
between no activity (TiO2) and activity (TiO2on Ag) can be
more clearly seen.
Growth Ag (2 passes) on top of TiO2again led to a surface
containing Ag and TiO2(anatase only). In this case, no sign
of activity was seen (Figure 8), with the multilayer giving the same lack of activity as seen in the comparison TiO2sample.
Both samples gave rates of 10−4cm−1min−1(3.12 ×10¹²
molecules cm−2min−1), which are similar to that obtained
by uncoated float glass. The complete lack of any activity due to the Ag is surprising given the previous results. Possibly there is an advantage having a mixture of rutile and anatase rather than just anatase as rutile absorbs a higher wavelength of light than anatase, which may in some way help the decomposition of stearic acid which occurs. Also, the presence of rutile may favour the TiO2 over Ag
sample, as it was previously shown by Sclafani et al. [34] that rutile, but not anatase improved the UV photoactivity of sol-gel mixed TiO2/Ag samples. However, this cannot be the
full explanation, as the films of just Ag show photoactivity. Alternatively, deposition of Ag on top of TiO2, rather than
directly on the barrier glass may alter either the amounts or dispersion of Ag being deposited and hence may reduce its effect on the stearic acid. If as earlier postulated the structure of the Ag is of importance and then by growth on a different effective substrate, this structure is changed, hence curtailing the photoactivity. However, the Ag crystallite size itself has not been altered whether grown on either material, so indicating the FACVD deposition process was controlling this property.
The mechanism by which Ag (under certain conditions) removes stearic acid is not clear at this stage. We can speculate on this, as to whether this is a photocatalytic process or a photoactive reduction/oxidation reaction. In this regard, some key points (noted in the above section) are as follows:
(i) under both UV and visible light, stearic acid can be decomposed;
0 50 100 150 200 250 300
Time (min) 0.7
0.75 0.8 0.85 0.9 0.95 1
N
o
rm
aliz
ed
int
eg
ra
te
d
ar
ea
(cm
−
1)
Figure 8: Visible activity of Ag on TiO2 compared to that of TiO2 .
(ii) such degradation only occurs for the thin films of Ag and TiO2 over Ag (which actually consists of TiO2
interspersed with Ag clusters);
(iii) the reaction tails offbefore completion;
(iv) the behaviour can be repeated on the same sample; (v) the (active) thin films consist of noncontinuous
island growth of small Ag clusters. Significantly, the two films where no reaction occurred were for the thick, continuous films of 100 passes FACVD, and the electroplate film. Both also have the largest crystallite sizes.
The decomposition of the stearic acid might initially sug-gest a photocatalytic process particularly as the behaviour seems to be repeatable on the same sample. However, the reaction tails off implying that the active species may be being depleted which would suggest a photoactive oxi-dation/reduction process. It is possible that under more extended testing, full depletion may be observable. However, such a simple silver depletion driven reaction is hard to rationalise with the observation that reaction does not occur (or is substantially slower) in two types of silver films. We could speculate that, in this instance, presence of the nanoparticulate films consisting of isolated clusters, and below a critical crystallite size, is of paramount importance for these UV and visible activated decompositions of stearic acid. Additional studies are planned to try to further elucidate the mechanism involved.
4. SUMMARY
By use of FACVD, with aqueous precursors, it has been shown possible to controllably deposit polycrystalline cubic Ag films. The thickness of the film and morphology can be controlled by the number of passes of the burner head over the substrate. The comparison TiO2 is stoichiometric
a thickness of 250 nm. This nanostructure could be varied by controlling the growth conditions. These films were compared with a continuous film of Ag produced by the electroplate method. All the silver films which consisted of the noncontinuous nanostructure demonstrated an initial visible activity to stearic acid, which was shown to be repeatable on the same sample, although they did not go to completion. No activity was shown by the continuous films of 100 passes or the electroplate samples for UV or visible, suggesting that the nanostructure is a significant factor in the photoactivity seen with stearic acid in the thinner films.
By use of multilayers of thin coatings of Ag under TiO2, it
is possible to combine the visible photoactivity of the Ag and complement its UV activity with the excellent photoactivity of TiO2. This has potential use in the commercial sector
due to the shown repeatable measurement, along with the improved durability of the product over that of just Ag.
ACKNOWLEDGMENTS
This work is partially financed by the EC through GRD1-2001-40791, PHOTOCOAT project. LB thanks Corus Plc for financial support.
REFERENCES
[1] X. Z. Li, F. B. Li, C. L. Yang, and W. K. Ge, “Photocatalytic activity of WOx-TiO2under visible light irradiation,” Journal
of Photochemistry and Photobiology A, vol. 141, no. 2-3, pp.
209–217, 2001.
[2] Q. Li, W. Liang, and J. K. Shang, “Enhanced visible-light absorption from PdO nanoparticles in nitrogen-doped tita-nium oxide thin films,” Applied Physics Letters, vol. 90, no. 6, Article ID 063109, 3 pages, 2007.
[3] S. Sakthivel and H. Kisch, “Daylight photocatalysis by carbon-modified titanium dioxide,” Angewandte Chemie International
Edition, vol. 42, no. 40, pp. 4908–4911, 2003.
[4] R. Asahi, T. Morikawa, T. Ohwaki, K. Aoki, and Y. Taga, “Visible-light photocatalysis in nitrogen-doped titanium oxides,” Science, vol. 293, no. 5528, pp. 269–271, 2001. [5] H. Yamashita, M. Harada, J. Misaka, et al., “Application of
ion beam techniques for preparation of metal ion-implanted TiO2 thin film photocatalyst available under visible light irradiation: metal ion-implantation and ionized cluster beam method,” Journal of Synchrotron Radiation, vol. 8, part 2, pp. 569–571, 2001.
[6] H. M. Yates, M. G. Nolan, D. W. Sheel, and M. E. Pemble, “The role of nitrogen doping on the development of visible light-induced photocatalytic activity in thin TiO2 films grown on glass by chemical vapour deposition,” Journal of
Photochem-istry and Photobiology A, vol. 179, no. 1-2, pp. 213–223, 2006.
[7] W. Choi, A. Termin, and M. R. Hoffmann, “The role of metal ion dopants in quantum-sized TiO2: correlation between photoreactivity and charge carrier recombination dynamics,”
Journal of Physical Chemistry, vol. 98, no. 51, pp. 13669–13679,
1994.
[8] J. Wang, S. Yin, M. Komatsu, Q. Zhang, F. Saito, and T. Sato, “Photo-oxidation properties of nitrogen doped SrTiO3made by mechanical activation,” Applied Catalysis B, vol. 52, no. 1, pp. 11–21, 2004.
[9] Y. Y. Mi, S. J. Wang, J. W. Chai, et al., “Effect of nitrogen doping on optical properties and electronic structures of
SrTiO3films,” Applied Physics Letters, vol. 89, no. 23, Article ID 231922, 3 pages, 2006.
[10] A. Dobosz and A. Sobczy ´nski, “The influence of silver additives on titania photoactivity in the photooxidation of phenol,” Water Research, vol. 37, no. 7, pp. 1489–1496, 2003. [11] J.-W. Yoon, T. Sasaki, and N. Koshizaki, “Dispersion of
nano-sized noble metals in TiO2 matrix and their photoelectrode properties,” Thin Solid Films, vol. 483, no. 1-2, pp. 276–282, 2005.
[12] T. H. James, The Theory of the Photographic Process, MacMil-lan, New York, NY, USA, 4th edition, 1977.
[13] W. H. Armistead and S. D. Stookey, “Photochromic silicate glasses sensitized by silver halides,” Science, vol. 144, no. 3615, pp. 150–154, 1964.
[14] G. Calzaferri, D. Br¨uhwiler, S. Glaus, D. Sch¨urch, A. Currao, and C. Leiggener, “Quantum-sized silver, silver chloride and silver sulfide clusters,” Journal of Imaging Science and
Technology, vol. 45, no. 4, pp. 331–339, 2001.
[15] M. C. Kanan, S. M. Kanan, and H. H. Patterson, “Lumines-cence properties of silver(I)-exchanged zeolite Y and its use as a catalyst to photodecompose carbaryl in the presence of natural organic matter,” Research on Chemical Intermediates, vol. 29, no. 7-9, pp. 691–704, 2003.
[16] M. Matsuoka, K. Iino, H. Chen, and M. Anpo, “Local structures of Ag (I) clusters prepared within zeolites by ion-exchange method and their photochemical properties,”
Research on Chemical Intermediates, vol. 31, no. 1–3, pp. 153–
165, 2005.
[17] M. Matsuoka, W.-S. Ju, H. Yamashita, and M. Anpo, “In situ characterization of the Ag+ion-exchanged zeolites and their photocatalytic activity for the decomposition of N2O into N2 and O2at 298 K,” Journal of Photochemistry and Photobiology
A, vol. 160, no. 1-2, pp. 43–46, 2003.
[18] L. J. Guo, Q. Xing, X. L. Liu, Y. B. Huang, and Y. J. Mo, “The structure and properties of self-assembly complex LB films of silver nanoparticles,” Spectroscopy and Spectral Analysis, vol. 25, no. 5, pp. 726–729, 2005.
[19] S. Chandra, J. N. Sharma, V. K. Mohabey, and R. C. Agrawal, “Superionic solid film. III. Preparation and electrical conduc-tivity of cation substituted silver iodide based superionic solid NH4Ag4I5,” Journal of Physics D, vol. 13, no. 3, pp. 495–502, 1980.
[20] Z. Liu, X. Wang, H. Wu, and C. Li, “Silver nanocom-posite layer-by-layer films based on assembled polyelec-trolyte/dendrimer,” Journal of Colloid and Interface Science, vol. 287, no. 2, pp. 604–611, 2005.
[21] Y. S. Jung, “Study on texture evolution and properties of silver thin films prepared by sputtering deposition,” Applied Surface
Science, vol. 221, no. 1–4, pp. 281–287, 2004.
[22] T. L. Alford, L. Chen, and K. S. Gadre, “Stability of silver films on underlying layers at elevated temperatures,” Thin Solid
Films, vol. 429, no. 1-2, pp. 248–254, 2003.
[23] M. Abourida, H. Guillon, C. Jimenez, et al., “Silver thin films deposited by injection MOCVD,” in Proceedings of the 203rd
Meeting of the Electrochemical Society, pp. 938–945, Paris,
France, August 2003.
[24] L. Gao, P. H¨arter, C. Linsmeiner, A. Wiltner, R. Emling, and D. S. Landsied, “Silver MOCVD for advanced silver metallization,” Microelectronic Engineering, vol. 82, no. 3-4, pp. 296–300, 2005.
[25] L. A. Brook, P. Evans, H. A. Foster, et al., “Highly bioactive silver and silver/titania composite films grown by chemical vapour deposition,” Journal of Photochemistry and
8 International Journal of Photoenergy
[26] Y. Paz, Z. Luo, L. Rabenberg, and A. Heller, “Photo-oxidative self-cleaning transparent titanium dioxide films on glass,”
Journal of Materials Research, vol. 10, no. 11, pp. 2842–2848,
1995.
[27] B. D. Cullity, Elements of XRD, Addison-Wesley, Reading, Mass, USA, 1978.
[28] D. W. Sheel, L. A. Brook, and H. M. Yates, “Controlled nanostructured silver coated surfaces by atmospheric pressure chemical vapour deposition,” Chemical Vapour Deposition, vol. 14, no. 1-2, pp. 14–24, 2008.
[29] W. Choi and J. Ryu, “Multi-aspects of photocatalytic activities of TiO2: substrate specificity and implication for the activity test standardization,” in Proceedings of the 2nd International
Conference on Semiconductor Photochemistry, Aberdeen, UK,
July 2007.
[30] A. Mills and S. Le Hunte, “An overview of semiconductor photocatalysis,” Journal of Photochemistry and Photobiology A, vol. 108, no. 1, pp. 1–35, 1997.
[31] S.-K. Lee, S. McIntyre, and A. Mills, “Visible illustration of the direct, lateral and remote photocatalytic destruction of soot by titania,” Journal of Photochemistry and Photobiology A, vol. 162, no. 1, pp. 203–206, 2004.
[32] E. Stathatos, T. Petrova, and P. Lianos, “Study of the effi-ciency of visible-light photocatalytic degradation of basic blue adsorbed on pure and doped mesoporous titania films,”
Langmuir, vol. 17, no. 16, pp. 5025–5030, 2001.
[33] J.-M. Herrmann, H. Tahiri, Y. Ait-Ichou, G. Lassaletta, A. R. Gonzalez-Elipe, and A. Fernandez, “Characterisation and photocatalytic activity in aq. medium of TiO2 and Ag-TiO2 coatings on quartz,” Applied Catalysis B, vol. 13, no. 3-4, pp. 219–228, 1997.
[34] A. Sclafani and J.-M. Herrmann, “Influence of metallic silver and of platinum-silver bimetallic deposits on the photocat-alytic activity of titania (anatase and rutile) in organic and aqueous media,” Journal of Photochemistry and Photobiology
A, vol. 113, no. 2, pp. 181–188, 1998.
[35] A. Sclafani, M.-N. Mozzanega, and J.-M. Herrmann, “Influ-ence of silver deposits on the photocatalytic activity of titania,”
Journal of Catalysis, vol. 168, no. 1, pp. 117–120, 1997.
[36] Y. Ohko, T. Tatsuma, T. Fujii, et al., “Multicolour pho-tochromism of TiO2films loaded with silver nanoparticles,”