Melt compounding with graphene to develop functional, high-performance elastomers
This article has been downloaded from IOPscience. Please scroll down to see the full text article. 2013 Nanotechnology 24 165601
(http://iopscience.iop.org/0957-4484/24/16/165601)
Download details: IP Address: 103.31.34.2
The article was downloaded on 22/04/2013 at 05:19
Please note that terms and conditions apply.
View the table of contents for this issue, or go to the journal homepage for more
Nanotechnology24(2013) 165601 (14pp) doi:10.1088/0957-4484/24/16/165601
Melt compounding with graphene to
develop functional, high-performance
elastomers
Sherif Araby
1,2, Izzuddin Zaman
1, Qingshi Meng
1,
Nobuyuki Kawashima
3, Andrew Michelmore
3, Hsu-Chiang Kuan
4,
Peter Majewski
1, Jun Ma
1,3,6and Liqun Zhang
5,71School of Engineering, University of South Australia, SA5095, Australia
2Department of Mechanical Engineering, Faculty of Engineering, Benha University, Egypt 3Mawson Institute, University of South Australia, SA5095, Australia
4Department of Energy Application Engineering, Far East University, Tainan County 744, Taiwan 5Key Laboratory for Nanomaterials, Ministry of Education; Beijing University of Chemical Technology,
Beijing 100029, People’s Republic of China
E-mail:[email protected]@mail.buct.edu.cn
Received 14 September 2012, in final form 4 March 2013 Published 27 March 2013
Online atstacks.iop.org/Nano/24/165601
Abstract
Rather than using graphene oxide, which is limited by a high defect concentration and cost due to oxidation and reduction, we adopted cost-effective, 3.56 nm thick graphene platelets (GnPs) of high structural integrity to melt compound with an
elastomer—ethylene–propylene–diene monomer rubber (EPDM)—using an industrial facility. An elastomer is an amorphous, chemically crosslinked polymer generally having rather low modulus and fracture strength but high fracture strain in comparison with other materials; and upon removal of loading, it is able to return to its original geometry, immediately and completely. It was found that most GnPs dispersed uniformly in the elastomer matrix, although some did form clusters. A percolation threshold of electrical conductivity at 18 vol% GnPs was observed and the elastomer thermal conductivity increased by 417% at 45 vol% GnPs. The modulus and tensile strength increased by 710% and 404% at 26.7 vol% GnPs, respectively. The modulus improvement agrees well with the Guth and Halpin-Tsai models. The reinforcing effect of GnPs was compared with silicate layers and carbon nanotube. Our simple fabrication would prolong the service life of elastomeric products used in dynamic loading, thus reducing thermosetting waste in the environment.
S Online supplementary data available fromstacks.iop.org/Nano/24/165601/mmedia (Some figures may appear in colour only in the online journal)
1. Introduction
Of all engineering materials, polymers have undergone the most rapid increase in industrial applications over the past
6 Address for correspondence: School of Engineering, University of South
Australia, Mawson Lakes, SA 5095, Australia.http://people.unisa.edu.au/jun. ma.
7 Address for correspondence: Beijing University of Chemical Technology,
Beijing 10029, People’s Republic of China.
four decades, owing to their high specific strength and low manufacturing cost. However, their limitations include lack of electrical and thermal conductivity for most polymers, poor strength for elastomers and brittleness for thermosets, which severely limit their applications. To overcome these disadvantages, polymer nanocomposites are produced by compounding nanoparticles into polymers to achieve significantly improved or new properties beyond those of traditional particle-filled composites. Nanocomposites are
et al
generally classified by the geometries of the nanoparticles— particulate (e.g. silica) [1], layered (silicate layers) [2], and fibrous geometries (nanotubes) [3]—of which layered polymer nanocomposites have shown the greatest mechanical and barrier properties, and attracted the most extensive research and development due to the fillers’ high specific surface area, functionality and cost-effective fabrication [4]. However, the challenge is to provide layered nanocomposites with more functionalities, such as electrical and thermal conductivity. Electrically conductive composites are crucial in aerospace applications such as lightening strike dissipation in aircrafts and electrical charge mitigations in space vehicles in charged space environments. Thermal conductivity plays a key role in dissipating heat build-up in elastomeric parts, such as tyres and vehicle track pads, which are used in dynamic loading environments. The improvement of thermal conductivity is able to significantly improve the service life of elastomers and thus reduces the impact of thermoset waste on the environment.
Elastomers are not only used in manufacturing tyres, conveyor belts and hoses, but for toughening brittle polymers [5, 6]. Since most neat elastomers are not mechanically strong, a number of nanoadditives have been explored, including the well-known carbon black, thermoplastics [7] and the recently explored clay [8–11] and starch [12, 13]. While carbon black remains the dominant filler for conductive polymer composites, carbon nanotubes have attracted extensive interest in recent years, because sufficient functionalities can be achieved at low percolation thresholds due to the high aspect ratio of nanotubes. However, it has not yet reached the situation where carbon nanotubes are suitable for use in functional polymer nanocomposites, because of expensive manufacturing costs and the high viscosity caused by the ‘bird’s nest’ structure of the entangled tubes. By contrast, graphene—a flat sheet of carbon just one atom thick—is a new class of promising filler for functional nanocomposites: its parent graphite is abundant in nature and thus cost effective as a raw material, and it is the stiffest and strongest material measured to date (Young’s modulus 1 TPa and intrinsic strength 130 GPa) while upon loading it can elongate by 25% of its original length. Graphene carries higher electrical/thermal conductivity and provides higher reinforcement [14] than multi-walled carbon nanotubes, isotropic electrical/thermal conductivities on the graphene plane, low viscosity when compounded with a polymer, and non-toxicity. A hypothesis made in this study was that, with appropriate (i) ratios of carbon to oxygen and (ii) dispersion and exfoliation, graphene should significantly improve the stiffness, strength and electrical/thermal conductivities of polymers.
When graphene is fabricated by micromechanical exfoliation of graphite, its yield is too low to produce polymer nanocomposites [15, 16]. Graphene oxide has been extensively studied, but its fabrication involves harsh oxidation and either chemical or thermal reduction [4, 17]. Although thermal reduction removed nearly all oxygen atoms, it just fixed a small fraction of defects, leading to orders of magnitude lower electrical conductivity and 75%
reduced stiffness [18]. Studies of nanocomposites based on graphite intercalation compounds (GICs) started in the 1990s, where commercial GICs at less than $10 kg−1 were treated with rapid heating or thermal shock to produce loosely stacked graphite platelets. Our recent research [19,20] has shown that this method in combination with sonication in solvent can produce graphene platelets (GnPs) of 2–4 nm in thickness, which contain only 7% atomic oxygen. Since previous research has shown that acidification and thermal expansion can increase the graphene thickness to∼1 nm [21], each of our GnPs may comprise 3–4 graphene layers. On increasing the number of graphene layers from one to three, the stiffness does not change and the fracture strength reduces 23% from 130 to 101 GPa [22]. Given that the fracture strength of most polymers ranges from 1 to 80 MP, these GnPs should suffice to toughen or reinforce polymers. More importantly, Raman spectroscopy demonstrated a lowID/IG
ratio for GnPs, implying a high structural integrity for the retention of exceptional performance from its sister graphene. It is worth mentioning that GnPs are different to graphite nanoplatelets in thickness; graphite nanoplatelets are much thicker (tens to a few hundreds in thickness) and thus approximate the properties of graphite. In a previous work, a percolation threshold of 0.612 vol% was made for epoxy/GnP nanocomposites, and such a low threshold cannot be achieved using graphite nanoplatelets. Therefore, GnPs represent a technological advance over graphite nanoplatelets.
Three methods for compounding nanoadditives with polymers include in situ polymerization, solution mixing and melt compounding; of these, melt compounding holds the most promise for industrial applications due to its environmental friendliness and compatibility with industrial practice. However, all previous work for fabrication of elastomer/graphene nanocomposites avoided this method due to the high graphene production cost and the difficulty in dispersing graphene in the matrix. Zhang et al first compounded an elastomer with microwave-expanded graphite by latex compounding; at∼10 wt%, thermal conductivity was enhanced from 0.19 to 0.30 W m−1K−1, the tensile strength
improved from 4 to 12 MPa, but fracture strain reduced [23]. When the same method was applied in mixing natural rubber and graphene oxide, no better thermal conductivity enhancement was reported [24]. Guo adopted solution mixing; at 10 wt% graphene oxide, the tensile strength of butyl rubber improved from 0.2 to 0.8 MPa [25]. Zhang solution-compounded graphene oxide with nitrile-butadiene rubber; at 0.44 vol% the tensile strength reached a maximum improvement of 50% [26].
In spite of these efforts, fundamental questions not yet addressed include (i) whether graphene has the potential to markedly improve the thermal conductivity of elastomers for the release of internal heat rise; and (ii) if graphene does the job, then will it be possible to use the current industrial facilities—two-roll mills and internal mixers—for fabrication of these advanced materials.
et al
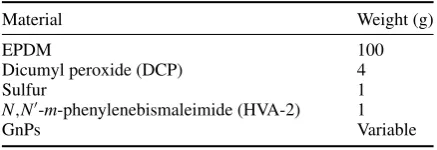
Table 1. Recipes of elastomer compounds.
Material Weight (g)
EPDM 100
Dicumyl peroxide (DCP) 4
Sulfur 1
N,N0
-m-phenylenebismaleimide (HVA-2) 1
GnPs Variable
elastomer nanocomposites, which include (i) using a two-roll mill, to mix GnPs with a popular elastomer in industry: ethylene–propylene–diene monomer rubber (EPDM), and (ii) investigating the structure–property relations of these nanocomposites. Our investigation shows that this method is indeed an industry-compatible approach to make highly dispersed inorganic/organic nanohybrids with good controls on the structure and properties.
2. Experimental section
2.1. Materials
Jilin Petrochemical Limited, China provided ethylene– propylene–diene monomer rubber (EPDM 4045, ethylene content 53%–59% with a Mooney viscosity of ML (1+4) at 100◦C=38–52). Curing chemicals were listed in table1. A commercial graphite intercalated compound (GIC, Asbury 3494) was kindly provided by Asbury Carbons, Asbury, NJ. Curing chemicals and GIC were used as received without further purification.
2.2. Preparations
Graphene platelets. One gram of GIC was weighed, transferred to a preheated crucible inside a furnace at 700◦C and treated for 1 min. The crucible was taken out and left in a fume cupboard to allow the expanded product to cool down. Afterwards, the product was immersed in acetone in a metal container with mechanical stirring for 10 min. Then the container was covered and treated in an ultrasonication bath (200 W, 42 kHz) for 1 h. During sonication, the expanded product was able to split into graphene platelets (GnPs) [27]. GnPs were separated from acetone by filtration, followed by a drying process using a ventilated oven and a vacuum oven; this produced the densified GnPs. The densification can reduce the nanoparticles’ inhalation hazard during melt compounding. A similar method was coincidently used by Hyunwooet al[28].
Melt mixing. GnPs were mixed with the elastomer using a two-roll mill, during which GnPs were gradually added to prevent loss. Following the addition of GnPs into the elastomer, the roll gap was increased and reduced a few times to uniformly disperse GnPs in the matrix. After the mixture cooled to room temperature, curing chemicals were added and mixed using a similar procedure, with a careful control over the temperature rise that may cause premature crosslinking. The elastomer and its nanocomposites were vulcanized at
150◦C under 3 MPa for 30 min. 3 MPa was chosen because it can produce similar mechanical properties to those obtained under high-pressure curing.
Since weight fractions were used in our experiments, we adopted equation (1) to convert to volume fractions.
Vf= ρm
Wf ρf(1−Wf)+ρmWf
(1)
where ρ and W are the density and weight fraction, respectively. Subscripts m and f refer to matrix and filler, respectively. Density values of the elastomer and GnPs were taken as 1.2 g cm−3and 2.26 g cm−3, respectively.
2.3. Nanocomposite characterizations
X-ray diffraction (XRD) was used to investigate the layered structure of GIC, GnPs and their nanocomposites. XRD measurements were operated at room temperature using a Mini-Materials Analyzer (MMA). The x-ray diffractometer was tuned to Cu Kαradiation at 35 kV and 12 kW. Spectra were collected under a reflection mode at 1◦min−1between
2θ=2–45◦.
AFM images of GnPs were taken with a NT-MDT SPM instrument using NSG03 non-contact ‘golden’ cantilevers. The samples were prepared by (i) suspending GnPs in acetone at 0.0004 wt% through 60 min sonication and (ii) dropping the solution on a silicon wafer, followed by drying.
Transmission electron microscopy (TEM, Philips CM200) was conducted to provide two-dimensional images for the 2.8 vol% nanocomposite. Sections of ∼60 nm in thickness were made at−120◦C and observed at 200 kV.
Scanning electron microscopy (SEM, Philips XL30 FEG-SEM) was conducted to examine the tear-fractured surface of the nanocomposites at 10 kV. The sample surface was coated with a thin layer of platinum.
Tensile properties were measured by Instron 5567 using a 2 kN load cell at 100 mm min−1. Two days after curing, dumbbell samples were die cut for tensile tests while non-nicked specimens were cut to measure the tear strength. Young’s moduli, measured as the slope in the initial straight portion of the stress–strain curve, were computed using software at a strain range 0.003%–1%. Non-nicked specimens were cut and tested at 100 mm min−1to obtain the maximum load that the specimens can withstand. All the reported values are the average of five testing results.
A dynamic mechanical analyser 2890 (TA Instrument, Inc., USA) was used to measure the storage modulus, loss modulus and mechanical loss factor of the elastomer and its nanocomposites using a tensile mode, at a frequency of 1 Hz, strain 1%, heat rate 5◦C min−1and temperature range−80 to 0◦C.
et al
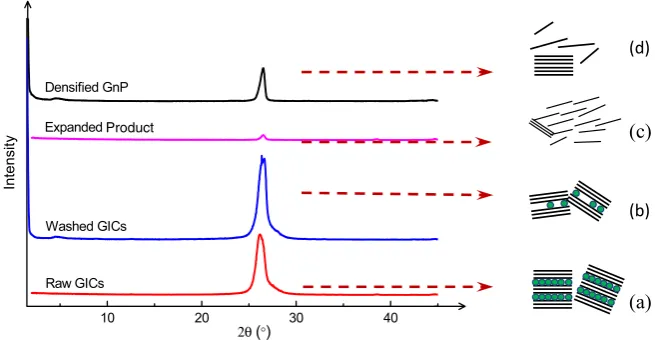
Figure 1. XRD patterns of a raw graphite intercalation compound (GIC), washed GIC, expanded product and densified graphene platelets (GnPs).
with ASTM C 518, ISO 8301 and JIS A 1412, with a sample size 51×6 mm and the temperatures of top and bottom moulds set as 50 and 30◦C, respectively.
A swelling test was performed through immersing the samples (dimension 20×20×2 mm) into toluene for three days. The samples were weighed to obtain W1, and then
immersed into toluene for three days; these sopped samples were wiped and weighed to obtainW2. All sample weights,
before and after swelling, have been corrected to exclude the GnPs in the samples. The swelling ratio is determined by equation (2):
ζ =W2−W1 W1 .
(2)
The crosslink density (ve) is calculated using the Flory–
Rehner equation [29]:
ve= −
ln(1−Vr)+Vr+χVr2
Vs(3
√
Vr−0.5Vr)
(3)
whereVs, the molar volume of solvent, is 106.3 cm3mol−1
for toluene, and χ, taken as 0.496, is the Flory/Huggins interaction parameter between toluene and the elastomer [30]. The rubber volume fraction was calculated according to the equation:
Vr=
W1
W1+η(W2−W1)
(4)
whereηis the ratio of elastomer to toluene density.
3. Results and discussion
3.1. Morphology
Graphene platelets
Figure1contains XRD patterns of a graphite intercalation compound (GIC), washed GIC, expanded product and densified graphene platelets (GnPs). GIC is formed by intercalating atomic or molecular layers of different chemical
species, such as alkali metals and bisulfate, between graphene layers. The number of graphene layers between the adjacent intercalated chemicals is known as a stage number, ranging from 1 to 5 [31, 32]. Washing GIC leads to an increase in the diffraction intensity (from diffraction (a) to (b) in figure 1) because all or part of these intercalated chemicals were removed by washing, leading to an increase in the stacking coherence; this is shown in the illustration next to figure 1. Figure 1(c) illustrates that, upon expansion, all stages may separate from each other or even be exfoliated, but the layered graphene structure should be retained in each stage, and this explains why only slight diffraction ((c) in figure 1) is seen after the thermal treatment. The diffraction pattern of the densified GnPs shows no shift in 2θ because the stages were expanded and even disorderly exfoliated in the fabrication while the layered structure in each stage remained. This conclusion is in agreement with two studies [33, 34]. The diffraction intensity and width (figure1(d)) increases obviously after the densification because GnPs stacked themselves through the densification process. Later we will show that these stacked GnPs are able to separate themselves in the polymer matrix by melt compounding.
Atomic force microscopy (AFM) was adopted to measure the thickness of 20 randomly selected platelets, and one representative measurement is shown in figure 2. The thickness was measured as 3.55 ± 0.32 nm, in line with our recent work [19]. Since thermal expansion was reported to produce an ∼1 nm thick graphene layer [35], each GnP produced in our study may contain 3–4 graphene layers.
et al
[image:6.595.86.509.242.390.2]Figure 2. AFM measurement of the thickness of graphene platelets dispersed in acetone.
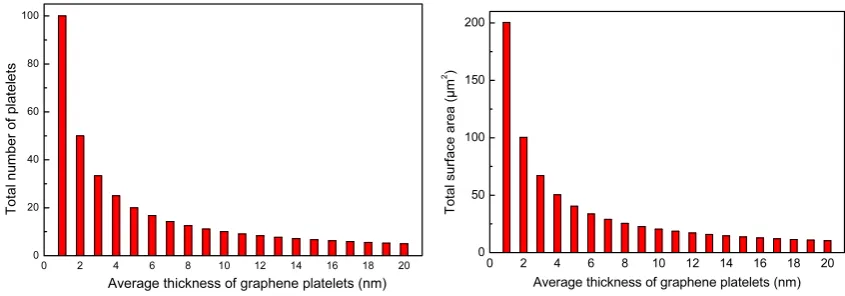
Figure 3. Number of graphene platelets (left) and their total surface area (right) in a given volume of matrix.
The total number of GnPs (N) in a volume of a composite is:
N = V
v (5)
v =l∗w∗t (6)
whereVandvare the nanocomposite and graphene volumes, respectively, while l,w, and t are the length, width, and thickness of graphene, respectively.
Assuming that the volume percentage of graphene in the nanocomposite isϕ%, thus equation (5) can be updated as:
N= ϕ∗V
100∗l∗w∗t. (7)
The total surface area of graphene (S) inside the nanocomposite can be computed by equation (8);
S=(2∗l∗t+2∗l∗w+2∗w∗t)∗N. (8)
Assuming that: (i) the volume of the nanocomposite is 10µm3, (ii) GnPs are at a percentage of 1 vol%, (iii) each platelet is to be treated as a rectangular cuboid whose lateral dimension (length and depth) is 1×1µm, the total number of graphene equals:
N= 10∗10
9(nm3)∗1
100∗1∗1000(nm)∗1∗1000(nm)∗t(nm). (9)
The total surface area of GnPs is obtained by
S−(2∗1∗1000∗1∗1000+4∗1000∗t)∗N. (10)
In figure3, both the GnP number and their total surface area reduce dramatically when the thickness increases from 1 to 5 nm, demonstrating the necessity to keep the thickness as low as possible.
Elastomeric nanocomposites
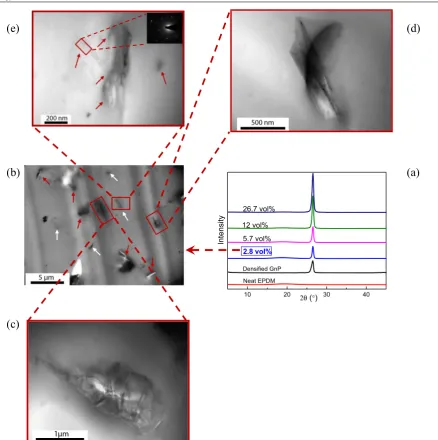
Figure 4(a) contains XRD patterns of elastomer/GnP nanocomposites. While no obvious diffraction is seen for the elastomer due to its amorphous structure, all nanocomposites show diffraction at 2θ = 26.5◦ assigned to the layered structure of graphite, indicating the retention of the layered structure in each platelet. Specifically, there are two levels of layered structure for GnPs in the matrix: one relates to the layer spacing of graphene in each GnP and the other describes the spacing between GnPs. While the layer spacing between GnPs may change during melt compounding (figure S1 available at stacks.iop.org/Nano/24/165601/mmedia), the spacing in each GnP should be retained through all these processes. The increased diffraction intensity in figure 4(a) implies that more GnPs appear in a given volume of matrix.
et al
Figure 4. Structural characterization of nanocomposites: (a) vertically shifted XRD patterns of the elastomer, densified GnPs and their nanocomposites and (b)–(f) TEM images of elastomer/GnPs nanocomposites (2.8 vol%).
microns in lateral size (red arrows). A void at the bottom of and a whitening zone on the top of figure 4(b) are caused by cryo-microtoming. When a typical cluster is magnified in figure 4(c), a number of corrugations are observed, attributed to the melt compounding. Since these wrinkles and corrugations were not found in our previous epoxy/graphene nanocomposites fabricated by in situ polymerization [27], they must be caused by the high shearing force applied to GnPs by the melt mixing facility—a two-roll mill. This means that the mill is able to cause corrugations to GnPs although graphene is the stiffest and strongest material ever measured. Two representative GnPs are magnified in figures 4(d) and (e). In figure 4(d), a GnP folds with no visible wrinkles and corrugations. As shown in the inset of figure 4(e), a crystalline diffraction is found in a representative zone in the figure. In comparison with a previous diffraction pattern of graphene [36], the total number of graphene layers in this GnP
should be less than five. This means that some GnPs are able to disperse and exfoliate in the elastomer by melt compounding while some form clusters.
3.2. Functional properties
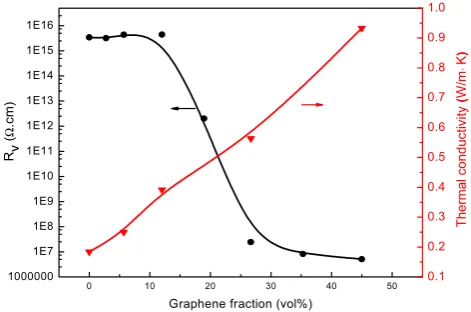
Figure 5 shows the electrical and thermal conductivities of the elastomer and its nanocomposites, and table S2 (available at stacks.iop.org/Nano/24/165601/mmedia) contains all the values plotted. The electrical volume resistivity (Rv) of the
et al
[image:8.595.46.293.293.385.2]Figure 5. Electrical volume resistivity and thermal conductivity of the elastomer and its nanocomposites.
Table 2. Electrical volume resistivity at different preparation stages for the nanocomposites at 26.7 vol%.
Sample
no. Fabrication Rv(cm)
1 Elastomer mixed with 26.7 vol% GnPs and curing chemicals
3.24×10¹³
2 Similar to sample 1, but exposed to 3 MPa without heating
2.59×10¹⁴
3 Similar to sample 2, but with heating for vulcanization
2.44×10⁷
σc∝(ϕ−ϕt)t, whereσcis the composite conductivity,ϕt is
the percolation threshold expressed as a volume fraction, and
tis the universal critical exponent. The fitting results (see SI) reveal that (i) the percolation threshold is atϕt=19 vol%, and
(ii)t=1.3, with a regression coefficientR2=98%.
Since the nanocomposites were prepared by a two-step process including (i) mixing the elastomer with GnPs and other additives and (ii) crosslinking, we were curious to identify which step plays a critical role in creating the conducting network. Hence, a number of samples were designed, fabricated and analysed as below. Sample 1 was made by melt mixing the elastomer with 26.7 vol% GnPs and other additives; Sample 2 was produced by applying a pressure of 3 MPa to a similar sample to Sample 1 for 30 min at room temperature; and Sample 3 was created by applying 3 MPa to a similar sample to Sample 1 for 30 min at 150◦C for curing. All these samples were tested forRv. In table2,
only the cured sample shows a much reduced Rv, implying
that vulcanization is critical to create a filler–filler interaction network by promoting the dispersion and exfoliation of GnPs. XRD was employed to further identify the structure of these nanocomposites in figure S3 (available at stacks.iop.org/ Nano/24/165601/mmedia). The cured sample demonstrates a far lower intensity of diffraction, and this curing effect on the nanocomposite structure is shown in the schematics next to the XRD in figure S3 (available at stacks.iop.org/Nano/24/ 165601/mmedia).
Since graphene is known for its higher thermal conductivity than copper, we were intrigued to investigate the thermal conductivity of these materials. Although
previous work focused merely on the thermal conductivity of thermoplastics or thermosetting resins [38–41], thermally conductive elastomers are of more significance for products used in dynamic loading environments, such as tyres and conveyor belts [42]. Elastomers are inherently insulating, producing tremendous heat build-up in dynamic loading environments—the internal built-up temperature can be as high at 150◦C causing macromolecular chain scission. Thermal degradation caused by heat build-up is the major ageing mechanism for these elastomers [42].
In figure 5, 45 vol% GnPs enhance the thermal conductivity of the elastomer by 407%. To the best of our knowledge, this is the maximum improvement in thermal conductivity for elastomer-based nanocomposites fabricated by melt compounding. Yanhu et al [24] reported a slight increase (12% at 2 wt% graphene) in the thermal conductivity of natural rubber/graphene nanocomposites prepared via solution compounding. Our finding indicates the great potential to improve the thermal energy dissipation of elastomers, which in turn prolongs the service life of elastomeric products.
Since thermal energy is transferred through phonons (lattice vibrations), better coupling in the vibration modes at the GnP–elastomer and GnP–GnP interfaces provides a lower thermal resistance [43–45]. In this study, the GnP–GnP distance reduces with increasing GnP fraction, leading to an improvement in both electrical and thermal conductivity. The elastomeric nature of these materials and the much smaller contrast of thermal conductivity between the elastomer and graphene (compared to electrical conductivity) may be the two reasons why a higher filler loading is required to attain a significant improvement in thermal conductivity.
3.3. Mechanical and thermal dynamic properties
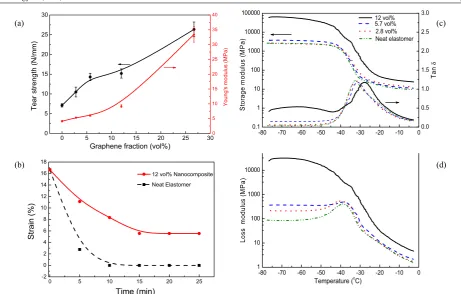
Figure6(a) contains stress–strain graphs of the elastomer and its nanocomposites. Tensile strength increases markedly with increasing GnP content, implying a significant reinforcement; strain at fracture increases with GnP content until 12 vol%, followed by a reduction. These changes are explained below.
Without loading, a cured neat elastomer is composed of crosslinked molecular chains which are highly twisted, kinked and coiled. Upon loading, these chains partially uncoil, untwist and straighten, resulting in elongation in the loading direction (figure 6(b)). Rupture of chains occurs when the loading exceeds a critical value, and this leads to strain at fracture.
et al
Figure 6. (a) Stress–strain relations of the elastomer and its nanocomposites, (b)–(d) schematics of tensile deformation of: (b) neat elastomer; (c) a nanocomposite at a low GnP fraction and (d) a nanocomposite at a high GnP fraction.
With increases in GnP content, the tensile strength is enhanced since GnPs stiffen and strengthen elastomers. The 26.7 vol% nanocomposite shows reduced strain at fracture, caused by the confining effect of GnPs on chain deformation (figure 6(d)). At 26.7 vol%, GnPs start contacting each other, as explained in section 3.2, and this limits the chain deformation under loading, causing the reduction of fracture strain (figure6(d)).
Young’s modulus and tear strength are shown in figure 7(a). Steady improvements of both properties are obvious; at 26.7 vol% GnPs, the modulus and tensile strength of the elastomer improve by 710% and 404%, respectively, implying a good dispersion of GnPs. The good dispersion would provide greater interface between GnPs and the matrix so that GnPs are able to share a higher fraction of load upon deformation.
Of various viscoelastic polymers, elastomers show far higher elasticity than their peer thermoplastics, but this high elasticity may be reduced by the addition of reinforcement nanoadditives. We measured how quickly and completely the deformed elastomer and its 12 vol% nanocomposite recovered after loading. These samples were tested for fracture strength first. Once 70% of the fracture loading was applied to the samples, the loading was removed and
their elongation was measured as a function of time. In figure7(b), the elastomer recovers its original geometry after 10 min of testing, while the recovery of the nanocomposite takes more time and is not 100% complete. GnPs in the matrix present a physical barrier to the molecular deformation of the elastomer under loading, causing more chains to rupture, and thus the loaded nanocomposite cannot recover completely. By contrast, the chains of the elastomer under the loading partially uncoil, untwist and straighten, and all these deformations are completely recoverable.
et al
Figure 7. Mechanical properties of the elastomer and its nanocomposites: (a) tear strength and Young’ modulus, (b) strain recovery of the elastomer and its 12 vol% nanocomposites, and (c), (d) storage modulus, tanδ, and loss modulus as a function of temperature.
molecular deformation in the vicinity of the interface, leading to a high level of energy absorption in the crack propagation pathway [5,6,46,47]. An exceptional interface region from inorganic to organic can be as long as a few centimetres [47], but its thickness is often difficult to measure in polymer nanocomposites. This highly improved tear strength implies an effective interface transferring load, demonstrating good compatibility between GnPs and elastomer molecular chains. Figures7(c) and (d) present the temperature dependence of storage modulus, loss modulus and loss factor tanδ for the elastomer and its nanocomposites, with detailed values summarized in tables S5 (available atstacks.iop.org/Nano/24/ 165601/mmedia). At−40 to−25◦C, the storage modulus of the elastomer drops abruptly. The storage modulus across all temperature ranges increases with increasing GnP fraction. For instance, the storage modulus improves by 2536% and 159% at 12 vol% GnPs in the glass and rubbery regions, respectively. The modulus increase is attributed to (i) the resilient nature of graphene, as it features a modulus of 1 TPa, fracture strength 100 GPa and fracture strain 25%, and under loading GnPs transfer stress by sharing fractions of load and restrain the movement of matrix molecules in their vicinity; and (ii) the presence of GnPs in the matrix which act as more physical crosslinks. Although no chemical modification was made on GnPs, an exponential increase in dynamic modulus at high fraction is obtained, confirming the good compatibility and the strong adhesion between GnPs and the elastomer in comparison with clay filler.
The glass transition temperature(Tg), which is measured
at the maximum tanδ value, increases with GnP contents.
In table S5 (available at stacks.iop.org/Nano/24/165601/ mmedia), the 5.7 vol% GnPs increase Tg by 2.2%, which
confirms the quite good interfacial interaction between GnPs and the matrix, resulting in a decrease in the mobility of elastomer chains over/between GnPs surfaces during dynamic mechanical loading, in agreement with our previous work on polymer nanocomposites [13,27,48,49].
DMA damping graphs—loss modulus versus temperature —demonstrate that the crosslinked macromolecular motion in the matrix is able to absorb and dissipate fracture energy at different temperatures. In general, the larger the area under the graph, the less susceptible the material is to tearing [51]. In figure 7(d), a transition zone is seen at around−27◦C, and the increase in loss modulus is far higher below the transition temperature. This points towards a high damping property of the nanocomposites, in particular at low temperatures, implying a significantly improved resistance to tearing contributed by GnPs.
3.4. Crosslink density
et al
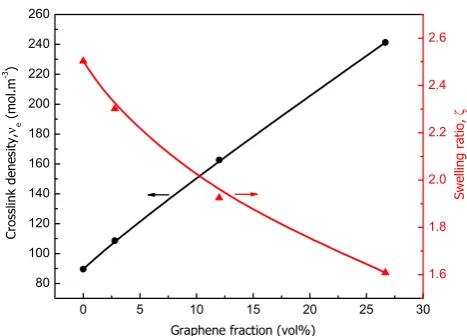
Figure 8. Swelling ratio and crosslink density of the elastomer and its nanocomposites.
the samples. Generally, with increasing GnP fractions, the crosslink density increases significantly while the swelling ratio reduces obviously, e.g. a 170% increase in crosslink density and a 36% reduction in swelling ratio at 26.7 vol% GnPs. This is caused by the presence of GnPs in the matrix. Through melt compounding, elastomer macromolecules entangled with GnPs and may migrate into the GnP spacing, promoting the exfoliation and dispersion of GnPs. As the ratio of curing chemicals to elastomer was kept identical in the fabrication process, these GnPs must provide physical crosslink points as shown in figure 6, contributing to the highly improved crosslink density. The presence of GnPs creates a tortuous path, reducing the diffusion of solvent molecules, which contributes to the remarkably reduced swelling ratio.
3.5. Fracture analysis
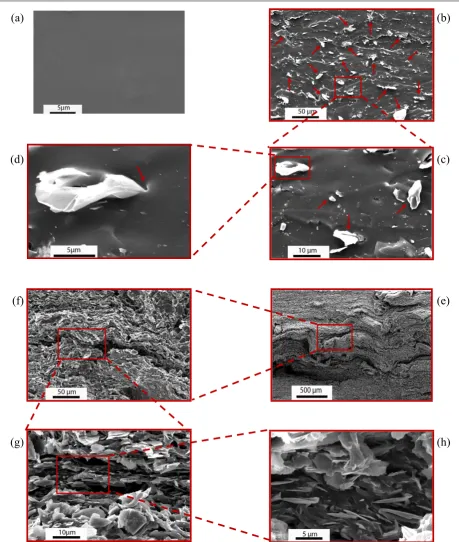
Scanning electron microscopy (SEM) was adopted to investigate whether GnPs are uniformly dispersed in the elastomer and identify the filler–matrix interface strength. Figure 9 presents typical SEM micrographs of the tear-fractured surfaces of the elastomer and its nanocomposites. In figure 9(a), the elastomer fracture surface is smooth and shows no signs of matrix deformation. In contrast, the fracture surfaces of all nanocomposites are obviously rough, implying that GnPs play an important role in reinforcing the elastomer. In figure9(b), GnPs are uniformly dispersed in the matrix and a number of ridges (as indicated by red arrows) are visible. When a typical zone is magnified in figure 9(c), three white particles are found to coexist with many tiny particles that should be either GnPs or their clusters; these two types of dispersion phase correspond to our TEM analysis (figures 4(b)–(e)). Figure 9(d) shows details of one white particle, where layers are clearly visible; this particle must be a giant GnP cluster consisting of a few GnPs joined by elastomer chains; matrix deformation as shown by the red arrow indicates a quite good interface between cluster and matrix, albeit no interface modification was made in this study. Under loading, the interface effectively transfers a
fraction of load from the matrix to the GnPs and their clusters; when deformation occurs, it restrains the movement of matrix molecules in the vicinity of these dispersion phases.
At 26.7 vol% GnPs, a wavy structure is predominant across the tear-fractured surface in figure 9(e). A typical zone magnified in figure 9(f) shows more detail—this wavy structure might consist of GnPs, most of which are aligned under the curing pressure. Examination of figures 9(g) and (h) reveals two phenomena: no layer breakage occurs and no matrix is visible; this means elastomer molecules (i) intercalating into the spacing between GnPs and (ii) combining with GnPs. This explains the formation of wave-like deformation under loading.
3.6. Modelling the mechanical properties
Comparing experimental data with theoretical models contributes to the design of composites. A composite stiffness is influenced by different factors, such as the stiffness of its constitutive phases, volume fraction of filler, morphology and the interface [50–52]. In this work, Young’s moduli were compared with theoretical predictions. To interpret the variation of stiffness, the measured Young’s moduli were fitted into two models: the Guth model [53] and the Halpin–Tsai model [54], since both provide good predictions at small strain values [55]. The Guth model predicts the stiffness of composites filled with spherical particles, expressed as
E=Eo(1+2.5V+14.1V2) (11)
where E andEo are the Young’s moduli of composite and
matrix, respectively, andV is the filler volume fraction. This model was updated by Guth for nonspherical fillers by adding a shape factor or an aspect ratiof:
E=Eo(1+0.67fV+1.62f2V2). (12)
The linear term accounts for the reinforcing effect of individual fillers and the high order term is for the contribution from filler–filler interactions [56]. The Halpin–Tsai model was used to predict the stiffness of the aligned filler composite as a function of aspect ratios and volume fractions. The predicted Young’s modulus in the longitudinal direction parallel to the aligned fillers is calculated by:
E=Eo(1+2fβV)
1−βV (13)
whereβis given by
β = (Ef/Eo)−1
(Ef/Eo)+2f
(14)
whereEfis the filler stiffness. In the case of nanocomposites
where there is a huge contrast of Young’s modulus between the filler and matrix, such as this study (E=1 MPa for the elastomer while E =1 TPa for graphene), the Halpin–Tsai model can be reduced to
E=Eo
1+2fV
et al
Figure 9. SEM images of the elastomer (a), and its 2.8 vol% (b)–(d) and 26.7 vol% (e)–(h) nanocomposites.
In figure 10, the experimental results are in good agreement with all predicted values using both models, in particular at low fractions. The best fitting was found atf =8, very close to those reported in [55,56]. The aspect ratiof may be a lot lower than that of GnPs, owing to (i) restacking of GnPs during the nanocomposite fabrication, such as formation of the clusters shown in figures4and9, and (ii) reduction in the GnP lateral dimension caused by the high shearing force during melt compounding (figure4(d)).
3.7. Comparison of graphene platelets with silicate layer and carbon nanotubes
et al
Figure 10. Comparison of experimental results with predictions by the Guth and Halpin–Tsai models for the elastomer and its nanocomposites.
our testing is quite low (tables S4 available atstacks.iop.org/ Nano/24/165601/mmedia), confirming the uniform dispersion of GnPs in the matrix. This means that GnPs possess much better compatibility with elastomers and produce a far higher reinforcement than clay.
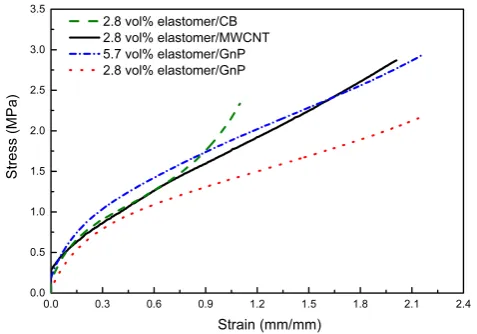
In spite of the high manufacturing cost, multi-walled car-bon nanotubes (MWCNTs) have attracted extensive interest over the past 20 years in the development of functional, high mechanical performance polymer composites. In contrast, GnPs are far cheaper and may possess higher functionality due to their high structural integrity [19,20]. Since carbon black (CB) is a dominant additive in the elastomer industry, we compared the reinforcing effects of GnPs with MWCNTs and CB. In figure11, the MWCNT nanocomposite is stiffer and stronger than the 2.8 vol% GnP nanocomposite, but its performance is equivalent to the 5.7 vol% GnP nanocom-posite. Taking into account the cost advantage of GnPs (∼$20 kg−1) in comparison with MWCNTs (∼$265 kg−1), GnPs represent a technological advance over MWCNTs for the development of functional polymer composites of high mechanical performance. At 2.8 vol%, the GnP nanocomposite indicates a slightly lower fracture strength but a far higher fracture strain than the CB nanocomposite. CB has been researched and developed for 80 years; in contrast, GnPs are less than one year old. Although this study simply compounded GnPs with the elastomers without any interface modification, satisfactory mechanical performances and electrical/thermal conductivities are obtained. We believe that greater property improvement would be achieved in the future by surface modification of GnPs, which would outperform CB in terms of tensile strength.
Conclusion
We created graphene platelets (GnPs) of 3.55 ± 0.32 nm in thickness using thermal shock followed by ultrasoni-cation, developed elastomer/GnP nanocomposites by melt compounding with an elastomer, ethylene–propylene–diene
Figure 11. Reinforcing effects of graphene platelets, carbon black and multi-walled carbon nanotubes on the elastomer.
rubber (EPDM), and investigated the structure–property relations of these nanocomposites.
The incorporation of 26.7 vol% GnPs into the elastomer dramatically improved the tensile strength, Young’s modulus, and tear strength by 404%, 710% and 270%, respectively. The dynamic mechanical analysis of the nanocomposites showed a 5◦C improvement in glass transition temperature. More importantly, our study showed that this melt compounding technique can produce electrically and thermally conductive elastomeric nanocomposites. The percolation threshold of electrical conductivity is at 18 vol%. At 45 vol% GnPs, the thermal conductivity of the elastomer increased by 407%. The swelling ratio of the elastomer was reduced by 62% at 26.7 vol% GnPs. The experimental values of stiffness agree well with the Guth and Halpin–Tsai models. Our study provides a novel route to the development of electrically and thermally conductive, mechanically strong elastomers, which will prolong the service life of elastomeric products used in dynamic loading environments.
Acknowledgments
The authors thank B Wade, L Waterhouse and J Terlet for technical support at Adelaide Microscopy. JM thanks Asbury for providing the graphite intercalation compound.
References
[1] Adam M B, Pingyan L, Steven C and Steven L G 2011 Gas-phase production of gold-decorated silica nanoparticles
Nanotechnology22315603
[2] Shao-jian H, Yi-qing W, Yi-ping F, Qing-sheng L and Li-qun Z 2010 The preparation of an elastomer/silicate layer nanocompound with an exfoliated structure and a strong ionic interfacial interaction by utilizing an elastomer latex containing pyridine groupsNanotechnology
21115601
[image:13.595.52.290.68.234.2]et al
[4] Peng X, James L, Roger D B and Balaji P 2012 Load transfer and mechanical properties of chemically reduced graphene reinforcements in polymer compositesNanotechnology
23505713
[5] Le Q-H, Kuan H-C, Dai J-B, Zaman I, Luong L and Ma J 2010 Structure–property relations of 55 nm particle-toughened epoxyPolymer514867
[6] Ma J, Mo M-S, Du X-S, Dai S-R and Luck I 2008 Study of epoxy toughened byin situformed rubber nanoparticles
J. Appl. Polym. Sci.110304
[7] Ma J, Feng Y X, Xu J, Xiong M L, Zhu Y J and Zhang L Q 2002 Effects of compatibilizing agent andin situfibril on the morphology, interface and mechanical properties of EPDM/nylon copolymer blendsPolymer43937 [8] Ma J, Xu J, Ren J-H, Yu Z-Z and Mai Y-W 2003 A new
approach to polymer/montmorillonite nanocomposites
Polymer444619
[9] Ma J, Xiang P, Mai Y-W and Zhang L-Q 2004 A novel approach to high performance elastomer by using clay
Macromol. Rapid Commun.251692
[10] Ma J, Yu Z-Z, Kuan H-C, Dasari A and Mai Y-W 2005 A new strategy to exfoliate silicone rubber/clay nanocomposites
Macromol. Rapid Commun.26830
[11] Liang Y-R, Ma J, Lu Y-L, Wu Y-P, Zhang L-Q and
Mai Y-W 2005 Effects of heat and pressure on intercalation structures of isobutylene–isoprene rubber/clay
nanocomposites. I. Prepared by melt blendingJ. Polym. Sci.
B432653
[12] Qi Q, Wu Y, Tian M, Liang G, Zhang L and Ma J 2006 Modification of starch for high performance elastomer
Polymer473896
[13] Tang H, Qi Q, Wu Y, Liang G, Zhang L and Ma J 2006 Reinforcement of elastomer by starchMacromol. Mater. Eng.291629
[14] Podsiadlo P, Kaushik A K, Arruda E M, Waas A M, Shim B S, Xu J, Nandivada H, Pumplin B G, Lahann J,
Ramamoorthy A and Kotov N A 2007 Ultrastrong and stiff layered polymer nanocompositesScience31880
[15] Eizenberg M and Blakely J M 1979 Carbon monolayer phase condensation on Ni(111)Surf. Sci.82228
[16] Xuekun L, Minfeng Y, Hui H and Rodney S R 1999 Tailoring graphite with the goal of achieving single sheets
Nanotechnology10269
[17] Zhang Y, Hu W, Li B, Peng C, Fan C and Huang Q 2011 Synthesis of polymer-protected graphene by
solvent-assisted thermal reduction processNanotechnology
22345601
[18] Zhu Y, Murali S, Cai W, Li X, Suk J W, Potts J R and Ruoff R S 2010 Graphene and graphene oxide: synthesis, properties, and applicationsAdv. Mater.223906
[19] Zaman I, Kuan H-C, Meng Q, Michelmore A, Kawashima N, Pitt T, Zhang L, Gouda S, Luong L and Ma J 2012 A facile approach to chemically modified graphene and its polymer nanocompositesAdv. Funct. Mater.222735
[20] Zaman I, Kuan H-C, Dai J, Kawashima N, Michelmore A, Sovi A, Dong S, Luong L and Ma J 2012 From carbon nanotubes and silicate layers to graphene platelets for polymer nanocompositesNanoscale44578
[21] Nemes-Incze P, Osv´ath Z, Kamar´as K and Bir´o L P 2008 Anomalies in thickness measurements of graphene and few layer graphite crystals by tapping mode atomic force microscopyCarbon461435
[22] Lee C, Wei X, Li Q, Carpick R, Kysar J W and Hone J 2009 Elastic and frictional properties of graphenePhys. Status Solidib2462562
[23] Yang J, Tian M, Jia Q-X, Shi J-H, Zhang L-Q, Lim S-H, Yu Z-Z and Mai Y-W 2007 Improved mechanical and functional properties of elastomer/graphite nanocomposites prepared by latex compoundingActa Mater.556372
[24] Zhan Y, Wu J, Xia H, Yan N, Fei G and Yuan G 2011 Dispersion and exfoliation of graphene in rubber by an ultrasonically-assisted latex mixing andin situreduction processMacromol. Mater. Eng.296590
[25] Lian H, Li S, Liu K, Xu L, Wang K and Guo W 2011 Study on modified graphene/butyl rubber nanocomposites. I. Preparation and characterizationPolym. Eng. Sci.512254 [26] Bai X, Wan C, Zhang Y and Zhai Y 2011 Reinforcement of
hydrogenated carboxylated nitrile–butadiene rubber with exfoliated graphene oxideCarbon491608
[27] Zaman I, Phan T T, Kuan H-C, Meng Q, Bao La L T, Luong L, Youssf O and Ma J 2011 Epoxy/graphene platelets nanocomposites with two levels of interface strengthPolymer521603
[28] Kim H, Kobayashi S, AbdurRahim M A, Zhang M J, Khusainova A, Hillmyer M A, Abdala A A and Macosko C W 2011 Graphene/polyethylene
nanocomposites: effect of polyethylene functionalization and blending methodsPolymer521837
[29] Flory P J and Rehner J J 1943 Statistical mechanics of cross-linked polymer networks. II. SwellingJ. Chem. Phys.
11521
[30] Macsiniuc A, Rochette A and Rodrigue D 2010 Understanding the regeneration of EPDM rubber crumbs from used tyres
Prog. Rubber Plast. Recycl. Technol.2651
[31] Shih C-J, Vijayaraghavan A, Krishnan R, Sharma R, Han J-H, Ham M-H, Jin Z, Lin S, Paulus G L C, Reuel N F, Wang Q H, Blankschtein D and Strano M S 2011 Bi- and trilayer graphene solutionsNature Nanotechnol.6439 [32] Weller T E, Ellerby M, Saxena S S, Smith R P and
Skipper N T 2005 Superconductivity in the intercalated graphite compounds C6Yb and C6CaNature Phys.139 [33] Kun P, W´eber F and Bal´azsi C 2011 Preparation and
examination of multilayer graphene nanosheets by exfoliation of graphite in high efficient attritor millCent. Eur. J. Chem.947
[34] Malesevic A, Vitchev R, Schouteden K, Volodin A, Zhang L, Tendeloo G V, Vanhulsel A and Haesendonck C V 2008 Synthesis of few-layer graphene via microwave plasma-enhanced chemical vapour deposition
Nanotechnology19305604
[35] Meyer J C, Geim A K, Katsnelson M I, Novoselov K S, Booth T J and Roth S 2007 The structure of suspended graphene sheetsNature44660
[36] Park S and Ruoff R S 2009 Chemical methods for the production of graphenesNature Nanotechnol.4217 [37] Stankovich S, Dikin D A, Dommett G H B, Kohlhaas K M,
Zimney E J, Stach E A, Piner R D, Nguyen S T and Ruoff R S 2006 Graphene-based composite materials
Nature442282
[38] Veca L M, Meziani M J, Wang W, Wang X, Lu F, Zhang P, Lin Y, Fee R, Connell J W and Sun Y-P 2009 Carbon nanosheets for polymeric nanocomposites with high thermal conductivityAdv. Mater.212088
[39] Ganguli S, Roy A K and Anderson D P 2008 Improved thermal conductivity for chemically functionalized exfoliated graphite/epoxy compositesCarbon46806 [40] Yang S-Y, Lin W-N, Huang Y-L, Tien H-W, Wang J-Y,
Ma C-C M, Li S-M and Wang Y-S 2011 Synergetic effects of graphene platelets and carbon nanotubes on the mechanical and thermal properties of epoxy composites
Carbon49793
[41] Baniassadi M, Addiego F, Laachachi A, Ahzi S,
Garmestani H, Hassouna F, Makradi A, Toniazzo V and Ruch D 2011 Using SAXS approach to estimate thermal conductivity of polystyrene/zirconia nanocomposite by exploiting strong contrast techniqueActa Mater.592742 [42] Meyer L, Jayaram S and Cherney EA 2004 Thermal
et al
erosion resistance in the inclined plane testIEEE Trans. Dielectr. Electr. Insul.11620
[43] Kim H, Abdala A A and Macosko C W 2010
Graphene/polymer nanocompositesMacromolecules
436515
[44] Potts J R, Dreyer D R, Bielawski C W and Ruoff R S 2011 Graphene-based polymer nanocompositesPolymer525 [45] Balandin A A 2011 Thermal properties of graphene and
nanostructured carbon materialsNature Mater.10569 [46] Kuan H-C, Dai J-B and Ma J 2010 A reactive polymer for
toughening epoxy resinJ. Appl. Polym. Sci.1153265 [47] Ma J, Qi Q, Bayley J, Du X-S, Mo M-S and Zhang L-Q 2007
Development of SENB toughness measurement for thermoset resinsPolym. Test.26445
[48] Zaman I, Le Q-H, Kuan H-C, Kawashima N, Luong L, Gerson A and Ma J 2011 Interface-tuned epoxy/clay nanocompositesPolymer52497
[49] Ma J, La L T B, Zaman I, Meng Q, Luong L, Ogilvie D and Kuan H-C 2011 Fabrication, structure and properties of epoxy/metal nanocompositesMacromol. Mater. Eng.
296465
[50] Br´echet Y, Cavaill´e J Y, Chabert E, Chazeau L, Dendievel R, Flandin L and Gauthier C 2001 Polymer based
nanocomposites: effect of filler–filler and filler–matrix interactionsAdv. Eng. Mater.3571
[51] Guzm´an de Villoria R and Miravete A 2007 Mechanical model to evaluate the effect of the dispersion in nanocompositesActa Mater.553025
[52] Deng F and Vliet K J V 2011 Prediction of elastic properties for polymer–particle nanocomposites exhibiting an interphaseNanotechnology22165703
[53] Guth E 1945 Theory of filler reinforcementJ. Appl. Phys.
1620
[54] Halpin J C and Pagano N J 1969 The laminate approximation for randomly oriented fibrous compositesJ. Compos. Mater.3720
[55] Bergstr¨om J S and Boyce M C 1999 Mechanical behavior of particle filled elastomersRubber Chem. Technol.72633 [56] Flandin L, Hiltner A and Baer E 2001 Interrelationships
between electrical and mechanical properties of a carbon black-filled ethylene–octene elastomerPolymer42827 [57] Gatos K G and Karger-Kocsis J 2005 Effects of primary and
quaternary amine intercalants on the organoclay dispersion in a sulfur-cured EPDM rubberPolymer463069