Journal of Chemical and Pharmaceutical Research, 2017, 9(3):292-301
Research Article
CODEN(USA) : JCPRC5
ISSN : 0975-7384
292
Design of PID and Model Predictive Controller for Three Phase Flow (Crude
oil+Water+Air) Through Helical Coil and Control Valve in Series
P Krishnamoorthy
1*and R Bharanikumar
21Department of EEE, Government College of Engineering Sengipatti, Thanjvur, India 2
Department of EEE, Bhannari Amman Institute of Technology, Sathyamangalam, Erode, India _____________________________________________________________________________
ABSTRACT
Experimental setup has been constructed in the laboratory to evaluate the three -phase pressure drop and the hold-up for crudeoil+Water+Gas flow through horizontal helical coils and control valve. This kind of three phase flow occurs in petroleum industries especially in oil rigs where crude oil is explored in bulk quantity. While pumping out crude oil in the oil rig, Not only the crude oil is coming alone, it is mixed with water and natural gas and air. So we have to pump out these three components together. These three components (crudeoil+water+gas) forms three phase flow. That is three immiscible fluids, such a complex mixture is pumped in the oil rig pump and it is transported in pipes to the on shore refinery. Often these pumps are repairing because of air-lock, holdup, and oil leakage in oil seal. So transportation stops, this leads to heavy loss to the oil company.so the pumping system has to be designed carefully with proper controller in this work we have designed an experimental set up of such kind of three phase flow through pipes and helical coil and control valve in the laboratory. Crude oil and water is mixed in a tank by an electric stirrer in a tank and air is injected by compressor, so these three component flow via helical coil and control valve in series, pressure drop is measured across helical coil and control valve for different air flow rate and mixture flow rate By using these data, The flow versus pressure drop chart has been drawn .By linearizing the curve by the second order equation the PID and MPC controller has been designed which is controlling the control valve, By adjusting the opening levels of control valve we can change the flow patterns, crude oil flow rate and maximize the extraction of crude oil exploration from the oil-rig by using minimum of pump energy.
Keywords: Flow pattern; Pressure drop; Hold up; PID controller; MPC controller; Pneumatic control valve
_____________________________________________________________________________
INTRODUCTION
Crudeoil+water+ air three phase flow mostly occurs in the oil rig, Petroleum exploration industries, oil rigs and chemical reactors. These three components are immiscible and it occurs in transporting the crude oil+ water+ natural gas mixtures from Off –shore production. when we drill inside the earth for crude oil, Water is frequently coming out from wells in addition to the product crude oil and natural gas streams, Water is naturally coming out within the oil reservoir is called a connate water. Injected water into the oil reservoir at the later stage in the production is known as injected water. So it is important to acquire some knowledge on the flow characteristics of the three phase components, such as pressure drop, holdup and flow pattern to design and operating of oil pumps and control valves used in the pipelines of oilrig. one more problem we have to addressed is sand which is also coming out of the rig in many cases , so the pumping system has to be designed to cope up with four phase. This type four phase flow of crude oil-sand-gas-water is called by a name of AWOS.
293
immiscible fluids. Two phase flow that is two immiscible fluids flows (oil+water) occur frequently in the design of variety of industrial processes and equipment.
Though there were number of publications on two-phase flow (two immiscible liquids) in the 1970 to 2010. There
exists only limited publications on three-phase flow of oil-gas-water mixtures. Decarre et.al. conduct a test in oil water gas study in pipes [1]. They did not study the three phase flow through control valve and helical coil, Wegmann, et.al. did experiments in three phase liquid-liquid-gas flows in 5.6mm and 7mm inner diameter alone Spedding et.al. and Chen et al. has studied horizontal concurrent flow and pressure drop [2-4]. They have identified many flow patterns
.
Zhang, et. al., constructed a unified model for gas-liquid pipe flow and they have studied the dynamics of two phase flow they did not study the three phase flow dynamics [5].Tran, et.al. have studied transient simulation of two phase flow pipes alone not using three phase system, Desalis, et al. have studied dynamic simulation of multiphase pumps and the have studied the complication of pumping gas-oil-water together in a pump [6,7]. In this work also such complication are reduced by proper MPC controller.
Petersen, et.al. developed a general model for multiphase flow [8]. By using this model operation during drilling,,well-control,and intervention were studied about the three phase flow. But here in this work such kind of model is constructed in the laboratory and the proper MPC and PID control of three phase flow through pipes and control valve were not designed. Mann et.al. did Time domain based design and analysis of new PID tuning rules [9], and Zhuang, et.al. did automatic tuning of optimum PID controllers, which is slightly modified and used here for three phase flow controller [10]. Nikolaoo, et. al. studied about model predictive controllers for critical industrial application, he did not designed it for three phase flow system [11]. Garcia, et.al. have studied robust multi model predictive controller for distributed parameter system, they did not design a controller for three phase oil-water-air system Açikgöz, et.al. conduct an experimental study of three- phase flow regimes alone they did not study and design MPC and PID controllers [12,13]
.
The above research works were only on straight horizontal pipes or vertical and inclined pipes. It is found that little work has been done on two-phase flow and crude oil-air-water three phase flows through control valve and helical coils. In chemical reactor, storage tanks and in some nuclear steam generator helical Coils and tubes are used wildly I recent days helical tubes are employed as intermediate heater elements in crude oil transporting system.It is found that there were not any work related to the design of MPC controllers and PID controllers for the control of crude oil –water-air three phase flow through the helical coil and control valve in series .so it is of great interest to conduct research on the flow characteristics in crude oil-air-water three-phase flow through these kinds of helical coil and control valve.
The aim of the present work is about obtaining and understanding the knowledge of crude oil-air-water three-phase flow in helical coil and control value in series in order to design the MPC and PID controllers. The pressure drop characteristics and flow pattern characteristic of crude oil-water-air three phase mixtures at different airflow rate and mixture flow rate and different valve opening level (25% open, 50% open,75% open,100%open) were collected using the experimental setup which is shown in the Figure 1 The combined density of crude oil+ water is varied by mixing them in various ratios. An electric stirrer is designed to mix these two in the tank the combined density of crude oil+ water is varied from 0.81 / liter to0.97 kg / liter. During the experiment the pressure drop across the helical coil and control valve are measured by digital pressure gauge and manometers,
294
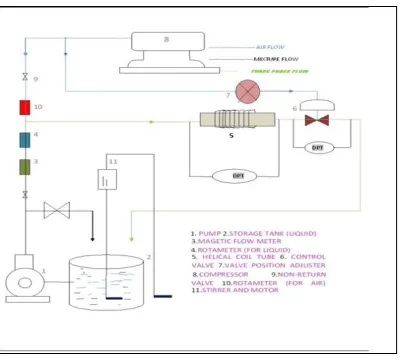
Figure 1: Experimental setup for Crudeoil+Water+ Air (Three Phase Flow) through helical coil and control valve in series
EXPERIMENTAL SECTION
An experimental setup has been constructed in the laboratory to obtain crudeoil-water-air three phase flow .by using this setup. The pressure drop measurement across the helical coil and control valve is collected by using this experimental setup. The Tube used in this experiment has 3.2 m length, 15 cm coil diameter and 23.5mm internal diameter, the experimental setup shown in figure 1.
It has the following accessories:
Compressor pump( for air)
Storage tank( for mixing water and crude oil)
Helical coil tube
Centrifugal pump( for pumping water and crude oil mixture)
Pneumatic control valve
Digital pressure transducer(across valve and helical coil)
Motorized stirrer
A brief description of the above accessories are given below
Air compressor:
A 3 HP 650 RPM two stage reciprocating type air compressors is used in this experimental setup for compressing air. A long tube carrying pressurized air from the compressor is used for injecting air into the system. A Rota meter is used to measure the air flow rate and a control valve is used to adjust the air flow rate.
Centrifugal pump:
A quarter HP 2800 RPM and 18 meter head operated at single phase 230V, 50 Hz A.C supply centrifugal pump is used in this experimental setup to pump the crude oil and water mixture from the tank through the pipeline, helical coiled tube and control valve.
Magnetic flow meter:
This type of flow meter is working according to faraday’s law is used in this experimental setup to measure the crude oil plus water mixture flow rate in an easier way
Rota meter:
Two Rota meter ate used in this experimental setup one is for measuring air flow rate and another one is for crude oil plus water mixture flow rate. Both are coming under area flow meter type
Control value (Pneumatic):
295
Figure 2: Parts of pneumatic control valve
The following equation is used for calculating discharge across the valve in liter per minute Q=CV ΔPv/G
Q= Flow rate in liters per minute,
ΔP = pressure drop across the wide open valve (Psi)
G = Specific gravity at steam temperature relative to water; for water G=1 Cv= factors associated with capacity of valve
Digital pressure transducer:
Two digital pressure transducer are used across the helical coiled tube and control valve to measure the pressure drop across helical coil and control valve. These pressure signals is also send to the MPC controller for controlling the flow rate
Stirrer:
A Stirrer is used in the storage tank to stir up the crude oil and water. The stirrer is made up of metal having length of 0.6meter.it is operated by a motor. By varying the motor speed we can adjust the stirrer speed. In this experimental setup the stirrer speed is constant at 1200 rpm
Experimental procedure:
Connections are given as per the Figure 1. Crude oil and water is taken in the storage tank and these two are mixed by using the motorized stirrer. This mixture is supplied to the test section by using a centrifugal pump; a Rota meter connected in this mixture carrying pipe measures the flow rate. Air from the compressor is supplied to the test section and air Rota meter is attached in the air line is used to measure the flow rate of air. Two digital pressure transducers were used to measure the pressure drop across control valve and helical coil section. The air lock mixture line and airline was removed. The air flow rate is kept constant at 30 LPH by adjusting the valve in the air line. The mixture flow rate is varied to 30LPH, 60LPH, 90LPH and120 LPH. The pressure drop across the helical coil and control valve is noted down now air flow rate is changed to 60 LPH. The mixture flow rate is varied to 30 to 120 LPH and the pressure drop across the valve and helical coil are noted down.
This procedure is repeated until the air flow rate is reached 120 LPH level. The combined density of crude oil and water mixture is varied by adjusting stirrer speed and by taking different ratio of crude oil and water in the storage tank. For various combined density of mixture the above procedure were repeated and the pressure drop data were obtained.
Design of PID and MPC controller:
296
mixture flow rate and pressure drop across the control valve verses mixture flow rate graphs were also drawn. Few number of tables such as Table 1(for combined density 0.89kg/lit), table 2(for combined density 0.93kg/lit3) and Tables 3-5 (combined density of 095kg/lit)) are shown below. For each table two graphs were drawn, one for pressure drop across helical coil vs. mixture flow rate and other for pressure drop across control valve vs. Mixture flow rate. More than two hundred number of graph were drawn, few graphs Figures 3-5(for combined density 0.89kg/lit) Figure 6 and Figure 7(for combined density 0.91kg/lit) Figure 8 and Figure 9(for combined density 0.93kg/lit) are shown below. By using the second order curve fitting corresponding linear equation is obtained (shown inside the graph) by using these linear equation from graphs proper PID controller is designed (4-20mA). The output of PID controller is used to control the pneumatic control valve and the air flow rate maximizes the output oil mass flow rate.
MPC controller
Model predictive control is advanced method of process control used in chemical plants and oil industries. MPC controller used in this work relay on dynamic model of this three phase flow process. The main advantage of MPC is the fact that it allows the current time slot to be optimized, while keeping future timeslots in account. This is done by optimizing a finite time slot. MPC has the ability to anticipate future events and can take control actions accordingly PID and other controllers do not have this ability. MPC models predict the change in depended variables of the modeled system that will be caused by changes in the independent variables. In this process independent variables that can be adjusted by the controller are often either the set points of regulatory PID controller (pressure drop, three phase flow) or the final control elements (control valve). MPC uses the current plant measurements, the current dynamic state of the process. The MPC model and the process variable targets and limits to calculate future changes in the depended variables. These changes are calculated to hold the depended variables close to target while honoring constrains on both independent and dependent variables. The MPC typically sends out only the first change in each independent variable to be implemented and repeats the calculation when the next change is required The flow versus pressure drop curve in our system is not linear. But by using second order curve fitting method the pressure drop curves are linearized. So linear MPC approach is used in this experimental work. In this model predictive controller the superposition of linear algebra enables the effect of changes in multiple independent variables to be added together to predict the response of the dependent variables. This simplifies the control problem MPC is based on iterative finite-horizon optimization of a plant model. At time the current plant state is sampled and a cost minimizing control strategy is computed (by using a numerical minimization algorithm) for a relatively short time horizon in the future. Specifically an online or on-the-fly calculation is used to explore state trajectories that emanate from the current state and find a cost-minimizing control strategy is implemented, then the plant state is sampled again and the calculations are repeated starting from the new current state yielding a new control and new predicted state path. The prediction horizon keeps being shifted forward and for this this reason this method is called as receding horizon control. A discrete MPC scheme is shown in figure: 3
Principle of MPC
MPC is a multivariable control algorithm that uses
An internal dynamic model of the process
A history of past control moves
An optimization cost function J over the receding prediction horizon to calculate the optimize control moves
In this work we use a nonlinear cost function for optimization is given by
J=
∑
w
xi(r
i-x
i)
2+
∑
w
uiΔ
ui2xi= I th controlled variable (flow rate)
ri= I th reference variable (pressure drop)
Ui= I th manipulated variable (opening level of control valve)
Wxi= weighing co efficient reflecting the relative importance of xi
297
Figure 3: A discrete MPC scheme
Table 3: Readings taken from crudeoil-Water-Air (combined density = 0.91(910 grams/liter))system when percentage Of valve opening is 100% and Air flow rate-90 LPH
Air Flow Rate Iph Mixture flow Rate lph Δh Coil cm Δh Valve cm
Experimental Best Fit % Error
ΔP) Coil N/m2 ΔP) Valve N/m2 ΔP) Total N/m2 ΔP) Coil N/m2 ΔP) Valve N/m2 ΔP) Total
N/m2 Coil Valve
90
60 6.2 0.3 7458.5 158.2 7616.7 7584.2 162.4 7746.6 1.66 2.58
90 6.8 0.45 7924.6 178.4 8103 8003.2 181.2 8184.4 0.98 1.55
120 7.3 0.75 8294.8 194.5 8489.3 8394.5 192.4 8586.9 1.19 -1.09
150 7.9 0.98 8745.1 238.8 8983.9 8684.2 242.1 8926.3 -0.7 1.36
[image:6.612.49.572.268.359.2]180 8.24 1.18 9028.23 272.8 9301.03 9145.2 276.5 9421.7 1.28 1.33
Table 4: Readings taken from for Crudeoil-water-Air (combined density=930grams per liter) system when Percentage Of valve opening is 75% and Air flow rate-120 LPH
Air Flow Rate Iph Mixture flow Rate lph Δh Coil cm Δh Valve cm
Experimental Best Fit % Error ΔP) Coil N/m2 ΔP) Valve N/m2 ΔP) Total N/m2 ΔP) Coil N/m2 ΔP) Valve N/m2 ΔP) Total
N/m2 Coil Valve
120
60 4.9 0.2 6984.5 141.4 7125.9 7065.8 143.2 7209 1.15 1.26
90 5.4 0.42 7458.4 154.6 7613 7356.4 156.8 7513.2 -1.39 1.4
120 6.1 0.68 7856.8 181.4 8038.2 8024.5 183.4 8207.9 2.09 1.09
150 6.9 0.79 8345.6 214.2 8559.8 8495.7 213.4 8709.1 1.77 -0.37
180 7.4 0.98 8862.1 250.8 9112.9 8985.3 253.7 9239 1.36 1.14
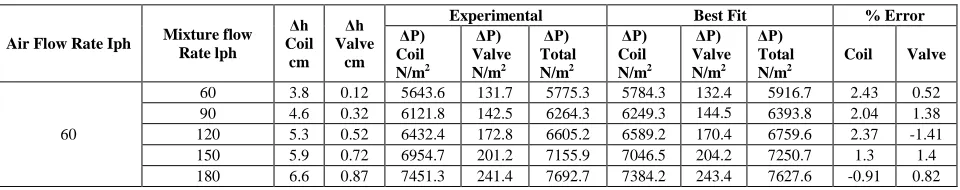
Table 5: Readings taken from crude oil-Water-Air (combined density 950grams per liter) system when Percentage of valve opening -50% and Air Flow Rate -60LPH
Air Flow Rate Iph Mixture flow Rate lph Δh Coil cm Δh Valve cm
Experimental Best Fit % Error ΔP) Coil N/m2 ΔP) Valve N/m2 ΔP) Total N/m2 ΔP) Coil N/m2 ΔP) Valve N/m2 ΔP) Total N/m2
Coil Valve
60
60 3.8 0.12 5643.6 131.7 5775.3 5784.3 132.4 5916.7 2.43 0.52
90 4.6 0.32 6121.8 142.5 6264.3 6249.3 144.5 6393.8 2.04 1.38
120 5.3 0.52 6432.4 172.8 6605.2 6589.2 170.4 6759.6 2.37 -1.41
150 5.9 0.72 6954.7 201.2 7155.9 7046.5 204.2 7250.7 1.3 1.4
[image:6.612.68.548.515.610.2]298
[image:7.612.204.408.290.481.2]Figure 4: Graph between pressure drop across Helical Coil When the valve opening is 100% and Air flow rate Is 90 LPH for crude oil +water+air system (combined density 910 Grams per liter)
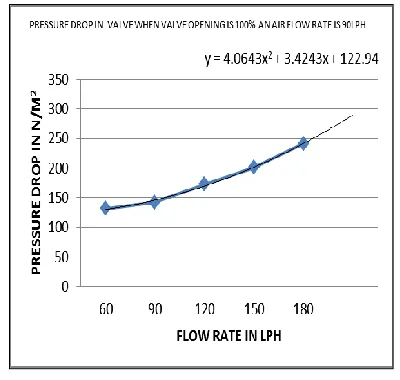
Figure 5:Graph between pressure drop across Control Valvel When the valve opening is 100% and Air flow rate is 90LPH for crude oil+water+air system (combined density 910 grams per litre)
[image:7.612.204.407.513.672.2]299
[image:8.612.201.405.262.455.2]Figure 7: Graph between pressure drop across control valve When the valve opening is 75% and air flow rate is 120 LPH for crude oil+water+ air system (combined density is 930 grams per liter)
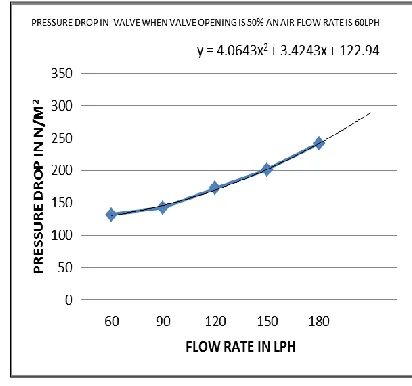
Figure 8: Graph between pressure drop across Helical Coil when the valve opening is 50 % and air flow rate is 60 LPH for crude oil+water+air system (combined density is 950 grams per liter)
[image:8.612.200.406.484.677.2]300
RESULTS AND DISSCUSSION
In this experimental work pressure drop across the and control valve and helical coil for different air flow rate(30LPH.60LPH,90LPH,and 120LPH) and different opening level of control valve(25%,50%,75%,100%) is calculated using combined density of crudeoil plus water
Mixture Flow rate verses pressure drop across the helical coil and control valve curves were drawn. By using curve fitting method (second order) second order equations are obtained (which are shown in the figures)
By using these families of linear equations. And by studying this model a proper MPC and PID controller can be designed to control the control valve opening levels and this controller will adjust and regulate the air flow rate into the system in to obtain the maximum crude- oil mixture come out of the system.
In previous studies Research on Three phase oil--water gas horizontal co current flow by (P.L.speeding,G.F Donnelly,J.S.cole. et.al. 2005 ) did not design this kind of MPC AND PID controller to maximize the crudeoil flow rate (Petersoen,J.,Rommetveit.R,Bjerkevoll,K.S.Froyen.J.et.al.2008)“A general model for single and multiphase flow operations,drilling,completion, well control and intervention” proposed a general model for multiphase flow only. They were worked on mass flow rate and operation and control of oil well. They did not design a MPC or any controller to control the process. (M.R.Garcia,C.Vilas,L.O.Santos,A.A.Alonso.et.al.2012) “A Robust multi-model predictive controller for distributed parameter system” worked on designing Model predictive controller for distributed parameter system in general. They did not design such kind of controller for crude oil exploration system. In this work MPC controller is designed for this kind of multi-phase flow system.
Now a days, many petroleum and crude oil fields have a natural gas-liquid separator installed on the output side of each well to separate the natural gas from the crude-oil .after separation of gas they transport the crude-oil to on shore. But this separation process takes a long time and gas-liquid separator is a very costlier hardware. By using properly designed MPC and PID controller in this system we can pump out these crudeoil-gas-water together and maximize the crudeoil extracting from the oil rig. Petroleum and oil companies have billions of dollars invested in their oil reservoirs even one or two percent improvement in crude oil exploration would save many millions of dollars for the companies.
CONCLUSION
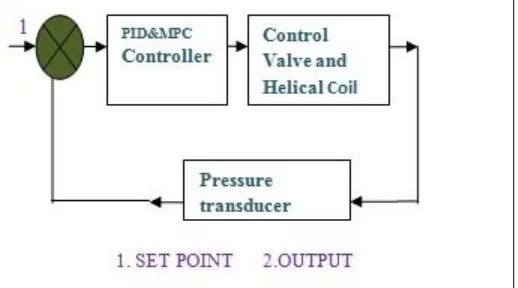
[image:9.612.178.437.501.645.2]The pressure drop across the control valve and helical coil for various three phase flow such as kerosene+water+air, diesel+water+watrer, etc is studied. The flow pattern changes according to the pressure drop, by adjusting the air flow rate in a proper manner we can control the flow rate of oil, flow pattern and maximize the oil flow rate that is extraction of crude oil. By using the experimental pressure drop data and linear equation from graphs for various density fluids such as kerosene, diesel, ground nut oil, transformer oil, rice bran oil a PID and other AI controller are designed and shown in Figure-10 which is controlling the valve opening and air flow rate and maximize the crude oil extraction.
Figure 10: Shows the proposed design of PID and MPC Controller for controlling the three phase flow through helical coil and control valve
301
[1] S. Decarre; E. Duret; QH Tran. Oil water gas study in pipe, paper 320.International conference on multiphase flow, New Orleans, 2001.
[2] Wegmann; J Melke; R von Rohr. Int J Multiphase flow, 2007, 33(5), 484-497.
[3] PL Spedding; GF Donnelly; JS Cole. Chem Eng Res Des, 2005, 83(4), 401-411.
[4] X Chen; L Guo. Int J Multiphase Flow, 1999, 25(6), 1053-1072.
[5] HQ Zhang; Q Wang; C Sarica; J Brill. J Ener Res Tech Tran ASME, 2003, 125(4), 266-273.
[6] QH Tran; JM Masella; D Ferre; CA Pauchon. Int J Multiphase Flow, 1998, 24,739-755.
[7] J Desalis; E Heintze; Charren. Dynamic simulation of multiphase pumbs. 9th BHRG multiphase
international conference,cannes, France, 1999,11-43.
[8] J Peterson; R Rommetveit; KS Bjerkevoll; J Froyen. A general dynamic model for single and multiphase
flow operations during drilling, completion, well control and intervention. Society of petroleum engineers, Jakarta, Indonesia, 2008.
[9] GKI Mann; BG.Hu; RG Gosine, Proc Inst Elect Eng-Control Theory Appl, 2001, 148(3), 251-261.
[10] M Zhuang; DP Atherton. IEEE, 1993, 140(3), 216-216.
[11] M Nikolaou, Model predictive controllers: A critical synthesis of theory and industrial needs, Advances in Chemical Engineering, Academic Press, 2001.