International Journal of Emerging Technology and Advanced Engineering
Website: www.ijetae.com (ISSN 2250-2459, Volume 2, Issue 2, February 2012)187
A Classification of Spirometric Pattern and Modeling
Using Statistical Data Mining
Ms. Prachi D. Junwale
1, Prof. A. W. Bhade
2, Dr. P. N.Chatur
31 M. Tech IV Sem, Department of Computer Science & Engg, GCOE, Amravati (M.S.)-444604, India.
2 Head, Department of Information Technology, GCOE, Amravati (M.S.)-444604, India.
3
Head, Department of Computer Science & Engg, GCOE, Amravati (M.S.)-444604, India.
2[email protected] 3[email protected]
Abstract— Respiratory disease is a medical term that encompasses pathological conditions affecting the organs and tissues. A lungs disease affects health condition of many people. Lungs diseases can be curable in early detection. Spirometry is valuable for diagnosing specific lung disorders as well as detecting lung disease at an early stage. Spirometry (the measuring of breath) is the most common of the pulmonary function tests that measures the amount of air entering and leaving the lungs. This test is often used to help doctors diagnose and determine the severity of various respiratory diseases. The output of spirometry is in the form of graphs i.e. flow-volume loop and volume-time curve. This graph gives various parameters that are used for spirometry modelling. Spirometry modeling gives flow–time curves. This curve is modeled using statistical data mining technique, which is used to obtain new information about breathing condition. Three types of pulmonary diseases such as obstructive, restrictive and mixed diseases are classified on statistical data miner platform. This concept is used to increase the efficiency of classification.
Keywords—Lung disorders, Obstructive, restrictive and mixed diseases, Spirometry, Modelling, Statistical data mining.
I. INTRODUCTION
The respiratory system plays a vital role in delivering oxygen to the body i.e. fuel for all the body's functions. It also removes carbon dioxide waste, eliminates toxic waste, regulates temperature, and stabilizes blood acid-alkaline balance (pH). The lungs are the largest part of the respiratory system and have both "respiratory" and "non-respiratory" functions. The respiratory function involves gas exchange i.e. the transfer of oxygen from the air into the blood and the removal of carbon dioxide from the blood [2]. Non-respiratory lung functions are mechanical, biochemical, and physiological.
The lungs provide a defense against bacterial, viral and other infectious agents, remove various metabolic waste products, control the flow of water, ions, and large proteins across its cellular structures, and manufacture a variety of essential hormones and chemical agents that have important biological roles.
Lung disease refers to disorders that affect the lungs, the organs that allow us to breathe [2]. Breathing problems caused by lung disease may prevent the body from getting enough oxygen. Examples of lung diseases are:
Asthma, chronic bronchitis, and emphysema
Infections, such as influenza and pneumonia
Lung cancer
Sarcoidosis (sar-KOY-doh-sis) and pulmonary
fibrosis.
Respiratory diseases can arise from a number of causes, including inhalation of toxic agents, accidents, and harmful lifestyles [1]. Lung disease is any disease or disorder that occurs in the lungs or that causes the lungs to not work properly. Various techniques are used to detect respiratory problem such as pulmonary function tests (PFT). PFT measure how efficiently lungs perform. PFTs help physicians to evaluate lung function. Spirometry is the most widely used pulmonary function test.
International Journal of Emerging Technology and Advanced Engineering
Website: www.ijetae.com (ISSN 2250-2459, Volume 2, Issue 2, February 2012)188
Spirometry measures the amount (volume) and/or speed (flow) of air that can be inhaled and exhaled [11]. The most common parameters of spirometry test are:
A. Forced expiratory volume in one second (FEV1):
This is the amount of air you can blow out within one second. With normal lungs and airways one can normally blow out most of the air from your lungs within one second.
B. Forced vital capacity (FVC): The total amount of air that one can blow out in one breath.
C. FEV1 divided by FVC (FEV1/FVC): This ratio shows the total amount of air that one can blow out in one breath.
Two curves are shown after the spirometry tests that are flow-volume loop and volume-time curve [5]. The various parameters such as PEF (peak expiratory flow), FIT (forced inspiratory time) and FET (forced expiratory time) can be determined by using flow-volume loop and volume-time curve. These parameters are used to determine the values of model parameters. PEF is the maximal expiratory flow rate achieved and this occurs very early in the forced expiratory manoeuvre. FET is the forced expiratory time. FIT is the forced inspiratory time. In this paper, we will concentrate on data mining approach. For spirometry modelling, statisitca data miner is used to model flow–time curves.
Data mining has become a common activity in practically all areas of business, research and government. The amount of data that is available in various data bases, data warehouses, or via automated data collection equipment is quickly growing larger and becoming ever more complex [4]. Computer hardware (architectures), memory, and processor speeds make it possible to apply novel advanced algorithms to extract information about complex interactions, clusters, and other systematic patterns in the available information. STATISTICA Data Miner was built from advanced modern software tools, and incorporates all standard as well as the most cutting-edge methods and algorithms for extracting information from data [4]. The program also offers very flexible graphical tools that in practice will prove indispensable for data exploration and visual data mining and for interpreting the ―nuggets of information‖ extracted from the data. STATISTICA offers facilities to convert almost any data set into a wide variety of graphical representations via a large selection of graph definition and customization options. From instantly produced, predefined graphs to enhance the interpretation of specific statistical analyses, to graphs designed for rapid data exploration and graphs for detailed custom presentation of data, STATISTICA has a graphing method available to meet every type of analysis. It has a critical importance with regard to the goals of data mining project [4].
II. SPIROMETRY MODEL
Spirometry lung functioning test is based on the flow measurement. During spirometry test, the maximal expiration and the maximal inspiration are essential things. The flow–time curves can be modeled on the basis of the measurements [8]. Fig. 1 shows spirometry model that is used to describe the airflow during the maximal inspiration
Qin(t) and during the maximal forced expiration Qout(t) [11]. The spline functions were used for the modeling process [7]. The spline functions consist of piecewise lengths of regression functions that give the best fit to localized sections of the data [11]. Statistica data miner concept is used for regression function [4]. The flow -time regression functions were fitted to the flow–time curve based on the spirometry measurements. The maximal inflow Qmaxin (t) has been modeled with the regression function given as in equation (1).
Qmaxin(t)=Ain .sin(ϖ.t), t0≤t≤t1. (1) where Ain is amplitude, ϖ is pulsation, (t0, t1) the time of breath–in [3]. The maximal outflow Qmaxout (t) has been modeled by two exponential spline functions as shown in equation(2).
(2) where A1out , A2out , B1out , B2out are the parameters of regression function [1]. Parameters of the model, which is described by above two equations, are arranged in the vector p [ p1,p2,…,pi ]= [Ain, ϖ , A1out, B1out, A2out, B2out], where i = 1,2...6 and the spirometry measurement results are arranged in the vector of measurement y = [y1 ,
[image:2.612.323.566.524.699.2]y2 ,..., y j ]= [FVC, PEF, PIF,TPEF, FET], where j = 1,2...5
International Journal of Emerging Technology and Advanced Engineering
Website: www.ijetae.com (ISSN 2250-2459, Volume 2, Issue 2, February 2012)189
The parameters of model were calculated on the basis of
traditional spirometric parameters. The flow-time
regression functions, given by the equations (2) and (3), were fitted to the flow-time curve Q(t) obtained as the spirometry measurement result [11]. The fitting procedure, by adjusting the parameters of regression functions, assures the equality of the parameters FEV1, FVC, PEF, FIT, FET
calculated on the basis of the spirometry measurements with the same ones resulting from the model functions [8]. This implies that the traditional spirometric parameters such as FEV1, FVC, PEF, FIT and FET are used to
determined ϖ, A1out, B1out, A2out, B2out model
parameters respectively with 1% difference. The model parameter Ain is constant and is equal to 3.912 for normal and disease cases. We assume that the parameter FET = 6 sec. (which is the minimal, correct value) and the ratio of
FIT : FET = 1:2 [8].
Statistical data mining concept is used to model flow-time curve. The output of spline function is given in the form of excel file to the statistical visual basic spreadsheet [4]. This connection is done using Dynamic Data Exchange (DDE) Links. This is a good way to enhance the functionality of a spreadsheet. DDE connection allows to establish a link between a "source" (or server) file (e.g., an Excel spreadsheet) and a client file (e.g., a STATISTICA data file) so that when changes are made to the data in the source file, the data will be automatically updated in the STATISTICA Spreadsheet (client file) [4]. A common application for dynamically linking two files would be in industrial settings, where the STATISTICA Spreadsheet would be dynamically linked with a measurement device
(e.g., in order to automatically update specific
measurements hourly).
Note that before one can create a DDE Link in STATISTICA Spreadsheet, one need to open the file that is to act as the source file (e.g., an Excel spreadsheet) [4]. To create a DDE Link in STATISTICA Spreadsheet, follow these instructions:
Select DDE Links from the Edit menu.
In the Manage DDE Links dialog, click the New Link button to display the New DDE Link dialog. Type in the link statement in the Edit box.
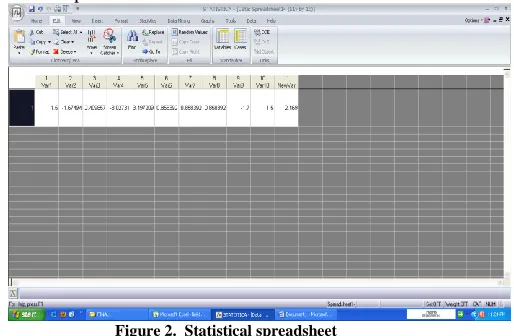
[image:3.612.331.588.168.336.2]After a DDE link connection, the spreadsheet is used as a input to statistical visual basic programs. Fig. 2 shows statistical spreadsheet.
Figure 2. Statistical spreadsheet
STATISTICA Visual Basic language (integrated into STATISTICA) offers incomparably more than just a "supplementary application programming language" that can be used to write custom extensions [4]. STATISTICA Visual Basic (SVB) takes full advantage of the object model architecture of STATISTICA and allows one to access programmatically every aspect and virtually every detail of the functionality of the program. Even the most complex analyses and graphs can be recorded into Visual Basic (SVB) macro programs and later be run repeatedly or edited and used as building blocks of other applications.
International Journal of Emerging Technology and Advanced Engineering
Website: www.ijetae.com (ISSN 2250-2459, Volume 2, Issue 2, February 2012) [image:4.612.47.288.125.312.2]190
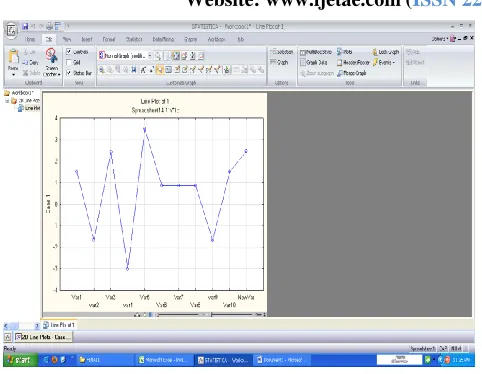
Figure 3. Spirometry model i.e. flow–time curves.
Spirometry model technique is used to obtain new information about breathing condition which makes distinguish between healthy and diseased subjects.
III. PATTERN CLASSIFICATION
Three pulmonary diseases such as restrictive, obstructive and mixed pulmonary diseases are classified in this paper. Obstructive lung disease is a category of respiratory disease characterized by airway obstruction. It is generally characterized by inflamed and easily collapsible airways, obstruction to airflow, problems exhaling and frequent office visits and hospitalizations [8]. Restrictive lung diseases are characterized by reduced lung volume, either because of an alteration in lung parenchyma or because of a disease of the pleura, chest wall, or neuromuscular apparatus. In mixed pattern, respiratory system has both obstructive and restrictive abnormalities [8].
A classification of a pulmonary disease is done with the help of three respiratory parameters (ordered in measurements vector) y = [y1, y2, y3] = [FEV1, FVC,
FEV1%FVC]. The reference value of the particular parameter yj, j = 1, 2, 3 given in equation (3) for a patient of age A[years] and height H[meters] is obtained using Table I.
yj= R1j *H+ R2j*A+R3j , j=1,2,3 (3)
where y1=FVC, y2=FEV1, y3=PEF or FEV1%FVC.
The norms provide the values of the coefficients R1 j
, R2 j
, R3j for each parameter. The coefficients for FVC, FEV1 and
PEF, published by the European Respiratory Society [2]– [3] are presented in Table I. According to the norms, the age range is from 25 to 70 years and the height range is from 1.55 to 1.95 meters (for men) and from 1.45 to 1.80 meters (for women).
The respiratory parameters demonstrate stronger dependence on the height (large absolute value of R1j) than
on the age (small absolute value of R2j).
The individual spirometry results vary depending on condition of the ventilation mechanism. In general, the results close to 100% of the nominal values are interpreted as normal. The results that differ 20% and more from the nominal value are considered abnormal.
TABLEI
THE COEFFICIENTS R1J
,R2J ,R3 J
OF THE REFERENCE EQUATION (3) FOR THE
RESPIRATORY PARAMETERS FVC,FEV1 AND PEF ACCORDING TO THE
EUROPEAN RESPIRATORY SOCIETY.
The decrease of the measurements below their nominal values yjnom, j = 1, 2, 3 is diagnosed as an obstructive, destructive and mixed disease. Table II shows the details.
TABLEIII
THE OBSTRUCTIVE, RESTRICTIVE AND MIXED DISEASE ARE DIAGNOSED BY
DECREASE OF SPIROMETRY PARAMETERS BELOW THEIR NOMINAL VALUE.
Obstructive Restrictive Mixed
y1 ≤ 80% y1nom ≤ 80% y1nom ≤ 80% y1nom
y2 y2nom ≤ 80% y2nom ≤ 80% y2nom
y3 ≤ 70% y3nom y3nom ≤ 70% y3nom
Table II shows a classification technique that is used to classify obstructive, destructive and mixed disease [11]. The result of this classification is referred by physician for further analysis of disease.
IV.CONCLUSION
The various spirometric parameters such as FVC, FEV1, PEF, FIT and FET are used to determined spirometric model parameters. The spirometric model is designed on the basis of model parameters using spline functions. The statistical data mining technique is used for spirometry model.
Coefficients R1j R2j R3 j
For men
FVC, j = 1 5.760 – 0.026 – 4.340
FEV1 j = 2 4.300 – 0.029 – 2.490
PEF, j = 3 6.140 – 0.043 0.150
For women
FVC, j = 1 4.430 – 0.026 – 3.280
FEV1, j = 2 3.950 – 0.025 – 2.600
International Journal of Emerging Technology and Advanced Engineering
Website: www.ijetae.com (ISSN 2250-2459, Volume 2, Issue 2, February 2012)191
Statistical analysis is performed to model the flow-time curve which uses 2D line graph technique. The obstructive, restrictive and mixed lung disorders are classified on statistical data miner platform. This approach increases the efficiency of classification.
References
[1] Quanjer P., Tammeling T. and Cotes J. 1993. Long volumes and forced ventilatory flows: report of working party, standardization of lung function tests. Eur. Respir. Journal.
[2] Quanjer P., Lebowitz M. and Gregg I. 1997. Peak expiratory flow: conclusions and recommendations of a Working Party of the European Respiratory Society. Official ERS Statement. Eur. Respir. Journal.
[3] Kowalski J., Koziorowski A. and Radwan L., Ocena czynności płuc w, chorobach układu oddechowego. 2004. The estimation of the lung function at the pulmonary diseases.
[4] e-handbook of Statistica http://www.statsoft.com 2005
[5] e-handbook of breeze-suite http://www.medgraphics.com 2005
[6] Timothy J. Wilt and Dennis Niewoehner. 2005. Use of Spirometry for Case Finding, Diagnosis, and Management of Chronic Obstructive Pulmonary Disease (COPD). AHRQ Publication No. 05-E017-2.
[7] Kalicka Renata, Słomiński Wojciech and Kuziemski Krzysztof 2007. Modelling of Spirometry: diagnostic usefulness of model parameters. IEEE International conference on Computer as a Tool.
[8] Kalicka R., Słomiński W. and Kuziemski K. 2007. Modelling of the spirometry measurements. XV Krajowa Konferencja Naukowa Biocybernetyka i Inżynieria Biomedyczna, Wrocław.
[9] Jafari S., Arabalibeik H. and Agin K. 2009. Classification of normal and abnormal respiration patterns using flow volume curve and neural network. IEEE international conference on Information Technology.
[10] Lay-Ekuakille Aimé, Vendramin Giuseppe and Trotta Amerigo 2010. Spirometric Measurement Postprocessing: Expiration Data Recovery. IEEE sensor journal.