WAVELET COEFFICIENTS REDUCTION METHOD BASED
ON STANDARD DEVIATION CONCEPT FOR HIGH
QUALITY COMPRESSED IMAGE
1N.S.A.M TAUJUDDIN, 2ROSZIATI IBRAHIM, 3SUHAILA SARI,
1,3
Faculty of Electrical and Electronic Engineering,
2
Prof, Faculty of Computer Science and Information Technology, Universiti Tun Hussein Onn Malaysia, Johor, Malaysia.
E-mail: {1shahidah,2rosziati,3suhailas}@uthm.edu.my
ABSTRACT
This paper proposes a method to estimate the wavelet coefficient threshold value at wavelet details subbands to archive high quality image compression. It uses the features of Discrete Wavelet Transform (DWT) where the images are decomposed into one approximate subband and three detail subbands. The detail subbands consists of Diagonal, Vertical and Horizontal subband. By using the standard deviation concept we estimate the threshold value at each detail subbands. The coefficients with larger value then the calculated threshold will be retained while the rest will be discarded. So, for every single image, different threshold values are calculated and applied at each detail subbands. From the experiment done, we found that the proposed method eliminate the near-zero coefficients effectively without harming the quality of the compressed image.
Keywords: Discrete Wavelet Transform (DWT), thresholding, standard deviation, wavelet coefficients,
image compression
1.
INTRODUCTIONIn recent decades with the rapid development in multimedia world, digital images have been becoming increasingly important. With many modern application employ image graphic extensively, it tend to burden the storage as well as transmission process. As for example, a 24-bit pixel can specify up to 224 ≈ 16.78 million color, resulting 786 432 bytes image size for just a 512 x 512 image resolution. Clearly, there is a need to reduce the image size and compression is one of the promising technique.
Compression is a technique to eliminate the redundant or unwanted information without degrading the quality of the reconstructed image [1]. It is very vital particularly to reduce storage space, transmission time, bandwidth utilization and to enable rapid browsing and retrieval of images from database [2], [3].
Recently, there are a great interest among researcher focusing on compression on various type
standard image are [4], [5] and medical images [6], [7].
2.
DISCRETE WAVELET TRANSFORM(DWT)
Amongst various compression techniques, transform-based compression technique is the promising one [8]. In transformation process, reversible transform convert the signal into set of coefficients. In this process, the associated input samples are being transform to set of unassociated coefficients.
Discrete Wavelet Transform is one of the favorable transform technique. It’s gain a huge intention among researcher in image compression domain because of its’ high energy compactness [6], [9]–[11] . Basically, DWT is a transformation process that produces the minimum number of coefficients that sufficient enough for reconstruction of the transform data accurately to the original signal.
filter is used to split the original signal to several spectral components called subband.
The signal is first will passed a low pass filter for approximation coefficients outputs that resulting a smooth effect. Then, it will passed through the high pass filter for the detail coefficients that enhance the details.
In the analysis filter, some point need to be eliminated. This operation is called downsamping or quantization process and usually illustrated as ↓2. The process is done to maximizing the amount of necessitate detail and ignoring ‘not-so-wanted’ details. Here, some coefficient value for pixel in image are thrown out or set to zero. This is called as the thresholding process and it will give some smoothing effect to the image.
The approximate coefficients are commonly called as LL (low resolution approximate image) while the details coefficients are called as HL (intensity variation along column, horizontal edge), LH (intensity variation along row, vertical edge) and HH (intensity variation along diagonal).
The approximate wavelet coefficient can be represented as;
(1) Where;
j0 is the wavelet scale;
N1 and N2 are the length and width of an image;
S(n1 , n2) is the image function;
k1 and k2 are the index written from n1 and n2
respectively;
Ø is the scaling function filter;
While the detail subbands are expressed as;
(2)
Where;
i is the details subband either Diagonal (D), Vertical (V) or Horizontal (H);
is the wavelet filter.
The analysis filter is repeated on approximate subband since it contain a large energy content which is 1/64 of the original image size [12]. While the details subbands carries small coefficients as it can be perceived as black region in detail subbands. This multiresolution capabilities will enable the user to treat the subbands independently depending on the one needs of application.
3.
WAVELET COEFFICIENTSTHRESHOLDING
Wavelet coefficient has a good time resolution at higher frequency to capture the image and good frequency resolution at lower frequency to capture image background. Human eyes is less sensitive to high frequency but very sensitive to low frequency [7].
In the wavelet transform, the noise energy is distribute in all wavelet coefficients, while the original signal energy is found in some of the coefficients. Therefore, the signal energy is found much larger than noise energy. So, small coefficients can be considered as caused by noise while large coefficients are triggered by significant signal features.
Based on this idea, thresholding process is proposed. Thresholding is a process of removing the small absolute coefficients value while retaining the large absolute coefficient value. It will produce finer reconstruct signal. Since this method is taking the condition that the amplitude of wavelet transform coefficients signals are much larger than noises, so the unconsidered noise will be removed while holding the significant signal. But, threshold value estimation is very crucial and it is hard to obtain since if the threshold value is set too small, it will adopt noise into the signal. Whereas, if the threshold value is set too high, it will be screened out the importance of coefficients value leading to degradation of image quality [13].
To find the best threshold is hard because it requires the knowledge of original data. Usually the contemporary hard and soft threshold regularly being used since it is closer to the optimum minimal rate and protect signal regularity beside reducing the gap between preserve and discarded coefficient for a better recovery [15].
Shanavaz in [16] suggest an idea in compressing the image by fixing the percentage of wavelet coefficients to be zeroed. These techniques however limit the performance of compression because it create frontier where the coefficients cannot be reduced higher than the permanent limit.
Another solution is proposed by Yi-Fei [17]. He suggest a method using reference points coding and fixing the threshold value. This method is simple and the computational complexity is low. Some similar researches also done by [18], [19].
Although the forgoing techniques can make an effective compression based on fixing the threshold value, but they just consider the whole subband as equal. Subsequently, just one threshold value is apply in general and it doesn’t consider the different characteristic occurred in different subbands, leaving the individual subband’s special representation unexploited.
Targeting on this problems, this research is done to develop an efficient threshold estimation by using the wavelet features to produce an efficient compression algorithm besides decreasing the image size without tolerating with the precision of image quality.
4.
METHODOLOGYIn this paper, we are proposing a method that can eliminate the unwanted or unsignificant wavelet coefficients value effectively by proposing a method to estimate the threshold value at each detail subbands based on its’ individual characteristic.
The proposed method start with transforming an input image by using DWT. It pass through low pass filter resulting approximation subband that carries large energy content of an image. At that point, it will passed the high pass filter that generating the detail coefficients that carries
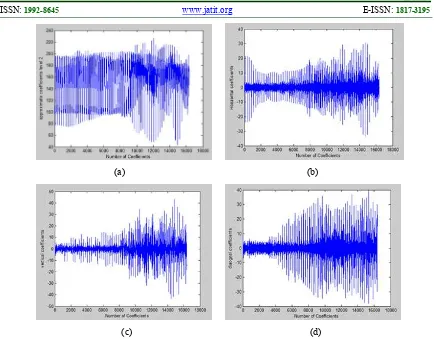
specific detail properties. Figure 1 shows the wavelet coefficients representation at each subband of Lena image.
As can be seen in Figure 1, we found that the wavelet coefficients at approximate subband scattered in a huge range of value since it carries a huge energy content. While a large ‘near-zero’ wavelet coefficient are found at details subbands (the horizontal, vertical and diagonal details subbands), since it carries only its particular detail properties that spread at certain region only.
As the approximate subband carries a large significant information of image energy, we left it untouched to preserve the value. Modification at this subband will destroy the energy content and may lead to huge loss or lossy compression [20].
(a) (b)
[image:4.612.91.525.71.410.2]
(c) (d)
Figure 1: Wavelet Coefficients representation at (a) Approximate subband (b) Horizontal subband (c) Vertical subband (d) Diagonal subband
[image:4.612.147.486.463.598.2]
Figure 3: The hard region at Lena’s edgemap representation of wavelet coefficients
While the high value coefficients demonstrating the fine details and edges region of an image. This region is usually called as ‘hard region’ and modification at these coefficients value are not suggested since it will harm the image quality, thus degrading the PSNR value. Moreover, our Human Visual System (HVS) is very keen in detecting changes in hard region (refer Figure 3).
Targeting on this features, we are proposing a new paradigm for setting the threshold value by estimating the threshold value using the standard deviation method.
The standard deviation can be defined as:
(3) Where,
(4) Here, we consider that n is representing the amount of wavelet coefficient at the specific detail subband, while is wavelet coefficient value at a specific point at that subband.
By applying equation (2) into equation (3) and (4), we are able to calculate the new detail subband threshold value.
As for example, the new threshold value for
vertical details, λv, can be represent as;
(5) Where;
(6) After the new estimated threshold value is obtained, the thresholding process will take place. At this point, each coefficient value that is lower than λv, will be discarded while the rest are
remained. So, the new remaining vertical detail coefficients can be expressed as:
(7)
The same concept also applied at horizontal and diagonal details.
5.
RESULT AND ANALYSIS
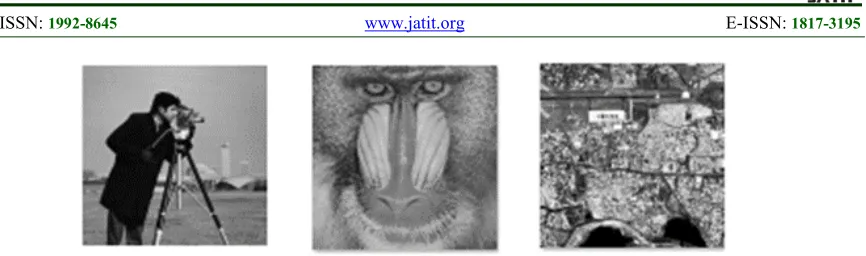
Figure 4: Standard test image used. From left to right: cameraman, mandrill, Hyderabad
To test the performance of our proposed method, we compare our method with the prominent wavelet-based compression algorithm: Embedded Zerotree Wavelet (EZW), Set Partitioning in Hierarchical Trees (SPHIT), Wavelet Different Reduction (WDR) and Adaptive Scanned Wavelet Different Reduction (ASWDR). We test the performance using Peak Signal to Noise Ratio (PSNR), Mean Measure of Structural Similarity (MSSIM) and Compression Ratio (CR).
The PSNR can be define as:
(8) While MSE is define as:
(9)
[image:6.612.91.524.70.198.2]M.N is the size of the image while is the pixel values of original image and is the pixel value of the reconstructed image.
Table 1: PSNR Comparison Between Prominent Wavelet-Based Compression Algorithms On Three Standard Test Image With The Proposed Method.
Method Image
Cameraman Mandrill Hyderabad
EZW 33.49 25.3458 25.7014
SPIHT 28.99 24.8944 20.0215
WDR 33.49 25.3458 25.7014
ASWDR 33.49 25.3458 25.7014
Proposed 47.13 40.0860 31.2780
As shown in Table 1, our proposed method present a very good PSNR value compared to the other wavelet-based compression algorithm. Typically, if the PSNR value is equal or larger than 40db, the quality of an image is superb because the human observer cannot detect any difference between the original and compressed image [22].
To yield another standard objective image quality measure, we run the Mean Structural SIMilarity (MSSIM) index proposed by [23]. This test is purposely to evaluate the overall quality of
compressed image and the result is comply with HVS.
Table 2: MSSIM Comparison Between Prominent Wavelet-Based Compression Algorithms On Three Standard Test Image With The Proposed Method.
Method Image
Cameraman Mandrill Hyderabad
EZW 0.8541 0.6552 0.9285
SPIHT 0.7524 0.6307 0.7852
WDR 0.8541 0.6552 0.9285
ASWDR 0.8541 0.6552 0.9285
[image:7.612.83.528.259.346.2]Proposed 0.9895 0.9920 0.9796
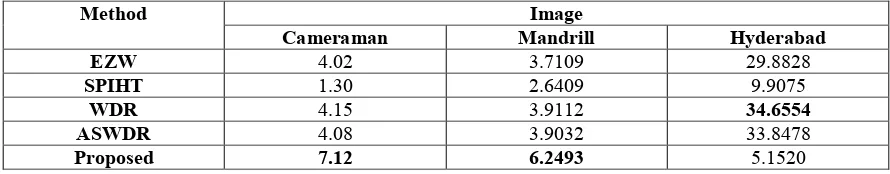
Table 3: Compression Ratio Comparison Between Prominent Wavelet-Based Compression Algorithms On Three Standard Test Image With The Proposed Method.
Method Image
Cameraman Mandrill Hyderabad
EZW 4.02 3.7109 29.8828
SPIHT 1.30 2.6409 9.9075
WDR 4.15 3.9112 34.6554
ASWDR 4.08 3.9032 33.8478
Proposed 7.12 6.2493 5.1520
The third test done is Compression Ratio (CR). It is done to measure the compression efficiency. The CR can be described as the ratio of number of zeros in compressed image to the number of coefficient in original image.
From table 3, we found that our proposed method outperform for Cameraman and Mandrill while slightly not good in Hyderabad. The reason that lead to this result is our proposed method works well with the image with large area of smooth image because it contains more ‘near-zero’ coefficients. However, Hyderabad is just consist of small smooth area. Meanwhile, WDR produce the best CR value for Hyderabad in this test.
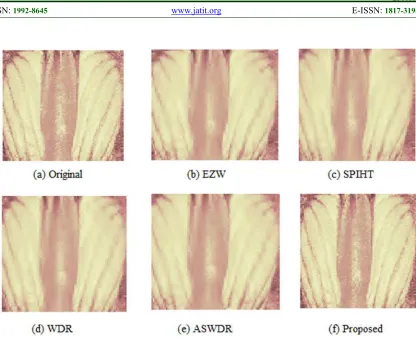
Figure 5: Quality Of The Final Compressed Mandrill Image By Using The Prominent Wavelet-Based Compression Algorithms And The Proposed Algorithm.
6.
CONCLUSIONIn this work, we have proposed an efficient wavelet coefficients reduction method based on standard deviation concept for a high quality compressed image. Estimation of ‘near-zero’ coefficients using standard deviation concept has gain a good compressed image quality as can be seen in the analysis done.
As for further work, we will continue with improving the encoding process to produce a higher compression ratio.
7.
ACKNOWLEDGEMENTSThe authors would like to thank the Universiti Tun Hussein Onn Malaysia (UTHM), Research, Innovation, Commercialization and Consultancy Management (ORICC) office for facilitating this research activity under Research Supporting Grant Scheme (RSGS) Vot U109.
REFRENCES:
[1] S. . Subramanya, “Image compression,” IEEE
Potentials, vol. 20, no. March, 2001, pp. 19–23.
[2] S. Burak, G. Carlo, T. Bernd, and G. Chris, “Medical Image Compression Based on Region of Interest, With Application to Colon CT Images,” in 23rd Annual EMBS International
Conference, 2001, pp. 2453–2456.
[3] S. Hashemi-berenjabad, A. Mahloojifar, and A. Akhavan, “Threshold Based Lossy Compression of Medical Ultrasound Images Using Contourlet Transform,” 18th Iran. Conf.
Biomed. Eng., no. December, 2011, pp. 14–16.
[4] Y. S. Bekhtin, “Adaptive wavelet codec for noisy image compression,” 2011 9th East-West
Des. Test Symp., 2011, pp. 184–188.
[6] S. D. Thepade, “Extended Performance Comparison of tiling based Image Compression using Wavelet Transforms & Hybrid Wavelet Transforms,” in IEEE Conference on
Information and Communication Technologies,
2013, pp. 1150–1155.
[7] R. Loganathan and Y. S. Kumaraswamy, “Active Contour Based Medical Image Segmentation and Compression Using Biorthogonal Wavelet and Embedded Zerotree,”
Indian J. Sci. Technol., vol. 6, April 2013, pp.
4390–4395.
[8] S. Singh, V. Kumar, and H. K. Verma, “Adaptive threshold-based block classification in medical image compression for teleradiology.,” Comput. Biol. Med., vol. 37, no. 6, 2007, pp. 811–9.
[9] N. S. . Md Taujuddin and R. Ibrahim, “Medical Image Compression by using Threshold Predicting Wavelet-Based Algorithm,” Lect. Notes Electr. Eng, Adv. Comput. Commun.
Technol. Springer, vol. 315, 2014, pp. 755–765.
[10] M. Boix and B. Cantó, “Wavelet Transform application to the compression of images,”
Math. Comput. Model., vol. 52, no. 7–8, 2010,
pp. 1265–1270.
[11] N. Gupta, “Denoising and Compression of Digital Images using Wavelets,” Concordia University, Canada, 2004.
[12] J. Walker and T. Nguyen, “Wavelet-based image compression,” Transform Data
Compression, 2001.
[13] C. Zhen and Y. Su, “Research on Wavelet Image Threshold De-noising,” 2010 Int. Conf.
Futur. Power Energy Eng., 2010, pp. 3–6.
[14] A. I. Scott, “Denoising by W avelet Thresholding Using Multivariate M inim um D istance Partial D ensity E stim ation,” Rice University, 2006.
[15] V. Bruni and D. Ã. Vitulano, “Combined image compression and denoising using wavelets,” Signal Process. Image Commun., vol. 22, 2007, pp. 86–101.
[16] K. T. Shanavaz and P. Mythili, “An Improved Technique for Evolving Wavelet Coefficients for Fingerprint Image Compression,” in
ICCCCT’10, 2010, pp. 665–669.
[17] Y. Tan and W. Tan, “Image Compression Technique Utilizing Reference Points Coding with Threshold Values,” in ICALIP2012, 2012, pp. 74–77.
[18] P. C. Tay, S. T. Acton, and J. A. Hossack, “Computerized Medical Imaging and Graphics A wavelet thresholding method to reduce
ultrasound artifacts,” Comput. Med. Imaging
Graph., vol. 35, no. 1, 2011, pp. 42–50.
[19] J. Abirami, K. N. S. Sivasankari, and S. Ramya, “Performance analysis of image compression using wavelet thresholding,” IEEE
Conf. Inf. Commun. Technol., 2013, pp. 194–
198.
[20] L. E. U. Sánchez, H. M. P. Meana, M. N. Miyatake, A. Santa, A. No, C. San, F. Culhuacan, and D. Coyoacán, “Wavelet Image Compression Using Universal Coefficients Matrix Detail Estimation,” IEEE Comput. Soc., 2004.
[21] C. Hsia, J. Guo, and J. Chiang, “A fast Discrete Wavelet Transform algorithm for visual processing applications,” Signal
Processing, vol. 92, no. 1, 2012, pp. 89–106.
[22] R. K. Yadav, S. P. Gangwar, and H. V Singh, “Study and analysis of wavelet based image compression techniques,” Int. J. Eng. Sci.
Technol., vol. 4, no. 1, 2012, pp. 1–7.