Journal of Chemical and Pharmaceutical Research, 2014, 6(6):2527-2534
Research Article
ISSN : 0975-7384
CODEN(USA) : JCPRC5
Research on the regional difference in culture industry based on
spatial econometric method
Juan Li*, Zuting Zheng and Yi An
Hebei United University, Tangshan, Hebei, China
_____________________________________________________________________________________________
ABSTRACT
In this paper, the three major indexes of production factor, agglomeration state and national policy influencing the difference were extracted on the basis of the research on China’s regional difference in culture industry and the empirical analysis was made according to the Theil Index and analysis model of spatial autocorrelation index and numerical theory of spatial econometric model by use of the national standard statistical data concerning culture industry of 2008 and 2012, to obtain the tendency of high development level in the eastern China and low development level in western China concerning Chinese cultural industry development and the relevant analysis results related to local cultural industry level and the cultural level in adjacent area and provide the theoretical basis for analysis of China’s regional difference in culture industry.
Key words: Regional difference in industrial level, spatial econometric model and spatial correlation analysis _____________________________________________________________________________________________
INTRODUCTION
As another economic growth point of national economic development, the culture industry has been raised to a strategic level. However, the spatial difference problem of China’s cultural industry has drawn the attention of many scholars with the rapid development of culture industry and the difference is both beneficial and adverse to the development of culture industry [1-5]. For the purpose to explore the influence of the degree of China’s regional difference in culture industry on the cultural industry development, the factors influencing the cultural difference were extracted on the basis of theoretical analysis in this paper, with the expectation to carry out the quantitative analysis by use of spatial econometric model and obtain the reason for regional difference in culture industry and the corresponding scientific improvement measures [6-10].
industry development efficiency of 31 provinces and cities in China from 2006 to 2010 by use of the Stochastic Frontier Approach (SFA) and obtained the regional difference characteristics of Chinas provincial cultural industry efficiency[6]; Xu Li-xin and other people(2014)collected the data of 38 cultural industry listed companies of 2010, made an regression analysis by use of DEA-Tobit two-stage model and carried out the empirical research on China’s cultural industry listed companies[7, 13].
In this paper, the characteristics of China’s regional difference in culture industry was analyzed on the basis of previous research and the research was carried out on the national standard statistical data concerning culture industry of 2008 and 2012 based on the introduction of the spatial econometric model and the quantitative method for the two major factors resulting in the regional difference, with the expectation to explore the effectiveness of the index extracted in the paper and to make a scientific regulation and control and prediction in the healthy development and development tendency of China’s cultural industry.
ANALYSIS OF SPATIAL STRUCTURE CHARACTERISTIC OF CHINA’S CULTURAL INDUSTRY
Analysis of influence of production factor on regional cultural industry
The traditional trade theory shows that, the industrial spatial distribution is principally decided by the external factor and if the external factor is relatively advantageous to other regions to a certain extent and then the cultural industry in the region will be well developed, and if no comparison exists in the advantages between various regions, the tendency of balanced development will appear in the industrial economy of various regions. Also, the cultural industry development can't do without the influence of external factor, because that the labor innovation, creation and operating management are the key factors to the success of cultural product in the production process of culture industry and the geographical distribution of quality human capital also decides the regional difference in culture industry.
For the purpose to embody the degree of influence of the difference in the production factor on the regional difference in culture industry, the two variables were introduced in this paper, with the expectation to present the production factors in a clear way by means of the two variables.
1)Cultural resources variables(
cr
), the variable refers to the historical culture resources and can be measured by the ratio of the quantity of world heritage and famous historic and cultural city in various regions to that of China;2)Human capital variable(
hc
), the variable may be expressed by the percentage of population received the secondary education or post-secondary education and above in various regions to the total population in the region.Analysis of influence of industrial agglomeration state on regional cultural industry
The industrial agglomeration state in a region influences the regional industry development to a certain extent and Porter once proposed that the Industry of Competitive Advantage of Nations in the World is Featured By Geographical Concentration and the Industrial Agglomeration is Beneficial to Promotion of Industrial Competitiveness and National Competitiveness[8]. The aggregation state of an industry in a region is the basic index reflecting the industrial development degree between different regions.
Also, the aggregation state of culture industry in a region is the basic index reflecting the industrial development level and the concentrated cultural production and service action have obvious agglomeration economic effect, which will not reduce the production cost and commercial risk but also promote the generation of culture creativity and knowledge spillover and play a role in attracting other cultural enterprises [9].
For the purpose to evaluate the aggregation state of culture industry scientifically, the following three variables were introduced in this paper:
1) Average scale(
cs
), the average scale of cultural enterprise may be measured by the relation (1)of cultureindustry staff
N
, enterprise quantityM
national average ratiok
:k
M
N
cs
⋅
=
(1)
2)Degree of specialization(
lq
), the degree of specialization of culture industry may be expressed by the ratio of, thepercentage of the added value of national culture industry
∆
S
to national gross product, with the calculation method shown in formula(2),S gdp
GDP s lq
∆ × × ∆ =
(2)
3) Urbanization level(
urban
), the urbanization level may be measured by the ratio of population of non-agricultural household.Analysis of influence of national policy on regional cultural industry
The culture industry is an important part to promote the national cultural soft power and its development level can't do without the support of national policy. In recent years, the rapid development of China’s cultural undertaking and industry is inseparable from the System Release of open cultural market and policy promoting effect[10].
The flowing three variables were introduced in this paper for a clearer presentation of the degree of influence of national policy on the regional difference in culture industry:
1)
cpg
, ratio of quantity of national cultural industrial park and cultural industry demonstration base to that of the whole country, for reflecting the regional cultural industry polity of central government and the ability of provinces and regions to strive for resource from the party central committee;2)
cps
, ratio of quantity of provincial cultural industrial park and cultural industry demonstration base to that of the whole country, for reflecting the provincial cultural industry policy orientation;3)Fiscal expenditure(
fs
), measured by the ratio of the governmental fiscal expenditure on culture, sports and media to that of the national average value, for reflecting the willingness of the government to develop the culture industry.MODEL THEORY OF SPATIAL ECONOMETRIC METHOD
Theil Index of determination index
The indicator for measurement of the inequality or unbalance includes the two major categories of absolute indicator and relative indicator. The absolute indicator includes the extreme value and extreme difference value and so on and is commonly not adopted because it is easy to be influenced by the dimension, so the relative indicator is adopted for measurement of the malconformation, for example: standard deviation, coefficient of variation, coefficient of deviation from average and Gini coefficient and other methods; however, these estimation indexes have the disadvantages of failure in analysis of the general variation of different subsample and the generalized entropy index
GE
emerges at the right moment and the entropy is adopted by the Theil Index to reflect the complexity anddescribe the economic imbalance[11] as shown in formula(3)below:
= = =
∑
∑
= =
N k
k i
i N i
i i
y N y y y r
r r N T
1 1
1 ,
log 1
(3)
Formula (3) corresponds to formula(4)because that the probability can be indicated by the ratio of individual output to the total output.
( )
y
( )
N
H
N
y
N
y
y
N
y
T
N
i
i i
log
log
1
−
=
×
=
∑
= (4)
The measurement of economic difference may be expressed by the generalized entropy index as shown in formula (5),
( ) ( )
− −
=
∑
=
N
i i y y N GE
1 1 1 1
1 α
α
α
α
Where:
α
is a constant; ifα
=
0
the Theil Index isL
and ifα
=
1
and the Theil Index isT
, as expressed by formula (6),
=
=
=
∑
∑
= =0
log
1
log
1 1α
α
K i i i K i i i iy
y
N
N
y
y
y
N
y
N
GE
(6)Formula (6) indicates that the weighted calculation is carried out by GDP proportion for
GE
( )
1
and that the weighted calculation is carried out by the ratio of regional population to the total population forGE
( )
0
. In this paper,GE
( )
0
was adopted for measurement of the regional difference in China’s cultural industry development. In general, the spatial autocorrelation index is adopted Moran’s I for embodiment of the correlation test for spatial variable[12], as shown in the expression (7),(
)
(
)
∑∑
∑∑
= = = =−
−
=
′
n i n j ij n i n j j iij
Y
Y
Y
Y
S
W
W
1 1 2 1 1I
s
n
Mora
(7)Where:
S
is the mean square error;Y
is the average value;Y
i is the observed value of regioni
;n
is totalnumber of regions; and
W
ij is the binary adjacent spatial weight matrix. If i is adjacent to j,W
ij=
1
, and if i is not adjacent to j, 0, and the value of factor on diagonal lineW
ii is 0 in general.The normal distributional hypothesis may be adopted for test whether the spatial autocorrelation exists in
n
regions according to the calculation result of Moran’s I index, with its standard form shown in formula (8)[12] .( )
( )
( )
I
VAR
I
E
d
Z
=
Mora
n
′
s
I
−
(8)
The expected value and square deviation normal distribution
Mora
n
′
s
I
index may be calculated according to the spatial data distribution, with its expression shown in formula (9),( )
( )
(
)
( )
−
−
+
+
=
−
−
=
I
E
n
w
w
nw
w
n
I
VAR
n
I
E
n n n 2 2 2 0 2 0 2 1 21
3
1
1
(9)Where: expression
w
0,
w
1,
w
2 is shown in formula (10)and express the sum of columni
andj
in spatial weightsmatrix.
(
)
(
)
+
=
+
=
=
∑
∑∑
∑∑
= = = = = • • n i j i n i n j ji ij n i n j ijw
w
w
w
w
w
w
w
1 2 2 1 1 2 1 1 1 02
1
2
1
(10)According to formula (8)and (9), the test for whether the spatial autocorrelation exist in n regions may be performed,
adjacent regions.
Spatial econometric model
According to the analysis result of regional difference in culture industry mentioned in the previous chapter, the measurement model may be set as the form shown in formula (11).
+
+
+
+
=
+
+
=
+
+
=
+
+
=
it it it
it it
it it it
it it it
it it it
CV
CV
CV
CV
ε
β
β
β
β
β
ε
β
β
ε
β
β
ε
β
IP
AE
FE
IP
AE
FE
3 2
1 0
3 0 2
0 1
0
,
,
(11)
Where:
CV
it is the ratio of the added value of cultural industry per capita in yeart
and regioni
;FE
is theproduction factor vector quantity which consists of factor
cr
andhc
;AE
is the industrial agglomeration statevector which consist of factor
cs
andlq
; andIP
is the national policy vector which consists of factorcpg
,cps
andfs
.The spatial econometric models are of various types and the model applied in the research is spatial effect[13], which is applicable to the spatial constant coefficient regression model of cross-section data and consists of spatial lag model(SLM) and spatial error model(SEM), where the expression of SLM is shown in formula (12),
it it it
it it
it
WCV
CV
=
ρ
+
β
0+
β
1FE
+
β
2AE
+
β
3IP
+
ε
(12)
Where:
ρ
is spatial autoregressive coefficient andW
is spatial weight matrix.The mathematical expression of SEM is shown in formula (13)
+
=
=
it+
it+
+
+
itit it it
it it
W
CV
µ
ε
λ
ε
β
0β
1FE
β
2AE
β
3IP
ε
(13)
Where:
λ
is the spatial error coefficient of dependent variable vector ofn
×
1
interface andµ
it,
ε
it is therandom error vector of normal distribution.
EMPIRICAL ANALYSIS OF SPATIAL STRUCTURE CHARACTERISTIC OF CULTURE INDUSTRY BASED ON SPATIAL ECONOMETRIC METHOD
Analysis of regional difference in culture industry based on Theil Index
[image:5.595.166.449.569.621.2]In this paper,
GE
( )
0
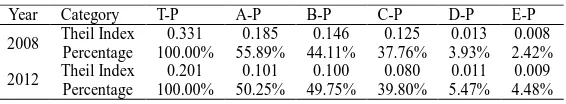
is selected for measurement of the regional difference in China’s cultural industry and the overall difference and difference in China’s cultural industry development between and within eastern, middle and western China in 2008 and 2012 I is shown in table 1.Table 1: List of regional cultural difference result based on Theil Index analysis
Year Category T-P A-P B-P C-P D-P E-P 2008 Theil Index 0.331 0.185 0.146 0.125 0.013 0.008
Percentage 100.00% 55.89% 44.11% 37.76% 3.93% 2.42% 2012 Theil Index 0.201 0.101 0.100 0.080 0.011 0.009 Percentage 100.00% 50.25% 49.75% 39.80% 5.47% 4.48%
Note: T-P is the overall difference; A-P is the difference between regions; B-P is the difference within a region; C-P is the difference in eastern China; D-P is the difference in middle China; and E-P is the difference in western China.
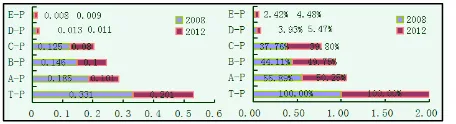
Figure 2: Schematic diagram of comparison of difference in China’s regional cultural industry in 2008 and 2012
The left section of figure 2 shows the Theil-L value of overall difference, the difference between different regions in eastern, middle and western China and the difference within a region in 2008 and 2012 and the right section of figure 2 indicates the percentage of difference between different regions in eastern, middle and western China to the difference within a region in 2008 and 2012. The data in table indicates that the influence of the difference between different regions on the overall difference is obviously higher than that in a region, but the contribution rate between different regions is as high as 55.89% in 2008 and as is reduced to 50.25% in 2012; the inter-provincial difference in cultural industry development in eastern China has a high influence on the overall difference in China and is on an upward tendency with a increase by 2.04% in 2012 compared with that in 2008; however, the inter-provincial difference in cultural industry development in western China is small but is on an upward tendency too with the sum of contribution rate in the regions of western and middle China increased by 3.60% in 2012 compared with that in 2008.
The left section of figure 2 shows the overall difference, the difference within a region and the difference in the regions of eastern China are on an downward tendency as time goes on, but the difference in the regions of middle China and the difference in the system regions are on an upward tendency as time goes on, that is, the cultural industry economy in western and middle China occupies a increasingly high proportion.
Analysis of global spatial autocorrelation of regional difference in culture industry
In the research, the global spatial autocorrelation statistics
GE
( )
0
was adopted for the analysis of geographic space correlation of cultural industry distribution in 31 regions divided according to the provinces in China. See table 2 for( )
0
GE
and statistics testp
in China, western China, eastern China and middle China in 2008 and 2012.According to the data in table 2, the added value of cultural industry per capita
GE
( )
0
is on an upward tendency each year as time goes on, with the value of 0.214 in 2008 increased to 0.283 in 2012 with the rate of increase by32.2% and the value of statistics
p
is smaller than 0.05, so it passes the significance test; the distribution of culture industry in geographic space has an obvious positive autocorrelation which grows stronger each year as time goes on; the spatial correlation in eastern regions is weak; the correlations in middle and western regions are strong and pass [image:6.595.160.449.552.618.2]the significance test for
p
value less than 0.01; and the correlation in the eastern regions and middle regions in 2012 increases than that in 2008 from the view of time, with a slowdown in growth[14].Table 2: List of the statistic value
GE
( )
0
and test value of significancep
of spatial autocorrelation of culture industryYear Statistic Nationwide Eastern region Middle region Western region
2008 GE
( )
0 0.214 0.007 0.491 0.318p
0.013 0.379 0.000 0.0002012 GE
( )
0 0.283 0.012 0.502 0.135p
0.033 0.224 0.000 0.000The Moran’s I values of the regional cultural industry level in 31 regions and the industrial level in adjacent regions can be obtained, including Moran’s I=0.1402 for CV2008 and W_CV2008 and Moran’s I=0.2140 for CV2012 and W_CV2012.
Estimation for the influence factor of regional difference in culture industry
In formulas (11),(12) and (13),
W
is the adjacent matrix;i
=
1
,
2
,
L
,
31
andt
=
2008
,
2012
; and the fixed effect model is adopted for GLS calculation for the model. The influence factors of production factorEFP
,aggregation state
SA
and national policyNP
are elaborated above, includingcr
andhc
inEFP
,cs
,lq
and
urban
inSA
andcpg
,cps
andfs
inNP
. In this paper, there are five fixed effects and the first threeamong which may be regarded as the comprehensive embodiment of production factor
EFP
, aggregation stateSA
and national policy
NP
. According to the estimation result condition of influence factor of regional difference in culture industry, the linear relation between the major factors of production factor, aggregation state and national policy and the corresponding indexes are shown in formula (14), + + = + + == + fs cps cpg NP urban lq cs SA hc cr EFP 872 . 0 659 . 0 502 . 30 428 . 3 476 . 2 106 . 0 458 . 13 960 . 18 (14)
The matrix for the standard deviation of coefficient estimation of various statistics, as shown in formula (5), may be obtained according to the estimation result of influence factor of regional difference in culture industry:
(
)
( )
( )
( )
( )
( )
( ) (
)
( ) ( )
( )
= = 323 . 0 272 . 2 038 . 7 664 . 0 193 . 0 164 . 0 / 247 . 1 724 . 4 / fs s cps s cpg s urban s lq s cs s hc s cr s NP s SA s EFP s (15)Moreover, the overall analysis of the fixed effect and spatial lag fixed effect was made for the influence factor of regional difference in culture industry, that is, the two fixed effects in the five fixed effects except for production
factor
EFP
, aggregation state and national policyNP
to estimate the measurement results of influence factors of the estimated coefficient of the overall fixed effect and spatial lag fixed effect against each statistics and the corresponding square deviation of estimated coefficient.The results shows that the cultural resources variables
cr
and human capital variablehc
have the positive influence on the cultural industry development level, so the regional cultural industry development may be accelerated byrational use of the production factor value; the degree of specialization of
lq
and urbanization levelurban
promote the added value of culture industry with a high significance and reflecting a high cultural industry development level out of a high degree of specialization of culture industry; moreover, the regions with a high urbanization level may attract more cultural industry enterprises and provide the foundation for cultural industry development. The average scale variable of cultural enterprisecs
has a slight influence on the cultural industry development, because that the 业cultural enterprises in various religions have a small scale with non-significantscale economy; the national policy variable has the 30.5% interpretation authority for the regional difference in
cultural industry development and
cpg
promotes the cultural industry development significantly, butcps
has nosignificant influence on the cultural industry development.
fs
has more significant influence on the culturalindustry development when compared with that of
cpg
andcps
, that is to say the fiscal expenditure plays a positive role in cultural enterprise and cultural project and accelerating the restructuring and support for cultural institutions; it passes the significance test when the spatial autoregressive coefficient is at the level of 10%, reflecting that the cultural industry development in adjacent area with the similar production factor, agglomeration state and national policy has the spatial spillover effect which may drive the local cultural industry development and play a active role in reducing the regional culture difference and promoting the regional coordinated development; the data shows that the production factor, agglomeration state and national policy have more than 90% overall interpretation authority for the regional cultural industry and the cultural industry development in adjacent areas have the spatial spillover effect which shall be beneficial to reduction in regional culture difference and realization of culture industry.CONCLUSION
difference in regional cultural industry and the analysis of the three factors prior to obtaining the vector index and index quantification method consisting of the influence factors; secondly, the calculation method of Theil Index, spatial autocorrelation index Moran’s I theory and spatial econometric model establishment theory were illustrated, which provides the theoretical basis for analysis of spatial econometric of regional difference in culture industry; thirdly, the empirical analysis of the special and time difference in the China’s cultural industry economy was made by use of Theil Index, obtaining the overall difference in China’s regional cultural industry in 2008 and 2012 and the differences in between regions, in a region, in eastern regions, middle regions and western regions of and so on and the result of high development level in the eastern China and low development level in western China; fourthly, the analysis of the correlation was made for the geographic spatial distribution of the culture industry in 31 regions of China by use of Moran’s I index for obtaining the regional conditions and reasons and providing the solution to eliminating the difference in the industry economic development; at last, the analysis was made for the statistics of production factor, agglomeration state, national policy and spatial spillover characteristic of regional difference in economic development of China’s cultural industry in 2008 and 2012, by use of spatial autocorrelation test and spatial econometric model, for summary of the result of spatial spillover effect as time goes on and achievement of over 90% interpretation authority for the industrial regional difference out of the three influence factors extracted from the paper, which provides the theoretical basis for the quantitative analysis of the spatial characteristic of regional difference in economic development of China’s cultural industry and the recommendation for the healthy development of the industry.
REFERENCES
[1] Li Xu-ying. Journal of Shanghai Maritime University, 2006, 27(2), 70-74. [2] Yuan Hai and other people. Statistics and Decision, 2011, (10), 76-82. [3] Yuan Hai and other people. Statistics & Information Forum, 2011, (2).65-71. [4] Lei Hong-zhen and other people. Inquiry into Economic Issues, 2012, (2), 35-41. [5] Hu Jian and other people. Statistics & Information Forum, 2012, 27(1), 3-8. [6] Li Xing-jiang and other people. Statistics and Decision, 2013, (392), 124-128. [7]Xu Li-xin and other people. Journal of UEST of China, 2014, 16(1), 57-62. [8] Porter M. Harvard Business Review, 1990, 68(2).
[9]Chen Gang and other people. South China Journal of Economics, 2010, (10), 3-16.