Dynamic Estimation of Power System Stability in
Different Kalman Filter Implementations
H.H.Goh, C.W.Tai, Q.S.Chua, K.C.Goh K.T.K.Teo
S.W.Lee, B.C.Kok Department of Construction Management, Modelling, Simulation and Computing Department of Electrical Power Engineering, Faculty of Technology Management and Laboratory, Level 3, Block C, School of Faculty of Electrical and Electronic Engineering, Business, Universiti Tun Hussein Onn Engineering and Information Technology,
Universiti Tun Hussein Onn Malaysia, Malaysia,86400 Parit Raja, Batu Pahat, Johor, Jalan UMS, Universiti Malaysia Sabah,88400 86400 Parit Raja, Batu Pahat, Johor, Malaysia Malaysia. Kota Kinabalu, Sabah, Malaysia.
[email protected] [email protected] ktkt'[email protected]
Abstract-Voltage collapse is still the biggest threat to the transmission system. There are many approaches that have been explored to predict the point of voltage collapse. However, it is still lacking of information that related to current system state. With the advancement of Phasor Measurement Units (PMUs) technology, it provides an alternate pathway to improve the existing power system state estimation. Hence, it was of interest to develop better methods that could give a preliminary warning before the voltage collapse. This paper concerns for the development of real-time system monitoring methods to give a timely warning in the power system. The algorithm to predict the points of collapse is based on the assumption that voltage instability is closely related to the maximum load ability of a transmission network. Therefore, the Thevenin impedance is equalled to the apparent load impedance a t the points of collapse. Numerous methods such as Discrete Kalman Filter
(Dm), Extended Kalman Filter (EKF) and Unscented Kalman Filter (UKF) are being implemented into the real- time voltage instability predictor to track the Thevenin parameters. The test results are tested on Malaysia's power system 132 kV - 2-bus and 10-bus systems. The results are compared based on the early-warning index of voltage collapse. The results of DKF method are set as the reference for comparison purpose between EKF method and UKF method. The test results shown that EKF method provided better results by decreasing of 0.1169 p.u. for 2-bus system and 0.0338 p.u. for 10-bus system. In the meanwhile, UKF method provided increasing values of 0.4262 p.u. for 2-bus system and 0.1522 p.u. for 10-bus system. The overall purpose of this research is to develop methods that in provide early warning for an emerging stability problem. In order to achieving the research's objectives, derivation of the index for early warning of the point of collapse is completed. The performance of each method used throughout this research is based on the analyzed results for the points of voltage collapse.
Index Terms-Kalman Filter, Point of Collapse, Real Time System Monitoring, Thevenin Parameters
I. INTRODUCTION
With the growing of demand in power system, voltage instability problem has become a challenge to power system operator. Load growth without a corresponding increase of transmission capacity has brought many power systems closer to their voltage stability boundaries, which leads to voltage instability problems increase. Moreover, the stable system contributes to reliability and reduction in system loss. Hence the voltage instability problem has received a lot of attention not only from researchers but also from the industry. Thus, a continuous real-time
voltage margin monitoring system is required to predict the distance from the point of voltage collapse.
The Malaysia power system is equipped with Phasor Measurement Units (PMUs). The implementation of the PMU technology in real power systems is under the process currently. By refqrring to the announcement on the increase of electricity tariff as in [I], the continually increasing in load demand and fuel cost leads to urgent needs to improve operational efficiency's utilization of transmission and distribution assets and reduction of losses. Therefore, Tenaga Nasional Berhad-Transmission (TNB-T) and TNB-Research (TNB-R) have joint collaboration in a 5-years research and development project on Wide-Area Intelligent Systems (WAIS) to enhance security and reliability of the power system network, and hence to provide system operators with real- time information on proximity of the system to voltage collapse as stated in [2].
The existing transmission lines have been equipped with the protection and countermeasure systems to prevent from a collapse. Hence, the actual data from the applied PMUs will never find any collapse in the system. Therefore, fault occurrence or tripping on the bus will be created in the simulation by using Real-Time Digital Simulator (RTDS). The PMUs simulated data obtained from TNB-R are in the form of voltage and current, which refer to its magnitude and angle. For the time being, TNB- R is using the latest PMUs technology that able to measure 50 samples per second. The experimental performance of simulation was conducted at TNB-R with the 132 kV system with 2-bus and 10-bus systems. The limitation of this project is due to the communication channels at some TNB substations of interest are not fully configured, thus the measurements based on actual data
-
-streams are still impossible at the moment. Therefore, the results shown are based on input from simulations.
This paper will address the overviews of voltage stability in the next section. Third section will include the development of methodology and technique used in this research. The fourth section will show the results and discussion. The conclusion is shown in the last section.
defied when the power system at a given operating state is subjected to a given disturbance undergoes the voltage collapse if post-disturbance equilibrium voltages are below acceptable limits. Besides, voltage instability is the lack of voltage stability and results in progressive voltage decrease (or increase) as defined in [3].
Basically, stability can be classified into three principal issues, which are thermal, voltage and transient. The main cause of voltage stability issue is electrical distance between generations and loads and also depends upon the topology of the network. Whenever a power system affected by disturbances, it can enter a state of voltage instability after a progressive and uncontrollable drop in the voltage as in [4].
There are 3 keys associated with voltage stability. First is the reactive power support either through power transfer, or at loading point. The second is the load characteristics as seen from the bulk power network. The last is the available means for voltage control at generators and in the network as in [5].
According to theory, the magnitude of Thevenin impedance is equal at the apparent load impedance to the voltage reaches the maximum transfer point. The Voltage Instability Predictor (VIP) method is based upon the assumption that voltage instability is closely related to the maximum load ability of a transmission network as proven in [6]. A load bus and the rest of the system treated as a Thevenin equivalent is shown in Fig. 1.
t. - - - -
[image:2.545.50.241.375.490.2]~Ihevenin equivalent
Fig. 1. Local bus and the rest of the system treated as a Thevenin equivalent [5]
The apparent impedance is merely the ratio
apP
between the voltage and current phasors measured at the bus. Tracking the Thevenin equivalent is essential in the detection of voltage collapse.
There are many methods to track the Thevenin parameters. The tracking is based on Eq. 1 as in [5, 7-10].
Denoted that:
Rewritten the above equations into a Cartesian coordinate as shown in Eq.2:
The subscripts r and i indicated the real and the imaginary part of phasors. Note that V and I are directly available from the measurements at the local bus. The unknowns are
R
t h ,X
rh,
E
andE
,. In Eq. 2, there are
two equations, and four unknowns, so clearly, measurements taken at two or more different times are required to solve for the unknowns. In the real environment, measurements are not precise and the Thevenin parameters drift due to the system's changing conditions. In order to suppress oscillations, a larger data window needs to be used. Therefore, the estimation attempts to minimize the error in a least-square sense.111. RESEARCH METHODOLOGY
The investigation will be performed in one of the TNB load areas to examine the effectivfeness of the voltage stability margin. The 132 kV network (for 2-bus system and 10-bus system) of the area under investigation, where the incoming 275 kV supply is taken from Bus 1 and stepped down to 132 kV by two units of 180 MVA transformers, which are connected to Bus 1 and Bus 2. All buses in this area are considered as the load bus. Load bus can be defined as transmission line feeding a certain load. The analysis is based on the collected information fiom TNB-R. The collected data fiom 132kV network studied and analysed according to the performance of stability. Total load in the area is about 85 MVA, and the power flows to the load centres. PMUs are installed to monitor voltage and current phasors at Bus 1 to Bus 10.
Fig. 2. Detail of TNB 132 kV load under investigation
The TNB 132 kV load area under investigation for 2- bus and 10-bus systems is shown in Fig.2. The PMUs data provided by the TNB-R for 2-bus system has a total number of 32973 data points while for the 10-bus system has a total number of 2000 data points, and both systems . consist the same step size of 0.02 sec which means that 50 samples per second of the collected data are provided from PMUs.
[image:2.545.292.511.489.623.2]and the Unscented Kalman Filter (UKF) are being implemented to track the Thevenin equivalent parameters. The results from these three methods will be analyzed and compared. The Kalman Filter is a set of mathematical equations that provides an efficient computational means to estimate the state as a process, in a way that minimizes the mean of the squared error. The filter is very powerful in several aspects which it supports estimations of past, present and also future states, and it can do so even when the precise nature of the modelled system is unknown. The Kalman Filter addresses the general problem of trying to estimate the state of a discrete-time controlled process that is governed by a linear stochastic difference equation. Due to the Kalman Filter is more appropriate for the applications in a linear system. Hence, a Kalman Filter that linearized about the current mean and covariance are referred to as an EKF. The EKF has become a standard technique used in a number of nonlinear estimation and machine learning applications. These include estimating the state of a nonlinear dynamic system, estimating parameters for nonlinear system identification, and also dual estimation that both states and parameters are estimated simultaneously. However, the EKF can sometimes introduce large errors in the true posterior mean and covariance of the transformed Gaussian random variable which lead to sub-optimal performance and sometimes divergence of the filter. The UKF addresses this problem by using a deterministic sampling approach. The UKF is an extension of the Kalman filter for nonlinear systems that a set of weighted sigma points are used to simulate the distribution within the state random variable. The performance of the filter depends heavily on the selection of sigma points, and the computational cost is proportional to the number of sigma points used.
A. Discrete Kalman Filter (DKF)
The DKF estimates a process by using a form of feedback control. The filter estimates the process state at some time and then obtains feedback in the form of noisy measurements. As such, the equations for the Kalman Filter contain two groups, which are the time update equations and the measurement update equations. A complete picture of the operation of DKF is shown in Fig.3.
The time updated equations are responsible for projecting forward the current state and error covariance estimates to obtain a-priori estimates for the next time step. The measurement updated equations are responsible for the feedback which incorporating a new measurement into the a-priori estimates to obtain an improved a posterior estimate. The time update is actually the prediction stage of the Kalrnan Filter while the measurements update represented the correction stage. Indeed, the final estimation algorithm resembles that of a predictor-corrector algorithm for solving numerical problems as in [ I l l .
Time Update: 1 Project the state ahead.
= A.G1
+
Bu,-,2 Project the m o r covariance ahead. PC = Ap+-.ar
+
q3Ieasurement Update: 1 Compute rhe Kalman g i n
K, = P,-H~(HP;H~+R:-~
? Zpdate eslinlab rneamrement,z2 f
-
- y-+
Kk[zg - H&) 3. Cpdate the error covariance5 = [I
-
KkH]P,-Fig. 3. A complete picture of the operation of the DKF
B. Extended Kalman Filter (EKF)
The EKF can linearize the estimation around the current estimate using the partial derivatives of the process and measurement functions to compute estimates even in the face of non-linear relationship. As with the basis discrete Kalman Filter, the measurement updates equations correct the state and covariance estimates for the measurement, k . An important feature of the EKF is
that the Jacobian,
H
in the equation for the Kalmangain,
K t
serves to correctly propagate only the relevantcomponent of the measurement information as in [ l l ] . The complete picture of the operation of EKF is shown in Fig.4.
Time ratlate:
1 Prgectthe state a h a d
P;; = f [Ck-,, a,-i, 0)
2 Projectthe cnor corarime ahead
P,- = A?,-:A:
+
117,~~-~11~;lIeasurement Update: 1 Compute the Kalman gain
K , = P;H;(HP,-H;+ II~R~I~:)-' 2 L-pdak estinnte ~viitk measurement_2,
a^:, = c,-
+
K , ( z ~ - h(.?;,O))3 Update the enor COT ariance 9 = (i - K,H)P;
Fig. 4. A complete picture of the operation of the EKF
C. Unscented Kalman Filter (UKF)
The U I G is founded on the intuition that it is easier to approximate a probability distribution that it is to approximate an arbitrary non-linear function or transformation and the complete operation is shown in Fig.5. The sigma points are chosen so that their mean and
covariance to be exactly
xu
,-,
andPk-,
. Each sigma
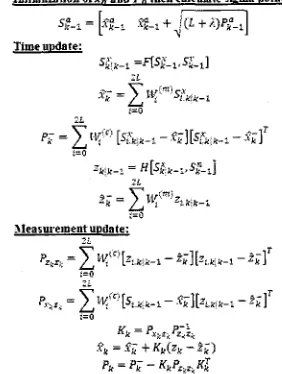
[image:3.534.291.440.43.167.2] [image:3.534.272.497.246.492.2]Initialfationof8 and P, thencalculak sigma wink:
st-: = [,?$-:
+;XI
Time uudate:
[image:4.540.271.508.38.479.2]s;,_, =flsr i - 1 ,sr %I ]
Fig. 5. A complete picture of the operation of the UKF
D. Index to monitor the condition of the system
By having the estimated Thevenin impedance value, the minimum magnitude of the load impedance in a stable system can be defined. Hence, the early warning index can be defmed in (3) to monitor the condition on the
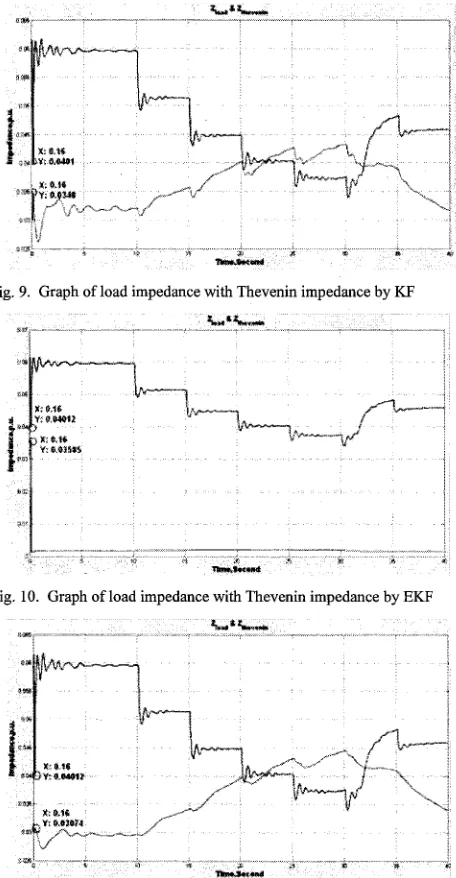
power system. Fig. 7. Graph of load impedance with Thevenin impedance by EKF
IzJ- IzJ
Index
im,d,,, =Iz,I
More power will be drawn whenever the load impedance started to drop. By this, the early warning index also decreases indicating that the system is an edge near to the nose point of voltage collapse. The index definitely becomes zero when the system is operating from the nose point. The main perception is to ensure the index always stay positive and suitable early prevention should be implemented when the index is close to zero
r i 21
L L d J .
Fig. 8. Graph of load impedance with Thevenin impedance by UKF
IV. RESULTS AND DISCUSSION
A. Results and Analysis
According to the given data, the set of data in Zbus system shows an abnormal phenomenon at time 634.1 seconds; therefore, a prediction that the point of voltage collapse might happen at time 634.1 seconds. The results from the three methods which are DKF, EKF and UKF are shown in Fig.6, Fig.7 and Fig.8 respectively. The results have also proven that the point of voltage collapse for the two buses system is happened at time of 634.1 seconds. According to the theory, the point of collapse occurs whenever the Thevenin impedance is equal to the load impedance for the power system network.
[image:4.540.41.182.47.234.2]Fig. 9. Graph of load impedance with Thevenin impedance by KF
Fig. 11. Graph of load impedance with Thevenin impedance by UKF
The indices of the early warning for point of voltage collapse are calculated based on the estimated Thevenin impedance by using different Kalman filtering implementations is shown in Table 1. By comparing the values of index, it is very obvious that the result for the EKF is much more accurate because of its value for the index is closer to zero. Thus, we concluded that the EKF algorithm performs better in tracking the points of
Types of Method
Discrete Kalman
Filter Algorithm
(Dm)
Extended Kalman
Filter Algorithm
Unscented KalmqFilter Algorithm (UKF)
collapse in the 2-bus and 10-bus systems and then follows by the KF algorithm and lastly, the UKF algorithm.
B. Discussion
Index for Early Warning
The overall discussion is based on the performance of three different types of Kalman's filter methods for tracking the Thevenin parameters. In the way of only looking at its performance to trace the points of voltage collapse, which basically only refer to its Thevenin impedance and load impedance, the EIG performs the best among them. However, the results of estimating the Thevenin voltage hom EKF are divaricated. This phenomenon may due to the large error in the true posterior mean and covariance. As the EKF is suitable for non-linear system, and we presented the Thevenin parameters in its rectangular form in order to meet the non-linear requirement.
The radial equivalent independent (REI) network equations in this research are basically a linear system, but it can also present in the non-linear state. Therefore, both KF and EKF can also be used to track the Thevenin parameters. If comparing the results of the KF with the EKF, the overall performance is better in the KF algorithm. Although the EKF able to trace the more accurate point of voltage collapse but its Thevenin voltages are divaricated and are invalid for analysis purpose. The performance of EKF for its Thevenin voltage can actually be addressed by using the UKF. The overall performance of the UKF in this research can be considered as moderate and it does perform better than the EKF in the Thevenin voltage prediction. However, the UKF is slightly more complex in its level of complexity. It is more suitable for highly non-linear system, which involves higher level of order in the state vector.
All the three Kalman filter methods that been used for this research can also be considered as appropriate for the system. Preferable suggestion that KF algorithm is more suitable to apply in our system because it is simpler and its process times are faster. The EKF can be used as a secondary method which able to back up in tracking the points of voltage collapse. While the UKF is not that suitable for this case, but it was recommended to apply in other non-linear system because its performance is quite high in accuracy.
2-bus system
0.2182
0.1013
0.6444
V. CONCLUSIONS
The overall purpose of this research was to develop methods that in real-time provide an early warning for an emerging stability problem. It was interest to develop on methods of tracking the points of voltage collapse of the electric power system, and then give an early warning for the emerging blackout or voltage collapse. In order to achieving the research's objectives, derivation of the index for early warning of the point of collapse is completed. There are three methods, which have been employed for this online estimation of the model parameters which are the KF, EKF and UKF. Comparisons of the results and performance from all of these methods have also been made in section IV. As a conclusion, the presented methods fulfill the requirements. This means that a 10-bus system
0.1529
0.1191
development of the high accuracy for PMUs measurements could be achieved. The results make the presented assessment method an attractive tool for real- time stability assessment in future prevention of voltage collapse.
ACKNOWLEDGMENT
The authors gratefully acknowledge the contributions of TNE3 Research and TNE3 Transmission members for their valuable comments, support and technical cooperation during the process of collecting the PMUs data and also the development works. The authors would like to thank the Malaysia Technical Universities, Research and Innovation Centre, UTHM for financially supporting this research under the Malaysia Technical Universities Network - Centre of Excellence (MTUN- COE) Vot.No. C025 and Fundamental Research Grant Scheme - Ministry of Green Technology, Energy and
Water (FRGS-KeTTHA) Vot.No.0905.
REFERENCES
TNB. (5 May,2011). Announcement on the Increase in Electricity Tariff in Peninsular Malaysia Due to the Revision of Nature Gas Price, Revision of Base Tariff &
Implementation ofFeed-In-Tarzff (FiT) for Renewable Energy (RE).
M. K. N. M. Sarmin, et al., "Real-Time Voltage Stability Monitoring for TNB Network," in Power and Energy Systems, 2012.
P. Kundur, et al., "Definition and classification of power system stability IEEEICIGRE joint task force on stability terms and definitions," Power Systems, IEEE Transactions on, vol. 19, pp. 1387-1401,2004.
P.Kundur, Power System Stability and Control. New York: McGraw-Hill, 1994.
L. Warland and A. T. Holen, "A voltage instability predictor using local area measurements (VIP*)," in Power Tech Proceedings, 2001 IEEE Porto, 2001, p. 6 pp. vo1.2. C. W. Taylor, Power system voltage stability: McGraw-Hill, 1994.
T. An, et al., "Research on illed-conditioned equations in tracking thevenin equivalent parameters with local measurements," in Power System Technology, 2006. PowerCon 2006. International Conference on, 2006, pp. 1-4. K. Vu, et al., "Use of local measurements to estimate voltage- stability margin," Power Systems, IEEE Transactions on, vol. 14, pp. 1029-1035, 1999.
K. T. Vu, et al., "Applications and methods for voltage instability predictor (VIF')," 2001.
S. S. Tsai and W. Kim-Hoi, "Adaptive undervoltage load shedding relay design using Thevenin equivalent estimation," in Power and Energy Society General Meeting - Conversion and Delivery of Electrical Energy in the 21st Century, 2008 IEEE, 2008, pp. 1-8.
G. Welch and G. Bishop, "An introduction to the Kalman filter," ed, 1995.