International Journal of Emerging Technology and Advanced Engineering
Website: www.ijetae.com (ISSN 2250-2459, Volume 1, Issue 2, December 2011)127
Proposed Water filling Model in a MIMO system
Kuldeep Kumar
1, Manwinder Singh
21Student, Rayat Institute of Engineering and Information Technology, Railmajra, Punjab, India. 2 Sr. Lecturer (Sel. Grade), ECE Faculty, RIEIT Railmajra, Punjab, India.
1
[email protected] 2[email protected]
Abstract— In the paper we have discussed the proposed water filling algorithm which has been used for allocating the power to the MIMO channels so as to enhance the capacity of the MIMO network. Here we present a theoretical framework for allocating the power here we have considered a 4x4 MIMO system the system is assumed to be MIMO-OFDM and the channel is assumed to be Flat as under this the convolution integral becomes a simple multiplication operator. Here is this paper we study the comparison of successive water filling algorithm with the proposed water filling algorithm with the change in the power budget. It can be observed from the graphs that the efficiency of the system is enhanced with the proposed water filling algorithm and also it is observed that the outage probability is reduced as compared to the outage observed in the successive water filling algorithms. It is further seen that there is enhancement in the capacity of a MIMO system.
Keywords— Multi Input Multi Output (MIMO), water filling, Capacity, outage probability, Signal to Noise Ratio (SNR), Power Budget.Orthogonal Frequency Division Multiplexing(OFDM)
I. INTRODUCTION
As it is known that Multiple-Input Multiple-Output (MIMO) systems are used to get higher data rate as compared to a normal SISO system where we keep the same power budget and SNR. A comparison of MIMO system with a SIMO reveals that the MIMO system need lesser transmit power than the SISO system in order to achieve the same capacity .As we need to minimize the energy consumed by the circuit and want to maximize the capacity of a system and that is possible only if we use multiple MIMO system.So a comparative analysis is done to find a system which is more energy efficient.A MIMO system that we consider here has 4 transmit and 4 receive antenna and the system and the fading here is assumed to be flat. The results here indicate that the capacity of the system increases with the increase in the number of transmit and receive antenna.
The capacity of a MIMO system can further be increased if we know the channel parameters both at the transmitter and at the receiver and assign extra power at the transmitter by allocating the power according to the water filling algorithms to all the channels.In the MIMO-OFDM system we use the proposed water filling algorithm and the results of this proposed algorithm are better as compared to the successive water filling algorithms. .Here we consider two type of water filling algorithms one is the successive water filling model and other is the proposed water filling model. The article is organized as follows. In section 2, discusses the Proposed water filling algorithm. Section 3, we conclude our discussion with the results.
II. PROPOSED WATER FILLING ALGORITHM
The process of waterfilling is similar to pouring the water in the vessel. The unshaded portion of the graph represents the inverse of the power gain of a specific channel.The portion representing the shadow represents the power allocated or the water .
shows the maximumwater level.
Figure.I: proposed Water Filling Model
International Journal of Emerging Technology and Advanced Engineering
Website: www.ijetae.com (ISSN 2250-2459, Volume 1, Issue 2, December 2011)128
Power allocated by the individual channel is given by the Eq. 1, as shown in the following formula
i n
i i
H
channels
H
Pt
ated
Poweralloc
1
1
1
(1)
Where Pt is the power budget of the MIMO system which is allocated amoung the different channels and H is the channel matrix of the systems. The Capacity of a MIMO system is algabric sum of the capacities of all channels and is given by the formula below.
ni
H
ated
PowerAlloc
Capacity
1
2
(
1
*
)
log
(2)we have to maximize the total number of bits to be transported , The results shows that the proposed water-filling power allocation scheme is. As per the scheme following steps are followed to carry out the proposed water filling algorithm.
Algorithm Steps :-
1. We do not need to Reorder the MIMO-OFDM sub channel gain realization in a descending order 2. Take the inverse of the channel gains.
3. Water filling has nonuniform step structure due to the inverse of the channel gain.
4. Initially take the sum of the Total Power Pt and the Inverse of the channel gain .It gives the complete area in the waterfilling and inverse power gain.
(3)
5. Decide the initial water level by the formula given below by taking the average power allocated (average water Level)
(4)
6. The power values of each subchannel are calculated by subtracting the inverse channel gain of each channel .
(5)
7. In case the Power allocated value becomes negative stop the iteration process.
Figure I shows the mean capacity of a MIMO system increases with the increase in the power budget at the input of the transmitter. Following figures are the result that we get for the capacity of a 4X4 MIMO system by varying the power budget.
-10 -5 0 5 10 15 20 25 30 0
5 10 15 20 25 30 35 40
Mean Capacity vs SNR
SNR (dB) --->
M
e
a
n
C
a
p
a
c
it
y
b
p
s
--->
[image:2.612.324.555.354.555.2]4x4 MIMO at Pt=0.2 4x4WF MIMO at Pt=0.2 4x4 Proposed WF MIMO at Pt=0.2
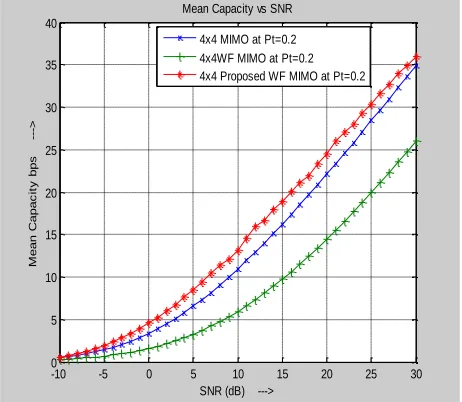
Figure II: Mean Capacity At Pt=0.2 With Proposed Water Filling Algorithm
Figure II shows the mean capacity of the system when the power budget Pt 0.2. It is observed that the proposed water filling algorithm has 2-3bps improvement as compared to the system when no water filling is done at 20db SNR and approximate 10bps improvement in capacity at 20db SNR as compared to the successive water filling algorithm.
ni
H
iPt
1
1
channels
H
Pt
n
i 1 i
1
i n
i i
H
channels
H
Pt
ated
Poweralloc
1
1
1
International Journal of Emerging Technology and Advanced Engineering
Website: www.ijetae.com (ISSN 2250-2459, Volume 1, Issue 2, December 2011)129
-10 -5 0 5 10 15 20 25 30 0
5 10 15 20 25 30 35 40
Mean Capacity vs SNR
SNR (dB) --->
M
e
a
n
C
a
p
a
c
it
y
b
p
s
--->
[image:3.612.59.283.142.343.2]4x4 MIMO at Pt=0.5 4x4WF MIMO at Pt=0.5 4x4 Proposed WF MIMO at Pt=0.5
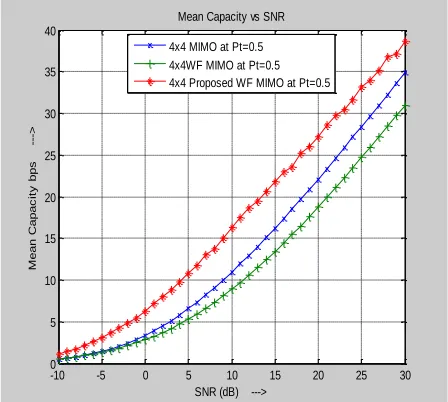
Figure III: Mean Capacity At Pt=0.5 With Proposed Water Filling Algorithm
Figure III shows the mean capacity of the system when the power budget Pt 0.5. It is observed that the proposed
water filling algorithm has 4-5bps improvement as compared to the system when no water filling is done at
20db SNR and approximate 8-9 bps improvement in capacity at 20db SNR as compared to the successive
water filling algorithm.
-10 -5 0 5 10 15 20 25 30
0 5 10 15 20 25 30 35 40 45
Mean Capacity vs SNR
SNR (dB) --->
M
e
a
n
C
a
p
a
c
it
y
b
p
s
--->
4x4 MIMO at Pt=1.0 4x4WF MIMO at Pt=1.0 4x4 Proposed WF MIMO at Pt=1.0
Figure IV : Mean Capacity At Pt=1.0 With Proposed Water Filling Algorithm
Figure IV shows the mean capacity of the system when the power budget Pt 1.0. It is observed that the proposed water filling algorithm has 6-7 bps improvement at 20db SNR as compared to the system when no water filling is and successive water filling algorithm.
-10 -5 0 5 10 15 20 25 30
0 5 10 15 20 25 30 35 40 45
Mean Capacity vs SNR
SNR (dB) --->
M
e
a
n
C
a
p
a
c
it
y
b
p
s
--->
[image:3.612.322.530.211.388.2]4x4 MIMO at Pt=2.0 4x4WF MIMO at Pt=2.0 4x4 Proposed WF MIMO at Pt=2.0
Figure V: Mean Capacity At Pt=2.0 With Proposed Water Filling Algorithm
The figure V shows the mean capacity of the system when the power budget Pt 2 with and without the water filling model
-10 -5 0 5 10 15 20 25 30
0 5 10 15 20 25 30 35 40 45
Mean Capacity vs SNR
SNR (dB) --->
M
e
a
n
C
a
p
a
c
it
y
b
p
s
--->
4x4 MIMO at Pt=5.0 4x4WF MIMO at Pt=5.0 4x4 Proposed WF MIMO at Pt=5.0
[image:3.612.55.270.480.668.2] [image:3.612.323.534.482.665.2]International Journal of Emerging Technology and Advanced Engineering
Website: www.ijetae.com (ISSN 2250-2459, Volume 1, Issue 2, December 2011)130
Figure VI shows the mean capacity of the system when the power budget Pt 5.0. It is observed that the proposed water filling algorithm has 12-13bps improvement as compared to the system when no water filling is done at 20db SNR and approximate 2-3bps improvement in capacity at 20db SNR as compared to the successive water filling algorithm.
-10 -5 0 5 10 15 20 25 30 0
5 10 15 20 25 30 35 40 45
Mean Capacity vs SNR
SNR (dB)---->
M
e
a
n
C
a
p
a
c
it
y
b
p
s
-
--->
[image:4.612.324.525.143.352.2]4x4 Proposed WF MIMO at Pt=0.2 4x4 Proposed WF MIMO at Pt=0.3 4x4 Proposed WF MIMO at Pt=0.4 4x4 Proposed WF MIMO at Pt=0.5 4x4 Proposed WF MIMO at Pt=1.0
Figure Vii: Mean Capacity At Different Pt With Proposed
Water Filling Algorithm
Figure VII shows the mean capacity of a 4x4 MIMO system for all the water filling. It is observed from the figures that with power budget is increased the capacity of the system also increases.
The outage probability for a MIMO system is given by
HH
N
SNR
I
P
outage
P
t r
r
(
)
log
2det(
(6)Where H is the called the channel matrix, and I is the information that is transmitted,
N
t the transmit antennasand
H
(
H
*
H
)
1H
*.2 4 6 8 10 12 14 16 18 20 0
0.1 0.2 0.3 0.4 0.5 0.6 0.7 0.8 0.9 1
Outage Probablity vs SNR
SNR (db) --->
O
u
ta
g
e
P
ro
b
a
b
li
ty
--->
1x1 SISO at Pt=0.2 1x4 SIMO at Pt=0.2 4x1 MISO at Pt=0.2 4x4 MIMO at Pt=0.2 4x4WF MIMO at Pt=0.2 4x4 Proposed WF MIMO at Pt=0.2
Figure VIII: Outage Probability Of Mimo System At Pt=0.2
The Figure VIII shows the outage probability of a SISO,SIMO, MISO, MIMO system with SNR at Pt=0.2.
2 4 6 8 10 12 14 16 18 20 0
0.1 0.2 0.3 0.4 0.5 0.6 0.7 0.8 0.9 1
Outage Probablity vs SNR
SNR (db) --->
O
u
ta
g
e
P
ro
b
a
b
li
ty
--->
[image:4.612.55.280.233.448.2]1x1 SISO at Pt=0.3 1x4 SIMO at Pt=0.3 4x1 MISO at Pt=0.3 4x4 MIMO at Pt=0.3 4x4WF MIMO at Pt=0.3 4x4 Proposed WF MIMO at Pt=0.3
Figure IX: Outage Probability Of Mimo System At Pt=0.3
[image:4.612.323.540.426.629.2]International Journal of Emerging Technology and Advanced Engineering
Website: www.ijetae.com (ISSN 2250-2459, Volume 1, Issue 2, December 2011)131
2 4 6 8 10 12 14 16 18 20
0 0.1 0.2 0.3 0.4 0.5 0.6 0.7 0.8 0.9 1
Outage Probablity vs SNR
SNR (db) --->
O
u
ta
g
e
P
ro
b
a
b
li
ty
--->
[image:5.612.55.277.142.322.2]1x1 SISO at Pt=0.4 1x4 SIMO at Pt=0.4 4x1 MISO at Pt=0.4 4x4 MIMO at Pt=0.4 4x4WF MIMO at Pt=0.4 4x4 Proposed WF MIMO at Pt=0.4
Figure X : Outage Probability Of Mimo System At Pt=0.4
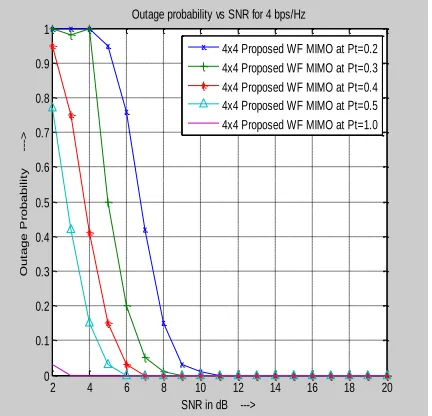
[image:5.612.56.272.414.622.2]The Figure X shows the outage probability of a SISO,SIMO, MISO, MIMO system with SNR at Pt=0.4. Figure 11 shows the outage probability at different power budgets.
2 4 6 8 10 12 14 16 18 20 0
0.1 0.2 0.3 0.4 0.5 0.6 0.7 0.8 0.9 1
Outage probability vs SNR for 4 bps/Hz
SNR in dB --->
O
u
ta
g
e
P
ro
b
a
b
il
it
y
--->
4x4 Proposed WF MIMO at Pt=0.2 4x4 Proposed WF MIMO at Pt=0.3 4x4 Proposed WF MIMO at Pt=0.4 4x4 Proposed WF MIMO at Pt=0.5 4x4 Proposed WF MIMO at Pt=1.0
Figure XI : Outage Probability At Different Pt With
Proposed Water Filling Algorithm
III. CONCLUSION
This paper we have developed an understanding and described the Mean capacity allocation in a wireless cellular network based on the proposed water filling power allocation in order to enhance the capacity of a MIMO systems with different channel assumptions. Here each transmitter decide the distribution of power to the several independent fading channels. We observed Maximum power is allocated to the channel having greater gain. In case of successive power allocation the number of iterations is more here in proposed water filling Algorithm the number of iterations are less. Initial level of the power allocated is close to the ideal value so the results of proposed algorithm are better. In case of equal power allocation power is distributed equally among all the sub channels but experience degradation in performance due to the bad channels having low value of SNR. In successive WF the maximum gain can be achieved if step size is close to Zero (very small) but then the iterations would be infinite and time taken to allocate the power would be large.Results indicates that the proposed water-filling scheme has better capacity than successive water filling at greater value of power budget. We also discussed the variation of the outage probability of the system.
Refrences
[1] J. H. Reed, Software radio: a modern approach to radio engineering: Prentice Hall, 2001.
[2] A. Paulraj, R. Nabar, and D. Gore, Introduction to Space-Time Wireless Communications, preprint, Cambridge University Press, Cambridge, UK, 2003.
[3] S. Ariyavisitakul and C. Li Fung, "Signal and interference statistics of a CDMA system with feedback power control," IEEE Transactions on Communications, vol. 41, pp. 1626-1634, 1993.
[4] J. S. Evans and D. Everitt, "Effective bandwidth-based admission control for multiservice CDMA cellular networks" IEEE Transactions on Vehicular Technology, vol. 48, pp. 36-46, 1999.
[5] Lisa Meilhac, Alain Chiodini, Clement Boudesocque, Chrislin Lele and Anil Gercekci (2000), ―MIMO-OFDM modem for WLAN‖, March 2000.
[6] Leus, G., Zhou, S. and Giannakis, G. B. (2003), ―Orthogonal multiple access over time- and frequency-selective channels‖, IEEE Transactions on Information Theory, Volume 49, No. 8, Pages. 1942–1950, 2003.
International Journal of Emerging Technology and Advanced Engineering
Website: www.ijetae.com (ISSN 2250-2459, Volume 1, Issue 2, December 2011)132 [8] Zhang, J., Chen, R., Andrews, J. G., Ghosh, A. and Heath, R.W.
(2009),― Networked MIMO with clustered linear precoding‖,
IEEE Transactions on Wireless Communications, Volume 8, No. 4, Pages 1910-1921, March 2009
[9] Dai, H., Molisch, A. F. and Poor, H. V. (2004), ―Downlink capacity of interference-limited MIMO systems with joint detection‖, IEEE Transactions on Wireless Communications, Volume 3, No. 2, Pages 442-453, 2004
[10] Foschini, G. J. and Gans, M. J. (1998), ―On limits of wireless communications in a fading environment when using multiple antennas‖, Wireless Pers. Communications, Volume 6, Issue 3, Pages 311-335, March 1998.
[11] Gesbert, D. , Sha, M., Shiu, D. S. , Smith, P. J. and Naguib, A. (2003), ―From theory to practice: An overview of MIMO space-time coded wireless systems‖, IEEE journal on selected area of communications, Volume 21, No. 3, Pages 281-302, April 2003.
[12] Keller, T. and Hanzo, L. (2000), ―Adaptive multicarrier modulation: A convenient framework for time frequency processing in wireless communications‖, Proceedings of the IEEE, Volume. 88, Pages 611-640, May 2000.
[13] Shiping Duan, Youyun Xu and Wentao Song (2003), ―Power allocation for MIMO-OFDM Systems with Multi-user Decoupling and Scheduling‖, IEEE International Symposium on Personal, Indoor and Mobile Radio Communications PIMRC , Volume 1, Pages 911-915, 2003.
[14] Jang, Y.J. and Letaief, K.B. (2005), ―An efficient resource-allocation Scheme for spatial multiuser access in MIMO/OFDM systems‖, IEEE Transactions on Information Theory, Volume 53, Issue 1, Pages 107-116, January 2005.
[15] Ying-Chang Liang, Rui Zhang, and Cioffi, J.M. (2003), ―Sub-channel grouping and statistical water-filling for MIMO-OFDM systems‖, Proceedings of Signals, Systems and Computers, 2003.
[18] B. Hashem and E. S. Sousa, "Reverse link capacity and interference statistics of a fixed-step power-controlled DS/CDMA system under slow multipath fading," IEEE Transactions on Communications, vol. 47, pp. 1905-1912, 1999.
[19] B. Hassibi and B. M. Hochwald. ―How much training is needed in multiple-antenna wireless links‖ IEEE Transactions on Information Theory, 48(4):951 – 963, April 2003.
[20] A. Paulraj, R. Nabar, and D. Gore, ―Introduction to Space-Time Wireless Communications” preprint, Cambridge University Press, Cambridge, UK, 2003.