The Effects of Video Tutorial Screencast SketchUp
Make (VTS-SUM) in Learning 3D Geometry for
Low Achievers
Faridah Hanim Yahya1,*, Rohani Abdul Wahab2, Noor Azean Atan3, Abu Bakar Ibrahim4
1
Faculty of Human Development, Universiti Pendidikan Sultan Idris, Malaysia
2
Kota Tinggi Science Secondary School, Malaysia
3
Faculty of Education, Universiti Teknologi Malaysia, Malaysia
4
Faculty of Art, Computing & Creative Industry, Universiti Pendidikan Sultan Idris, Malaysia
Received June 28, 2019; Revised September 5, 2019; Accepted September 12, 2019
Copyright©2019 by authors, all rights reserved. Authors agree that this article remains permanently open access under the terms of the Creative Commons Attribution License 4.0 International License
Abstract Problems in learning 3D geometry are
related to students’ spatial abilities that require them to create mental images representatives of the objects. Studies had shown that 3D software should be incorporated into teaching in order to assist students in visualizing. However, students often exhibit difficulties when using it as they are not familiar with tools and could not remember steps in completing a task. The purpose of the study is to examine the effect of a learning strategy which uses video tutorial screencast SketchUp Make (VTS-SUM) for topic plan and elevation, in mathematics for upper secondary school in Malaysia. The videos were designed using ADDIE Model which integrated screencast technique with a 3D software (SketchUp Make). A total of 30 low achiever students from one secondary school were involved in this study. They watched the video tutorials and performed hands-on activities using the software to complete the tasks. This paper includes a report of a usability test which used a seven point Likert scale. The questionnaire consists of four constructs: usefulness, ease of use, ease of learning and satisfaction. The findings showed that all means were at high level and the highest mean was satisfaction. Furthermore, pre- and post-test were also administered to students. The results of the paired sample t-test revealed that, there were significant differences in the mean scores of pre- and post-test, before and after learning via VTS-SUM (t=-4.30; p<0.05). Thus, we can conclude that VTS-SUM can be a potential learning strategy that enhances students’ achievement in 3D geometry.Keywords Video Tutorial, Screencast, SketchUp
Make, 3D Geometry, VTS-SUM1. Introduction
Students’ performance in geometry is very alarming to educators. A report from Trend in Mathematics and Science Studies (TIMSS) showed that only 33% of Malaysian students answered correctly the geometry questions, 53% of the students mastered the cognitive domain of reasoning and 28% in the cognitive domain of reasoning [1]. The results indicate that students are having problems in learning geometry. Studies had shown that students who were struggling in learning geometry were also having low spatial abilities [2], [3], [4]. Spatial abilities include the capability to mentally represent and manipulate three-dimensional (3D) objects [5], [6]. Hence, mode of teaching that enhances spatial abilities should be implemented by teachers in class.
Teaching 3D topic is very challenging to teachers. According to [2], the teachers prefer to use 2D drawings and 3D models, but both teaching materials are considered ineffective while explaining 3D objects because they are inadequate to illustrate the 3D objects [7], [8]. Studies have proven that using manipulatives tools can enhance students’ spatial abilities [9], [10], [11]. Thus, 3D software should be utilized among students. However, teachers are having problem when using the software in teaching students with different levels of cognitive [8]. Meanwhile, students also have problems in using tools as they cannot remember all the steps of using the tools to complete the task given to them [12].
Problems that had been highlighted in this topic were students failed to correctly plot dashed lines (hidden sides) for Y-elevation and X-elevation and also their incapability to compare objects and orthogonal lines [14].
In Malaysia, most of the studies on Geometry, focused on students in elementary schools [15], lower secondary schools [16] and upper secondary schools [11]. Not much study in Malaysia related to geometry had been conducted for low achievers at upper secondary schools. Hence, the above discussion has prompted the researchers to study and identify the appropriate solutions which involve low achievers from upper secondary school. The objective of the study is to determine the effects of a learning strategy using VTS-SUM for topic plan and elevation in 3D geometry. The aim of this study is to examine students’ perception of using VTS-SUM and to investigate the effects of VTS-SUM on students’ achievement.
2. Background of the Study
2.1. Screencasting
[image:2.595.306.537.120.262.2]VTS-SUM was developed using ADDIE model for two learning objectives: the concept of orthogonal projection and the concept of plan and elevation are as shown in Table 1.
Table 1. VTS-SUM using ADDIE Model
Stages Attribute
Analyse
Learning Environment
Tools, time, expert
Learning Content
Content, Learning Objective
Behavioral Determination
Spatial abilities, level of geometrical
thinking
Identifying Learning Object
Learning Outcome
Design
Design Objective
Develop item
Select Learning Strategy
Develop
Develop Flow Cart
Develop VTS-SUM
Produce VTS-SUM
Implement Pilot Test
Evaluate Formative
Summative
VTS-SUM integrates screencast technique using a software (Camtasia Studio) with a 3D manipulative software (SketchUp Make). Screencast videos are known as ‘how-to’ video that support users to learn new tools for a new software [17], [18], [19]. Camtasia studio was chosen as it was the best-known screencasting software [20]. It
[image:2.595.311.528.420.513.2]Figure 1 are also known as interactive elements [20].
Figure 1. Callout using Wide Arrow in VTS-SUM
These effects aim to assist students to view all steps involved in completing the tasks [21]. Studies have shown that screencast videos could reduce learners’ cognitive load [25] and promote self-paced learning [13].
2.2. SketchUp Make
SketchUp Make is free 3D software which is widely used in teaching 3D Geometry [9], [10], [11]. Four main tools are highlighted in the videos to assist students in visualizing the objects as shown in Figure 2.
Figure 2. Four main tools embedded in VTS-SUM
The orbit tool is used to rotate the 3D object while the standard view tool is used to transform the 3D object to 2D orthogonal plane. Figure 3 and 4 show steps in using standard view tool to view the 3D object from top using VTS-SUM.
[image:2.595.61.289.443.683.2] [image:2.595.306.537.597.741.2]Figure 4. Top view of 3D object
The position camera tool is used to view the 3D object from certain angle as shown in Figure 5.
Figure 5. View of the angles in 3D object
The section cut is used for cutting the 3D object to see the hidden lines in the object. Figure 6, 7 and 8 show the steps in using section cut tool.
Figure 6. Section Plane icon in VTS-SUM
Figure 7. Position of selection plane on 3D object
Figure 8. Hidden lines in 3D object
The selection of tools in SketchUp Make could enhance students’ performance in mathematics [8], [23], [11], visual spatial skills [11], [24], [25], level of geometrical thinking [11],[24] and geometric skills [25].
3. Methodology
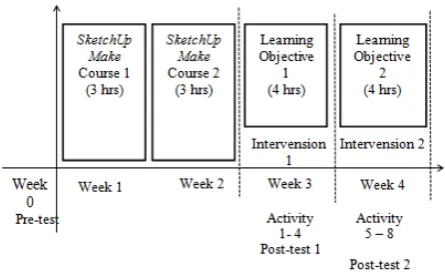
This study was conducted using the method of quantitative research which includes collection of quantitative. Onwards, this study was carried out for four weeks through a quasi-experimental design approach that involves single group with pre and post data collection.
[image:3.595.306.536.74.414.2] [image:3.595.60.291.79.217.2] [image:3.595.307.537.80.215.2] [image:3.595.61.288.265.441.2] [image:3.595.61.291.507.715.2]Figure 9. Design procedure for one group time series
This study naturally implemented quantitative method. The quantitative data were collected by using three tools; two tools were taken from the pre- and post-test and another tool was taken from the usability test. Questions for pre- and post-test were developed based on two learning objectives: drawing orthogonal projections and drawing plan and elevations for solid objects.
Meanwhile, usability is defined by the International Standards Organization's "Ergonomics of Human System Interaction Part 11: Guidance on Usability" [27] as the "extent to which a product can be used by specified users to achieve specified goals with effectiveness, efficiency and satisfaction in a specified context of use". In this study, the usability is defined as students’ acceptance of VTS-SUM. The test consists of four constructs: usefulness, ease of use, ease of learning and satisfaction. Usefulness is to determine if the students will find the video tutorial is useful to them and ease of learning is to examine whether the video tutorial is easy for the students to use in learning. Meanwhile ease of use is find out whether the video is easy to be used for students with different cognitive levels, whereas satisfaction is to test the students’ acceptance of the video. The questionnaire is referred to as USE (Usefulness, Satisfaction, Ease of Use and Ease of Learning), developed by [28].
4. Results and Discussion
Table 2 presents the descriptive statistics of the usability test. The findings revealed that the means of all of the constructs were high and the highest mean is ‘Satisfaction’. This implies that students had positive perception on VTS-SUM. This proves that screencast technique is capable to assist learners in learning new software [17].
Table 2. Usability test
Construct Mean Standard Deviation
Useful 6.03 0.53
Ease of Use 6.04 0.58
Ease of Learning 6.01 0.59
Satisfaction 6.09 0.51
[image:4.595.60.283.80.219.2]treatment. The results of the paired sample t-test revealed that, there were significant differences in the mean scores of pre- and post-test, before and after learning via VTS-SUM (t=-4.30; p<0.05). As shown in Table 3, the mean scores increased in the post-test. Therefore, the learning strategy using VTS-SUM had increased students’ achievement in topic plan and elevations. The findings are also supported by [23] that SketchUp Make could enhance learners’ performance in learning mathematics.
Table 3. Paired sample t-test results of pre- and post-test
Test N Mean SD df t p
Pre
30 5.88 1.72 29 -4.30 0.00
Post 7.48 1.61
5. Conclusions
This study investigated the effects of a learning strategy using VTS-SUM for topic plan and elevation in 3D geometry. The aims of this study are to examine students’ perception of using VTS-SUM and to investigate the effects of VTS-SUM on students’ achievement. The findings indicated that students had positive attitude towards this mode of teaching. Moreover, the findings also showed that the teaching strategy had increased students’ performance in topic plan and elevation. Thus, VTS-SUM can be recommended to teachers. Therefore, the Ministry of Education (MOE) should take initiative to conduct training to teachers on how to use VTS-SUM as learning objects for blended learning. Meanwhile, VTS-SUM can also be recommended to students as their supporting materials. Further studies may investigate the effectiveness of this learning strategy using control group and treatment group. We believe that the learning strategy using VTS-SUM can support students to develop the knowledge and skills required for Malaysian society.
Acknowledgement
This paper is based on work supported by Universiti Pendidikan Sultan Idris, Perak, Malaysia under University Research Grant 2017. The corresponding author had been appointed as the research leader.
REFERENCES
Mullis, Michael O. Martin, Pierre Foy, and Alka Arora. [1]
International Association for the evaluation of educational achiievment (IEA) IEA Secretariat Amterdam, the Netherlands, 2012.
Tosik Gün, E. & Atasoy, B. The Effects of Augmented [2]
Reality on Elementary School Students’ Spatial Ability and Academic Achievement, Education and Science,2017, vol 42, no 191, pp.31-51.
Martin-dorta, N., Sanchez-berriel, I., Bravo, M., Hernandez, [3]
J., Saorin, J. L., & Contero, M. Virtual Blocks : a serious game for spatial ability improvement on mobile devices, 2014, pp. 1575–1595. http://doi.org/10.1007/s11042-013-1 652-0.
Usiskin, Z. van Hiele levels and achievement in secondary [4]
school geometry. CDASSG Project. Illinois: University of Chicago, 1982.
Hegarty M, Waller DA. Individual differences in spatial [5]
abilities. In: Shah P, Miyake A, eds. The Cambridge Handbook of Visuospatial Thinking. New York, NY: Cambridge University Press,2005, pp. 121–69.
Khooshabeh P, Hegarty M. Inferring cross-sections: when [6]
internal visualisations are more important than properties of external visualisations. Hum-Comput Interact, 2003, vol 25, 119–47.
Battista, M. T., & Clements, D. H.. Students' understanding [7]
of three-dimensional rectangular arrays of cubes. Journal for Research in Mathematics Education, 1996, vol 23, no 7, pp. 258-292.
Turgut, M. & Urgan, C. Designing Spatial Visualisation [8]
Tasks for Middle School Students with a 3D Modelling Software: An Instrumental Approach. International Journal for Technology in Mathematics Education, 2015, vol 22, no 2, pp. 45-51.
Panorkou, N., & Pratt, D. Using Google SketchUp to [9]
Develop Students’ Experiencesof Dimension in Geometry. Digital Experiences in Mathematics Education, 2016, pp. 199–227. http://doi.org/10.1007/s40751-016-0021-9. Kwon, H. (2017). Effects of 3D Printing and Design [10]
Software on Students’ Overall Performance, (December), 37–43.
Wahab, R. A, Abdullah A. H., Abu, M. S., Atan, N. A., [11]
Mokhtar, M. and Hamzah, M. H. A learning 3D geometry through sketchupmake (SPPD-SUM) to enhance visual spatial skills and the level of geometric thinking. J. Fundam. Appl. Sci., 2018, vol 10, no 6S, pp. 1005-1039.
Hanafi, H.F., Said, C.S., Wahab, M.H., Samsuddin, K. [12]
Improving Students' Motivation in Learning ICT Course with the Use of A Mobile Augmented Reality Learning Environment. IOP Conference Series: Materials Science and Engineering, 2017, vol 226, no 1,pp. 012114.
Zhang, D., Peng, X., Yalvac, B., Eseryel, D., Nadeem, U., & [13]
Islam, A. Integrating student-made screencasts into computer-aided design education. Computer-Aided Design and Applications, 2017, vol 14,pp. 41–50. http://doi.org/10.1080/16864360.2017.1308080.
Malaysian Examinations Syndicate. Critique of quality of [14]
answers in the 2010 Malaysian certificate of education examination. Putrajaya: Kementerian Pelajaran Malaysia,
2010.
Tan T H.. Effects of van Hiele’s phases of learning and [15]
theory of geometry thinking on geometry learning of malaysian year five students, 2016,PhD thesis, Selangor: Universiti Putra Malaysia.
Abdullah, A. H. & Zakaria, E. Enhancing students' level of [16]
geometric thinking through van hiele's phase-based learning. Indian Journal of Science and Technology, 2013, vol 6, no 5, pp. 4432-4446.
Blake, M. R., & Morse, C. Keeping your options open A [17]
review of open source and free higher education, 2016, vol 44, no 3, pp. 375–389. http://doi.org/10.1108/RSR-05-201 6-0033.
Caruso, S. J. A Foundation For Understanding Knowledge [18]
Sharing: Organizational Culture, Informal Workplace Learning, Performance Support, And Knowledge Management, 2017, vol 10, no 1, pp. 45–53.
Stonebraker, I., Robertshaw, M. B., & Moss, J. D. Student [19]
See Versus Student Do : A Comparative Study of Two Online Tutorials, 2016, pp. 176–182. http://doi.org/10.100 7/s11528-016-0026-7.
Siegle, D. Differentiating Instruction by Flipping the [20]
Classroom, 2013, vol 37, no 1, pp.51–56. http://doi.org/10. 1177/1076217513497579.
Sadik, A. Students’ preferences for two types of video [21]
lectures: Lecture capture vs. screencasting recordings. Journal of Educational Multimedia and Hypermedia, 2016, vol 25, no 2, pp.189–208.
Tisdell, C., & Loch, B. How useful are closed captions for [22]
learning mathematics via online video? International Journal of Mathematical Education in Science and Technology, 2017, vol 48, no 2, pp. 229–243.
Sung, Y. T., Shih, P. C., & Chang, K. E. The effects of [23]
3D-representation instruction on composite-solid surface-area learning for elementary school students. Instructional Science, 2015, vol 43,no 1, 115–145. http://doi.org/10.1007/s11251-014-9331-8.
Wahab, A. R, Abdullah, A.H, Mokhtar, M., Atan, N. A, Abu, [24]
M.S. Evaluation by Experts and Designated Users on the Learning Strategy using SketchUp Make for Elevating Visual Spatial Skills and Geometry Thinking, Bolema, Rio Claro (SP), 2017, vol 31, no 58, pp. 819-840.
Erkoc, M. F. & Gecu, Z. The effects of using google [25]
sketchup on the mental rotation skills of eighth grade students, Educational Sciences: Theory & Practice, 2014, vol 13, no 2, pp. 1285-1294.
Budiyono, N. & Fitriana, L., The use of interactive media [26]
ispring suite 8 supported by google sketchup to improve students’ geometry skills based on hoffer’s theory, Journal of Physics: Conference Series, 2018, pp. 012075.
ISO9241-11. Ergonomic requirements for office work with [27]
visual display terminals (VDTs) Part II: Guidance on usability, 1998. Retrieved 20 March 2017, 2017, from https://www.iso.org./standard/16883.html.
Lund, A.M. (2001). Measuring Usability with the USE [28]