http://dx.doi.org/10.4236/jct.2014.514133
How to cite this paper: Varela, M., et al. (2014) Time to Progression of AFP (TPA) as a Predictor of Survival in Hepatocellular Carcinoma Treated with Sorafenib (SOR). Journal of Cancer Therapy, 5, 1332-1343.
http://dx.doi.org/10.4236/jct.2014.514133
Time to Progression of AFP (TPA) as a
Predictor of Survival in Hepatocellular
Carcinoma Treated with Sorafenib (SOR)
Maria Varela1*, Olegario Castaño-Fernández1, Marcelo Garrido2, Lorena Blanco-García1, Pablo Martínez-Camblor3,4, Alicia Mesa-Álvarez5, Carmen Navascués1,Valle Cadahía-Rodrigo1, Rafael Menéndez de Llano5, Ramon Pérez-Álvarez1, Maria Luisa González-Diéguez1, Manuel Rodríguez1
1Liver Unit, Department of Gastroenterology and Hepatology, Asturias Central University Hospital, Oviedo,
Spain
2Hemato-Oncology Department, Pontifical Catholic University of Chile, Santiago, Chile 3Research Support Unit, Biosanitary Research Unit (OIB/Ficyt), Oviedo, Spain
4Autonoma University of Chile, Santiago, Chile
5Department of Radiology, Hospital Universitario Central de Asturias, Oviedo, Spain
Email: *maria.varela.calvo@gmail.com, *maria.varelac@sespa.princast.es
Received 22 September 2014; revised 20 October 2014; accepted 14 November 2014
Copyright © 2014 by authors and Scientific Research Publishing Inc.
This work is licensed under the Creative Commons Attribution International License (CC BY). http://creativecommons.org/licenses/by/4.0/
Abstract
Background: The standard therapy in advanced hepatocellular carcinoma (HCC) is sorafenib (SOR), which has the inconvenience of toxicity and discontinuation. Patient selection and the use of early markers are critical for optimizing the potential benefit of SOR. Alpha-fetoprotein (AFP) has an es-tablished role in HCC prognosis. The objective was to evaluate whether AFP variation during SOR treatment reflects the lack of progression to SOR and can be used as a prognostic factor. Methods: AFP levels were prospectively analyzed in 114 patients to determine whether the time to progres-sion of AFP (TPA) at 3 months had a prognostic value for survival. Results: Between July 2007 and October 2012, 114 patients were included (mean age 64 years, 97 male, 96 with cirrhosis). Etiology was alcohol 47 (41%) and hepatitis C virus (HCV) 31 (27%). According to the Barcelona Clinic Liver Cancer (BCLC) staging system: A (one case), B (24 cases) and C (89 cases). The Child-Pugh was Class A in 89 cases. The general condition of the patient according to ECOG-PS was 0 in 73 cases. The me-dian duration of treatment was 5 months (3.47 - 6.53, 95% CI). The meme-dian overall survival (OS) was 9.23 months. The standard dose was maintained in 26 patients (22.8%). Sixty-seven percent of patients experienced at least one adverse event grade 3-4. The time to progression of AFP lower or higher than 3 months was an independent prognostic factor of OS (univariate and multivariate analysis): 8.10 vs. 18.85 months, P < 0.001. Conclusion: HCC treated with SOR with TPA > 3 months had longer OS, and TPA was an independent prognostic factor.
Keywords
Hepatocellular Carcinoma, Targeted Therapy, AFP, Sorafenib, Prognostic Value, Overall Survival
1. Introduction
Worldwide, HCC is the sixth cause of cancer mortality in women and the second cause in men [1]. The standard therapy for advanced hepatocellular carcinoma (HCC) is Sorafenib (SOR). Two randomized studies have shown that SOR offers benefits for overall survival (OS) [2] [3]. In previous years, different molecules, such as suniti-nib [4], brivanib [5], linifanib [6], and erlotinib [7], have been used for first-line treatment in advanced HCC, but they did not show superiority to SOR. Different molecules for second-line treatment have been tested. Brivanib [8] and everolimus [9] are cited; however, they haven’t shown benefits in patients with progression or those who are intolerant to SOR.
Proper patient selection and the use of biomarkers to evaluate the response to early treatment can help avoid toxicity in subgroups that do not benefit from therapy. Predictors of OS in patients treated with SOR include dermatological adverse events within the first 60 days [10]; treatment discontinuation in the first 90 days [11]; and several baseline characteristics: macroscopic vascular invasion; ECOG PS; baseline concentrations of Al-pha-fetoprotein (AFP), alkaline phosphatase (ALP), angiopoietin 2 (Ang2), and vascular endothelial growth factor (VEGF) [12].
Serum AFP levels are increased in 60% - 70% of patients, especially in those with advanced disease and HCC upon hepatitis B virus cirrhosis.
The evolution of AFP during locoregional treatment correlated with the imaging response according to the EASL guidelines; and it has been proposed as the best outcome predictor in HCC patients receiving intra-arterial treatment [13].
Several studies have assessed the evolution of AFP during systemic treatment with SOR [14]-[22]. A decrease of 20% - 50% of abnormal baseline AFP values measured between 2 - 8 weeks has been used as a response val-ue. The main problem of this approach is that patients with low AFP levels as well as those with slower reduc-tion of AFP will be excluded of the prognostic model. So, the aim of our study was to evaluate whether AFP variation during SOR treatment would reflect the lack of progression to SOR and if it could be used as a prog-nostic factor in all HCC patients.
2. Methods
This is a one-single centre prospective observational study. 114 patients were enrolled (July 2007-October 2012) and followed until October 2013.
2.1. Treatment
The patients were treated with 400 mg SOR b.i.d., if they had been classified with advanced or stage C disease according to the Barcelona Clinic Liver Cancer (BCLC-C) staging system (n = 89) [9] or if they had disease progression after surgical or locoregional therapies (BCLC-A, n = 1 or BCLC-B, n = 24). SOR treatment was continued until clinical progression, unacceptable toxicity level or wish of the patient.
2.2. Study Population
The study included patients with HCC confirmed by appearance of a focal liver nodule in a cirrhotic liver with EASL criteria in dynamic techniques [9] (n = 75). Tumor histology was obtained in cases of diagnostic uncer-tainty (n = 39), including patients with normal liver, chronic hepatitis and atypical images on Computarized Tomography and/or Magnetic Resonance Imaging (CT/MRI).
(se-rum creatinine ≤ 1.5 times the normal). Patients with chronic hepatitis B were treated with protease inhibitors (tenofovir/entecavir). Hepatitis C treatment was not given simultaneously with sorafenib. Patients coinfected with HIV were included.
All patients with liver cirrhosis (n = 96) were compensated; if they presented ascites, it was controlled with diuretics and a salt-free diet. All patients had a gastroscopy before the treatment; in cases of risk of esophageal varices bleeding, preventive treatment was performed according to the care protocol.
The patient had not received previously systemic treatment with other targeted therapies or chemotherapy. Patients who received SOR within a clinical trial or combined with radioembolization (Y90) or stereotactic ra-diotherapy were excluded. Patients with AFP measurements outside the reference laboratory and patients who received SOR for HCC recurrence in the post-transplant setting were also excluded.
All patients signed an informed consent form before beginning of treatment. The Ethics Committee, accord-ing with the provisions of the Good Clinical Practice Guidelines, the Declaration of Helsinki and local laws, ap-proved the analysis.
2.3. AFP Measurement
Serum AFP was prospectively collected at baseline and every 4 weeks during SOR treatment, using micropar-ticle enzyme immunoassay (Abbott Laboratories, Chicago, I); the upper normal limit is 10 ng/mL.
2.4. Evaluation and Follow-Up
Patients were evaluated at 2, 4, 8, 12 and every 8 weeks later on. In addition patients had free access to medical team as frequent as needed in case of adverse effects (AEs) or serious AEs (SAEs).
Each assessment included a detailed medical interview; physical examination; assessment of the patient’s toxicity record; AFP measurement; blood count; biochemical, hydroelectrolytic, liver, urine sediment and thyro-tropin-stimulating hormone analyses.
Tumor radiological evaluation was performed at 12 weeks and every 16 weeks thereafter; the first assessment point was chosen to select a moment before the median time to radiological progression [2] and before the me-dian time to clinical progression [2]. A multiphase computed tomography was used to assess baseline lesions and determine the tumor response according to RECIST criteria [23].
The radiological response was classified by RECIST criteria: complete response (CR), partial response (PR), stable disease (SD), and progression (P). Patients were managed with clinical, analytical, and imaging assess-ments until to exit the study. Follow-up was continued until the patient’s death.
SOR treatment was continued until the disease progressed clinically, defined by Eastern Cooperative Oncology Group (ECOG PS 3-4) (n = 47), unacceptable toxicity was observed (n = 53), or patient’s desire (n = 3). All patients were followed until the end of the study. Only one patient received second-line treatment, and in this case survival was censored at the moment of starting it.
2.5. Objectives of the Study
The aim of the study was to evaluate if AFP variation during SOR reflects the absence of HCC progression and its potential use as a prognostic factor.
The secondary objectives were:
a) Overall survival (OS), defined as the time between the start of SOR treatment and death from any cause, last follow-up or beginning of a second-line therapy.
b) Identification of prognostic factors associated with OS, considering clinical and analytical variables at baseline and during 90 days;
c) Analysis of toxicity during SOR, measured according to the common toxicity criteria of the U.S. National Institute of Cancer or Common Terminology Criteria for Adverse Events (CTCAE), version 3.0.
2.6. Definition of the Variable Time to Progression of AFP (TPA)
b) In patients with high AFP (>10 ng/mL), TPA was defined as the time between the start of SOR and the point at which AFP rises above the nadir. In clinical practice, we have observed that when AFP rises, this increase occurs exponentially.
The cutoff defined as TPA was calculated considering patients with high AFP, and it was applied to the entire cohort. After analyzing this time in tertiles, a TPA of 90 days was selected as the variable to be evaluated as a prognostic factor, because comprised early and late SOR progressions.
Patients were classified in: Group 1, poor prognosis, if they met the above criteria before day 90 and Group 2, good prognosis, if by day 90 this condition had not been met. Thus, after measuring the TPA, survival time be-gins at the time when the patient is classified as Groups 1 or 2 (Figure 1).
2.7. Statistical Analysis
The Kaplan-Meier method was used to calculate the overall survival, time to progression, TPA, and cumulative survival rate. Differences were determined using the log-rank test. The clinical variables and treatment responses of the two groups (TPA < 90 or TPA > 90 days) were compared using X2, Fisher’s exact test, or independent t- tests. Statistically significant factors in the univariate analysis were estimated using the multivariate Cox propor-tional hazard regression models. Statistical significance was defined as a P value < 0.05. Data were analyzed using SPSS v 14.0 software (SPSS, Chicago, IL, USA) and R (http://www.r-project.org/index.html; from Bell Labor-atories, formerly AT & T, now Lucent Technologies).
In addition to developing the TPA concept, we evaluated the Shao [18] and Personeni [20] model in our cohort to determine its applicability and predictive capacity in our patients. To calculate the time to radiographic pro-gression (RECIST criteria) and the time to clinical propro-gression, the combined event propro-gression/death was con-sidered, and Kaplan-Meier analysis was applied.
3. Results
3.1. Patients’ Baseline Characteristics
[image:4.595.119.504.431.654.2]Between July 2007-October 2012, 114 patients were included (mean age: 64 years, 97 males, 96 with cirrhosis).
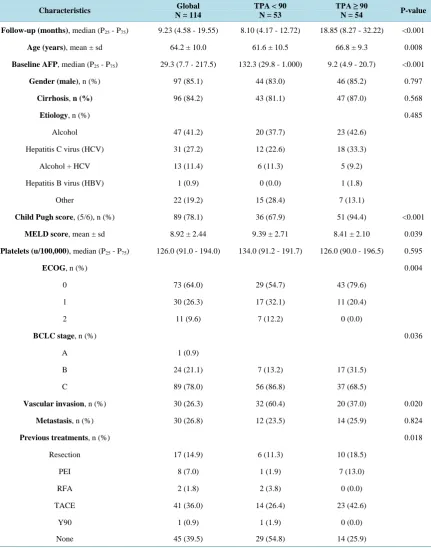
The etiologies of liver disease were as follows: alcohol, 47 (41%); hepatitis C virus (HCV), 31 (27%); mixed (HCV plus alcohol), 13 (11%); hepatitis B virus, 1 (0.9%). The liver cancer stages were classified according to the BCLC: BCLC-A, 1; BCLC-B, 24; BCLC-C, 89. The Child-Pugh classification was Class A in 89 cases. The general condition according to ECOG was 0 in 73 cases. The median baseline AFP was 29.3 ng/mL (interquar-tile range P25 - P75: 7.7 - 217.5). The details of population’s characteristics are shown in Table 1.
Table 1. Demographic and clinical characteristics of patients with advanced HCC treated with sorafenib (n = 114).
Characteristics Global
N = 114
TPA < 90 N = 53
TPA ≥ 90
N = 54 P-value
Follow-up (months),median (P25 - P75) 9.23 (4.58 - 19.55) 8.10 (4.17 - 12.72) 18.85 (8.27 - 32.22) <0.001
Age (years),mean ± sd 64.2 ± 10.0 61.6 ± 10.5 66.8 ± 9.3 0.008
Baseline AFP,median (P25 - P75) 29.3 (7.7 - 217.5) 132.3 (29.8 - 1.000) 9.2 (4.9 - 20.7) <0.001
Gender (male),n (%) 97 (85.1) 44 (83.0) 46 (85.2) 0.797
Cirrhosis, n (%) 96 (84.2) 43 (81.1) 47 (87.0) 0.568
Etiology, n (%) 0.485
Alcohol 47 (41.2) 20 (37.7) 23 (42.6)
Hepatitis C virus (HCV) 31 (27.2) 12 (22.6) 18 (33.3)
Alcohol + HCV 13 (11.4) 6 (11.3) 5 (9.2)
Hepatitis B virus (HBV) 1 (0.9) 0 (0.0) 1 (1.8)
Other 22 (19.2) 15 (28.4) 7 (13.1)
Child Pugh score, (5/6), n (%) 89 (78.1) 36 (67.9) 51 (94.4) <0.001
MELD score,mean ± sd 8.92 ± 2.44 9.39 ± 2.71 8.41 ± 2.10 0.039
Platelets (u/100,000),median (P25 - P75) 126.0 (91.0 - 194.0) 134.0 (91.2 - 191.7) 126.0 (90.0 - 196.5) 0.595
ECOG,n (%) 0.004
0 73 (64.0) 29 (54.7) 43 (79.6)
1 30 (26.3) 17 (32.1) 11 (20.4)
2 11 (9.6) 7 (12.2) 0 (0.0)
BCLC stage, n (%) 0.036
A 1 (0.9)
B 24 (21.1) 7 (13.2) 17 (31.5)
C 89 (78.0) 56 (86.8) 37 (68.5)
Vascular invasion,n (%) 30 (26.3) 32 (60.4) 20 (37.0) 0.020
Metastasis, n (%) 30 (26.8) 12 (23.5) 14 (25.9) 0.824
Previous treatments,n (%) 0.018
Resection 17 (14.9) 6 (11.3) 10 (18.5)
PEI 8 (7.0) 1 (1.9) 7 (13.0)
RFA 2 (1.8) 2 (3.8) 0 (0.0)
TACE 41 (36.0) 14 (26.4) 23 (42.6)
Y90 1 (0.9) 1 (1.9) 0 (0.0)
3.2. Treatment and Safety
Treatment with SOR was maintained for a median of 5 months (95% CI 3.47 - 6.53; mean 9.6 months). The daily maintenance dose was 800 mg in 26 patients (22.8%), 600 mg in 12 patients (10.5%), 400 mg in 47 pa-tients (41.2%), and 200 mg in 5 papa-tients (4.4%). In 24 papa-tients (21%), SOR was suspended before a maintenance dose was reached due to a serious AE.
SOR was temporarily reduced in response to grade 2 AE in 78 patients (68%), and was temporarily discon-tinued in 52 patients (45%) because of a grade 3-4 AE or decompensation of liver cirrhosis. The main cause of permanent interruption of SOR was tumor progression (47 patients, 41%).
[image:6.595.90.540.279.727.2]Ninety-four serious AE (grade 3-4) were observed in 78 patients (67%). In addition, 24 patients showed a second serious AE, and 5 had a third serious AE. The most common toxicities were fatigue (80%) and diarrhea (78%). There were 3 deaths potentially related to SOR: 1 death at home without autopsy, 1 intracranial hemorr-hage, and there was one death preceded by a hypertensive crisis. The details of 3-4 grade toxicities recorded during follow-up are presented in Table 2.
Table 2. Toxicity of sorafenib treatments in patients with advanced grade 3-4 HCC treated with sorafenib (n = 114)
accord-ing to the Common Terminology Criteria for Adverse Events (CT-CAE) scale version 3.0.
TOXICITY NUMBER (PERCENTAGE)
LIVER COMPLICATIONS 28 (29.8%)
Liver failure (ascites and/or grade I-II encephalopathy) 16
Upper bleeding by esophageal/fundic varices 7
Upper bleeding by portal hipertensive gastropathy 2
Hemoperitoneum 2
Grade IV hepatic encephalopathy 1
CARDIOVASCULAR 25 (26.6%)
Stroke (ischemic/hemorrhagic) 5/1
Distal vascular ischemia 6
Uncontrollable arterial hypertension 3
Cardiac arrhythmia 3
Cardiac ischemia 2
Sudden death 2
Cardiac failure 1
SKIN 14 (14.9%)
Hand-foot syndrome grade III/IV 12
Febrile generalized exfoliative dermatitis 1
Pustular psoriasis 1
INFECTIONS 14 (14.9%)
Pneumonia 5
Cholecystitis 2
Liver abscess 2
Appendicitis 1
Other 4
PAIN 8 (8.5%)
UPPER BLEEDING DUE TO GASTRIC/ESOPHAGEAL ULCER 4 (4.3%)
HYPOGLYCEMIC COMA 1 (1.1%)
3.3. Distribution of the Evolution of AFP (n = 114) and Calculation of the “TPA” Variable AFP was elevated during SOR treatment in 83 patients. AFP values did not increase in the first 3 months in 24 patients. Follow-up was less than 3 months in 7 patients, so they were excluded from the analysis. Mean time to progression of AFP was 150 days (95% CI 102 - 199 days). We grouped the TPA in tertiles and arbitrarily de-cided to split the study population (n = 107) into two groups according to the following characteristic: those who had elevated AFP before the 90th day after SOR (Group 1, TPA < 90, n = 53) versus those who did not have elevated AFP plus those that had elevated AFP after the 90th day after SOR (Group 2, TPA ≥ 90, n = 54). There were no differences in survival between those who did not have elevated AFP and those with late AFP elevation (P = 0.964). The applicability of the proposed primary endpoint was 93.9% (107/114).
We analyzed the differences between baseline characteristics of patients of Groups 1 and 2 (Table 1). The former were younger (P = 0.008) with higher baseline AFP levels (P < 0.001), impaired hepatocellular function (Child-Pugh stage, P < 0.001; MELD, P = 0.039), worse baseline ECOG (P = 0.004), advanced BCLC stages (P = 0.036), increased presence of vascular invasion (P = 0.02), and fewer prior treatments (P = 0.018). The median time to radiographic progression combined with overall survival was 4 months (IC 95% 3.86 - 6.55) in Group 1 and 8 months (IC 95% 6.81 - 12.82) in Group 2 (P = 0.006). The Group 1 had a shorter time to radiographic progression and decreased survival.
3.4. Overall Survival and Analysis of Prognostic Factors
At the end of the study 101 patients died and 13 patients were alive; 5 of them continued with SOR. The median time to clinical progression was 5 months (P25 - P75: 3 - 15 months), and the median time to radiographic
pro-gression applying RECIST criteria was 4 months (P25 - P75: 3 - 9.25 months). Median OS was 9.3 months (7.31 -
11.28, 95% CI; Figure 2). Statistically significant predictors of OS in the Cox proportional hazard model were: age, Child-Pugh stage, ECOG PS, BCLC stage, and the vascular invasion at time of starting with SOR (Table 3(a)). Additionally, belonging to TPA Groups 1 or 2 was an independent prognostic factor. Body mass index, metastasis, sex, baseline AFP level, grade 2-4 hypertension during the first 3 months, and grade 2-4 skin toxicity during the first 3 months were not predictors of OS. After multivariate analysis with stepwise inclusion (forward likelihood), only the variables ECOG and TPA entered the model (Table 3(b)).
[image:7.595.196.434.499.696.2]The median OS values according to TPA < 90 days (Group 1) and >90 days (Group 2) were 8.10 months and 18.85 months (P < 0.001; Figure 3). These medians were 5, 4 and 15 months from classification in Groups 1 and 2, respectively. As Table 4shows, the TPA criterion is a survival prognostic factor that retains its value in-dependent of the adjustment for baseline covariates, such as age, sex, baseline ECOG, baseline Child-Pugh stage, and baseline BCLC, with an HR of 2.422 (1457 - 4029, 95% CI), P = 0.001.
Table 3. (a) Univariate analysis of predictors of overall survival (n = 114); (b) Multivariate analysis of predictors of overall survival (n = 114).
(a)
Variable HR (95% CI) P-value
Age (years) 0.975 (0.956 - 0.995) 0.014
Baseline AFP 1.011 (0.985 - 1.038) 0.414
Gender (male) 1.028 (0.591 - 1.787) 0.922
Cirrhosis 1.154 (0.676 - 1.972) 0.594
Child-Pugh score 2.033 (1.265 - 3.268) 0.003
MELD score 1.069 (0.982 - 1.163) 0.125
ECOG
0 1 (Ref.)
1 2.980 (1.877 - 4.708) <0.001
2 17.01 (7.723 - 37.45) <0.001
BCLC stage
A 1 (Ref.)
B 0.024 (0.003 - 0.208) 0.001
C 0.063 (0.008 - 0.525) 0.011
Vascular invasion 1.754 (1.127 - 2.729) 0.013
Metastasis 1.197 (0.770 - 1.861) 0.425
TPA 2.930 (1.891 - 4.541) <0.001
(b)
Variable HR (95% CI) P-value
ECOG 2.97 (1.73 - 5.11) <0.001
TPA 2.69 (1.575 - 4.618) <0.001
[image:8.595.86.539.136.682.2]Table 4. Predictive model for survival from the time of classification in Group 1 versus Group 2 (time from TPA).
HR (95% CI) P-value
TPA 2.868 (1.828 - 4.498) <0.001
Model 1 2.737 (1.735 - 4.319) <0.001
Model 2 2.422 (1.457 - 4.029) 0.001
Model 1: + Age + Sex; Model 2: + Model 1 + ECOG + Child-Pugh + BCLC.
4. Discussion
The current study shows that TPA at 90 days is an independent prognostic factor of survival in advanced HCC. Other studies have analyzed the trend of AFP changes in patients undergoing treatment for advanced HCC (Table 5). Chen evaluated AFP with thalidomide (2005) [15]; Chan evaluated AFP using systemic chemothera-py (2009) [16]. Vora examined AFP changes with systemic treatment (chemotherapy and targeted therapies, 2009) [14]; Shao (2010) used multiple therapies, including chemotherapy, and targeted therapies, including SOR [17]. Yau (2011), Personeni and Kawaoka (2012), and Nakazawa (2013) [18]-[21] used different times and AFP cutoffs, and they only apply them to patients with abnormally high AFP, not to all patients, which prevented them from establishing a reference. In the SHARP study, baseline AFP was reported as a prognostic indicator of survival; however, the response to SOR was not provided [2]. Similarly, in the Asia-Pacific study [3], baseline AFP was measured, and its value for survival prognosis is mentioned, but there was no follow-up to assess its changes with treatment.
TPA determination at 3 months can capture early [16] and late responders [22], groups that may have dispa-rate periods of AFP progression. AFP response can be seen early as 2 weeks to 10 months after starting SOR. The assessment of early response (at one month or sooner) may reduce the analyzed patient population by ex-cluding patients with late AFP progression. This exclusion can be identified in Figure 4, which shows that early evaluation (the Shao model applied to our cohort) poorly discriminates patients with better and worse survival. Slow responses can be explained by aggregate mutations that may affect the main signaling pathway in tumor cell proliferation or angiogenesis, making them more sensitive to prolonged SOR administration. This pheno-menon should not be ignored, because late responses to SOR are common in HCC, colorectal and renal cancer, when the reintroduction of SOR has been proposed to control this occurrence [24] [25]. The clinical benefit of reintroducing a targeted agent has been confirmed in a randomized study of imatinib in gastrointestinal stromal tumors [26].
Despite the established role of AFP in the diagnosis of post-treatment recurrence of HCC, its use as an indi-cator of survival in patients treated with SOR remains controversial [27]. In this study, TPA can be determined during the first 3 months in patients treated with SOR, considering those with TPA < 90 days as having the worst prognosis, enabling the evaluation of changing to another systemic treatment avoiding side effects. Our model is highly applicable, including more than 90% of patients under treatment with SOR. We have revised the applica-bility of the Shao [17] and Personeni [19] models in our cohort they have low applicability because they exclude patients with normal AFP (23% of patients), although correlation with our model is acceptable (Figure 4).
Our results are based on clinical parameters, AFP levels, radiological assessment and survival outcomes ob-tained prospectively. Shao’s studies excluded 32 (76%) and Personeni 53 (62.4%) patients because they did not present reduced AFP [17]-[19]. In our study, TPA remains as a prognostic marker of overall survival and sur-vival time after assignment to Groups 1 or 2 for all patients except for those who survived less than 90 days. Our cohort analysis provided a model with a greatest applicability (93.9%) compared with other models reported previously, which range from 17% and 54.3% (Table 5).
In addition, the concept of TPA involves maintaining the response to SOR as the absence of progression. Be-cause this multikinase inhibitor treatment aims to slow the progression of the disease, the effect of treatment on HCC is best captured with this approach. We do not pursue early drug response (previous models, discussed in week 4 or 8) as much as the medium-term lack of progression while undergoing treatment (week 12).
Table 5. Clinical studies of advanced HCC with systemic treatment using the evaluation of AFP levels during treatment.
Year Author Ref. Study type N Applicability (%) Therapy
Abnormal AFP value (ng/mL)
Study objective
AFP response
(%)
AFP measure
(w)
HR-MV (OS) mOS
* P (MV)
2005 Chen [15] Prospective 42 24 Thalidomide >200 AFP
response >50 4 0.241 9.4/2.7 0.003
2009 Chan [16] Prospective 117 40 CT >20 AFP
response >20 8 0.413 13.5/5.6 <0.0001
2009 Vora [14] Prospective 107 16.8 CT-TT Any AFP
response >50 4 NR 13/6.3 0.004
2010 Shao [17] Prospective 72 17 CT-TT >20 AFP
response >20 2 0.356 15.3/4.1 0.019
2011 Yau [18] Prospective 94 54.3 Sorafenib >20 AFP
response >20 6 0.3 NA/5.35 0.05
2012 Personeni [19] Retrospective 85 37.6 Sorafenib >20 AFP
response >20 8 0.52 13.3/8.2 0.009
2012 Kawaoka [20] Retrospective 66 39 Sorafenib >20 Measurement of AFP >1 or <1
* 8 NR 12/6 0.001
2013 Nakazawa [21] Retrospective 59 54 Sorafenib Any AFP
response >20 4 4.14 NR 0.001
2014 Varela Actual Prospective 114 93.9 Sorafenib >10 TPA NR 12 2.42 18.8/8.1 0.001
Ref: Reference number; MV: Multivariate analysis; *mOS: Median OS with AFP response versus no response; w: Weeks; *: Ratio; CT: Chemotherapy; TT: Targeted therapy; NR: Not recorded; NA: Not achieved.
Figure 4. Survival figures for the study cohort (n = 114) following the criteria of Shao [17] (left, gray) and Personeni [19] (right, gray) versus the current study (black).
5. Conclusion
In conclusion, TPA at 3 months is a prognostic factor of overall survival and post-TPA survival in patients with advanced HCC treated with SOR. Patients with TPA > 3 months achieve longer survival than patients with a shorter TPA. These findings facilitate personalized patient management to optimize the benefits and reduce both toxicity and cost associated with SOR, and it may be taken into account in the design and stratification of pa-tients for second-line trials.
Conflicts of Interest
[image:10.595.127.501.389.557.2]References
[1] Ferlay, J., Shin, H.R., Bray, F., Forman, D., Mathers, C. and Parkin, D.M. (2010) Estimates of Worldwide Burden of Cancer in 2008: GLOBOCAN 2008. International Journal of Cancer, 127, 2893-2917.
http://dx.doi.org/10.1002/ijc.25516
[2] Llovet, J.M., Ricci, S., Mazzaferro, V., Hilgard, P., Gane, E., Blanc, J.F., de Oliveira, A.C., Santoro, A., Raoul, J.L., Forner, A., Schwartz, M., Porta, C., Zeuzem, S., Bolondi, L., Greten, T.F., Galle, P.R., Seitz, J.F., Borbath, I., Häussinger, D., Giannaris, T., Shan, M., Moscovici, M., Voliotis, D. and Bruix, J., SHARP Investigators Study Group (2008) Sorafenib in Advanced Hepatocellular Carcinoma. The New England Journal of Medicine, 359, 378-390. http://dx.doi.org/10.1056/NEJMoa0708857
[3] Cheng, A.L., Kang, Y.K., Chen, Z., Tsao, C.J., Qin, S., Kim, J.S., Luo, R., Feng, J., Ye, S., Yang, T.S., Xu, J., Sun, Y., Liang, H., Liu, J., Wang, J., Tak, W.Y., Pan, H., Burock, K., Zou, J., Voliotis, D. and Guan, Z. (2009) Efficacy and Safety of Sorafenib in Patients in the Asia-Pacific Region with Advanced Hepatocellular Carcinoma: A Phase III Ran-domised, Double-Blind, Placebo-Controlled Trial. The Lancet Oncology, 10, 25-34.
http://dx.doi.org/10.1016/S1470-2045(08)70285-7
[4] Cheng, A.L., Kang, Y.K., Lin, D.Y., Park, J.W., Kudo, M., Qin, S., Chung, H.C., Song, X., Xu, J., Poggi, G., Omata, M., Lowenthal, S.P., Lanzalone, S., Yang, L., Lechuga, M.J. and Raymond, E. (2013) Sunitinib versus Sorafenib in Advanced Hepatocellular Cancer: Results of a Randomized Phase III Trial. Journal of Clinical Oncology, 31, 4067- 4075. http://dx.doi.org/10.1200/JCO.2012.45.8372
[5] Johnson, P.J., Qin, S., Park, J.W., Poon, R.T., Raoul, R.J., Philip, A., Hsu, C.H., Hu, T.H., Heo, J., Xu, J., Lu, L., Chao, Y., Boucher, E., Han, K.H., Paik, S.W., Robles-Aviña, J., Kudo, M., Yan, L., Sobhonslidsuk, A., Komov, D., Decaens, T., Tak, W.Y., Jeng, L.B., Liu, D., Ezzeddine, R., Walters, I. and Cheng, A.L. (2013) Brivanib versus Sorafenib as First-Line Therapy in Patients with Unresectable, Advanced Hepatocellular Carcinoma: Results from the Randomized Phase III BRISK-FL Study.Journal of Clinical Oncology, 31, 3517-3524. http://dx.doi.org/10.1200/JCO.2012.48.4410
[6] Cainap, C., Qin, S., Huang, W.T., Chung, I.J., Pan, H., Cheng, Y., Kudo, M., Kang, Y.K., Chen, P.J., Toh, H.C., Gorbunova, V., Eskens, F., Qian, J., McKee, M.D., Ricker, J.L., Carlson, D.M. and Nowiem, S.E. (2013) Phase III Trial of Linifanib versus Sorafenib in Patients with Advanced Hepatocellular Carcinoma (HCC). Journal of Clinical
Oncology, 31, 249.
[7] Zhu, A.X., Rosmorduc, O., Evans, J., Ross, P., Santoro, A., Carrilho, F.J., Leberre, M.-A., Jensen, M., Meinhardt, G. and Kang, Y.K. (2012) A Phase III, Randomized, Double-Blind, Placebo-Controlled Trial of Sorafenib plus Erlotinib in Patients with Hepatocellular Carcinoma (HCC). Annals of Oncology, 23, 9.
[8] Llovet, J.M., Decaens, T., Raoul, J.L., Boucher, E., Kudo, M., Chang, C., Kang, Y.K., Assenat, E., Lim, H.Y., Boige, V., Mathurin, P., Fartoux, L., Lin, D.Y., Bruix, J., Poon, R.T., Sherman, M., Blanc, J.F., Finn, R.S., Tak, W.Y., Chao, Y., Ezzeddine, R., Liu, D., Walters, I. and Park, J.W. (2013) Brivanib in Patients With Advanced Hepatocellular Car-cinoma Who Were Intolerant to Sorafenib or for Whom Sorafenib Failed: Results from the Randomized Phase III BRISK-PS Study. Journal of Clinical Oncology, 31, 3509-3516. http://dx.doi.org/10.1200/JCO.2012.47.3009
[9] Zhu, A.X., Kudo, M., Assenat, E., Cattan, S., Kang, Y.K., Lim, H.Y., Poon, R.T., Blanc, J.F., Vogel, A., Chen, C.L., Dorval, E., Peck-Radosavljevic, M., Santoro, A., Daniele, B., Furuse, J., Jappe, A., Perraud, K., Anak, O., Sellami, D.B. and Chen, L.T. (2014) Effect of Everolimus on Survival in Advanced Hepatocellular Carcinoma after Failure of Sorafenib: The EVOLVE-1 Randomized Clinical Trial. JAMA, 312, 57-67.
[10] Reig, M., Torres, F., Rodriguez-Lope, C., Forner, A., Llarch, N., Rimola, J., Darnell, A., Ríos, J., Ayuso, C. and Bruix, J. (2014) Early Dermatologic Adverse Events Predict Better Outcome in HCC Patients Treated with Sorafenib. Journal
of Hepatology, 14, 211-216.
[11] Nojiri, S., Kusakabe, A., Fujiwara, K., Shinkai, N., Matsuura, K., Iio, E., Miyaki, T., Nomura, T., Sobue, S., Sano, H., Hasegawa, I., Ohno, T., Takahashi, Y., Orito, E. and Joh, T. (2012) Clinical Factors Related to Long-Term Administra- tion of Sorafenib in Patients with Hepatocellular Carcinoma. Cancer Management and Research, 4, 423-429.
http://dx.doi.org/10.2147/CMAR.S38684
[12] Llovet, J.M., Peña, C.E. and Lathia, C.D., SHARP Investigators Study Group (2012) Plasma Biomarkers as Predictors of Outcome in Patients with Advanced Hepatocellular Carcinoma. Clinical Cancer Research, 18, 2290-2300.
http://dx.doi.org/10.1158/1078-0432.CCR-11-2175
[13] Memon, K., Kulik, L., Lewandowski, R.J., Wang, E., Ryu, R.K., Riaz, A,, Nikolaidis, P., Miller, F.H., Yaghmai, V., Baker, T., Abecassis, M., Benson, A.B., Mulcahy, M.F., Omary, R.A. and Salem, R. (2012) α-Fetoprotein Response Correlates with EASL Response and Survival in Solitary Hepatocellular Carcinoma Treated with Transarterial Thera-pies: A Subgroup Analysis. Journal of Hepatology, 56, 1112-1120. http://dx.doi.org/10.1016/j.jhep.2011.11.020
[15] Chen, L.T., Liu, T.W., Chao, Y., Shiah, H.S., Chang, J.Y., Juang, S.H., Chen, S.C., Chuang, T.R., Chin, Y.H. and Whang-Peng, J. (2005) α-Fetoprotein Response Predicts Survival Benefits of Thalidomide in Advanced Hepatocellular Carcinoma. Alimentary Pharmacology & Therapeutics, 22, 217-226.
http://dx.doi.org/10.1111/j.1365-2036.2005.02547.x
[16] Chan, S.L., Mo, F.K., Johnson, P.J., Hui, E.P., Ma, B.B., Ho, W.M., Lam, K.C., Chan, A.T., Mok, T.S. and Yeo, W. (2009) New Utility of an Old Marker: Serial α-Fetoprotein Measurement in Predicting Radiologic Response and Survi- val of Patients with Hepatocellular Carcinoma Undergoing Systemic Chemotherapy. Journal of Clinical Oncology, 27, 446-452. http://dx.doi.org/10.1200/JCO.2008.18.8151
[17] Shao, Y.Y., Lin, Z.Z., Hsu, C., Shen, Y.C., Hsu, C.H. and Cheng, A.L. (2010) Early α-Fetoprotein Response Predicts Treatment Efficacy of Antiangiogenic Systemic Therapy in Patients with Advanced Hepatocellular Carcinoma. Cancer, 116, 4590-4596. http://dx.doi.org/10.1002/cncr.25257
[18] Yau, T., Yao, T.J., Chan, P., Ng, K., Fan, S.T. and Poon, R.T. (2008) A New Prognostic Score System in Patients with Advanced Hepatocellular Carcinoma Not Amendable to Locoregional Therapy: Implication for Patient Selection in Systemic Therapy Trials. Cancer, 113, 2742-2751. http://dx.doi.org/10.1002/cncr.23878
[19] Personeni, N., Bozzarelli, S., Pressiani, T., Rimassa, L., Tronconi, M.C., Sclafani, F., Carnaghi, C., Pedicini, V., Gior- dano, L. and Santoro, A. (2012) Usefulness of α-Fetoprotein Response in Patients Treated with Sorafenib for Ad-vanced Hepatocellular Carcinoma. Journal of Hepatology, 57, 101-107. http://dx.doi.org/10.1016/j.jhep.2012.02.016
[20] Kawaoka, T., Aikata, H., Murakami, E., Nakahara, T., Naeshiro, N., Tanaka, M., Honda, Y., Miyaki, D., Nagaoki, Y., Takaki, S., Hiramatsu, A., Waki, K., Takahashi, S. and Chayama, K. (2012) Evaluation of the mRECIST and α-Feto- protein Ratio for Stratification of the Prognosis of Advanced-Hepatocellular-Carcinoma Patients Treated with Sorafe-nib. Oncology, 83, 192-200. http://dx.doi.org/10.1159/000341347
[21] Nakazawa, T., Hidaka, H., Takada, J., Okuwaki, Y., Tanaka, Y., Watanabe, M., Shibuya, A., Minamino, T., Kokubu, S. and Koizumi, W. (2013) Early Increase in α-Fetoprotein for Predicting Unfavorable Clinical Outcomes in Patients with Advanced Hepatocellular Carcinoma Treated with Sorafenib. European Journal of Gastroenterology & Hepatology, 25, 683-689. http://dx.doi.org/10.1097/MEG.0b013e32835d913b
[22] Okuwaki, Y., Nakazawa, T., Hidaka, H., Shibuya, A. and Koizumi, W. (2012) Late-Onset Benefit in Progressive Ad-vanced Hepatocellular Carcinoma with Continued Sorafenib Therapy: A Case Report. Journal of Medical Case
Re-ports, 6, 38. http://dx.doi.org/10.1186/1752-1947-6-38
[23] European Association for the Study of the Liver; European Organisation for Research and Treatment of Cancer (2012) EASL-EORTC Clinical Practice Guidelines: Management of Hepatocellular Carcinoma. Journal of Hepatology, 56, 908-943.
[24] Zhang, L., Bhasin, M., Schor-Bardach, R., Wang, X., Collins, M.P., Panka, D., Putheti, P., Signoretti, S., Alsop, D.C., Libermann, T., Atkins, M.B., Mier, J.W., Goldberg, S.N. and Bhatt, R.S. (2011) Resistance of Renal Cell Carcinoma to Sorafenib Is Mediated by Potentially Reversible Gene Expression. PLoS ONE, 6, e19144.
http://dx.doi.org/10.1371/journal.pone.0019144
[25] Naito, S., Tsukamoto, T., Murai, M., Fukino, K. and Akaza, H. (2011) Overall Survival and Good Tolerability of Long-Term Use of Sorafenib after Cytokine Treatment: Final Results of a Phase II Trial of Sorafenib in Japanese Pa-tients with Metastatic Renal Cell Carcinoma. BJU International, 108, 1813-1819.
http://dx.doi.org/10.1111/j.1464-410X.2011.10281.x
[26] Kang, Y.K., Ryu, M.H., Yoo, C., Ryoo, B.Y., Kim, H.J., Lee, J.J., Nam, B.H., Ramaiya, N., Jagannathan, J. and De- metri, G.D. (2013) Resumption of Imatinib to Control Metastatic or Unresectable Gastrointestinal Stromal Tumours after Failure of Imatinib and Sutinib (RIGHT): A Randomized, Placebo-Controlled, Phase 3 Trial. The Lancet Oncol-ogy, 14, 1175-1182. http://dx.doi.org/10.1016/S1470-2045(13)70453-4
[27] Nakao, K. and Ichikawa, T. (2013) Recent Topics on α-Fetoprotein. Hepatology Research, 43, 820-825.
http://dx.doi.org/10.1111/hepr.12052
[28] Shin, S.Y. and Lee, Y.J. (2013) Correlation of Skin Toxicity and Hypertension with Clinical Benefit in Advanced He-patocellular Carcinoma Patients Treated with Sorafenib. International Journal of Clinical Pharmacology and


![Figure 4. Survival figures for the study cohort (n = 114) following the criteria of Shao [17] (left, gray) and Personeni [19] (right, gray) versus the current study (black)](https://thumb-us.123doks.com/thumbv2/123dok_us/8151009.802591/10.595.57.539.101.356/figure-survival-figures-following-criteria-personeni-versus-current.webp)
